
fig9
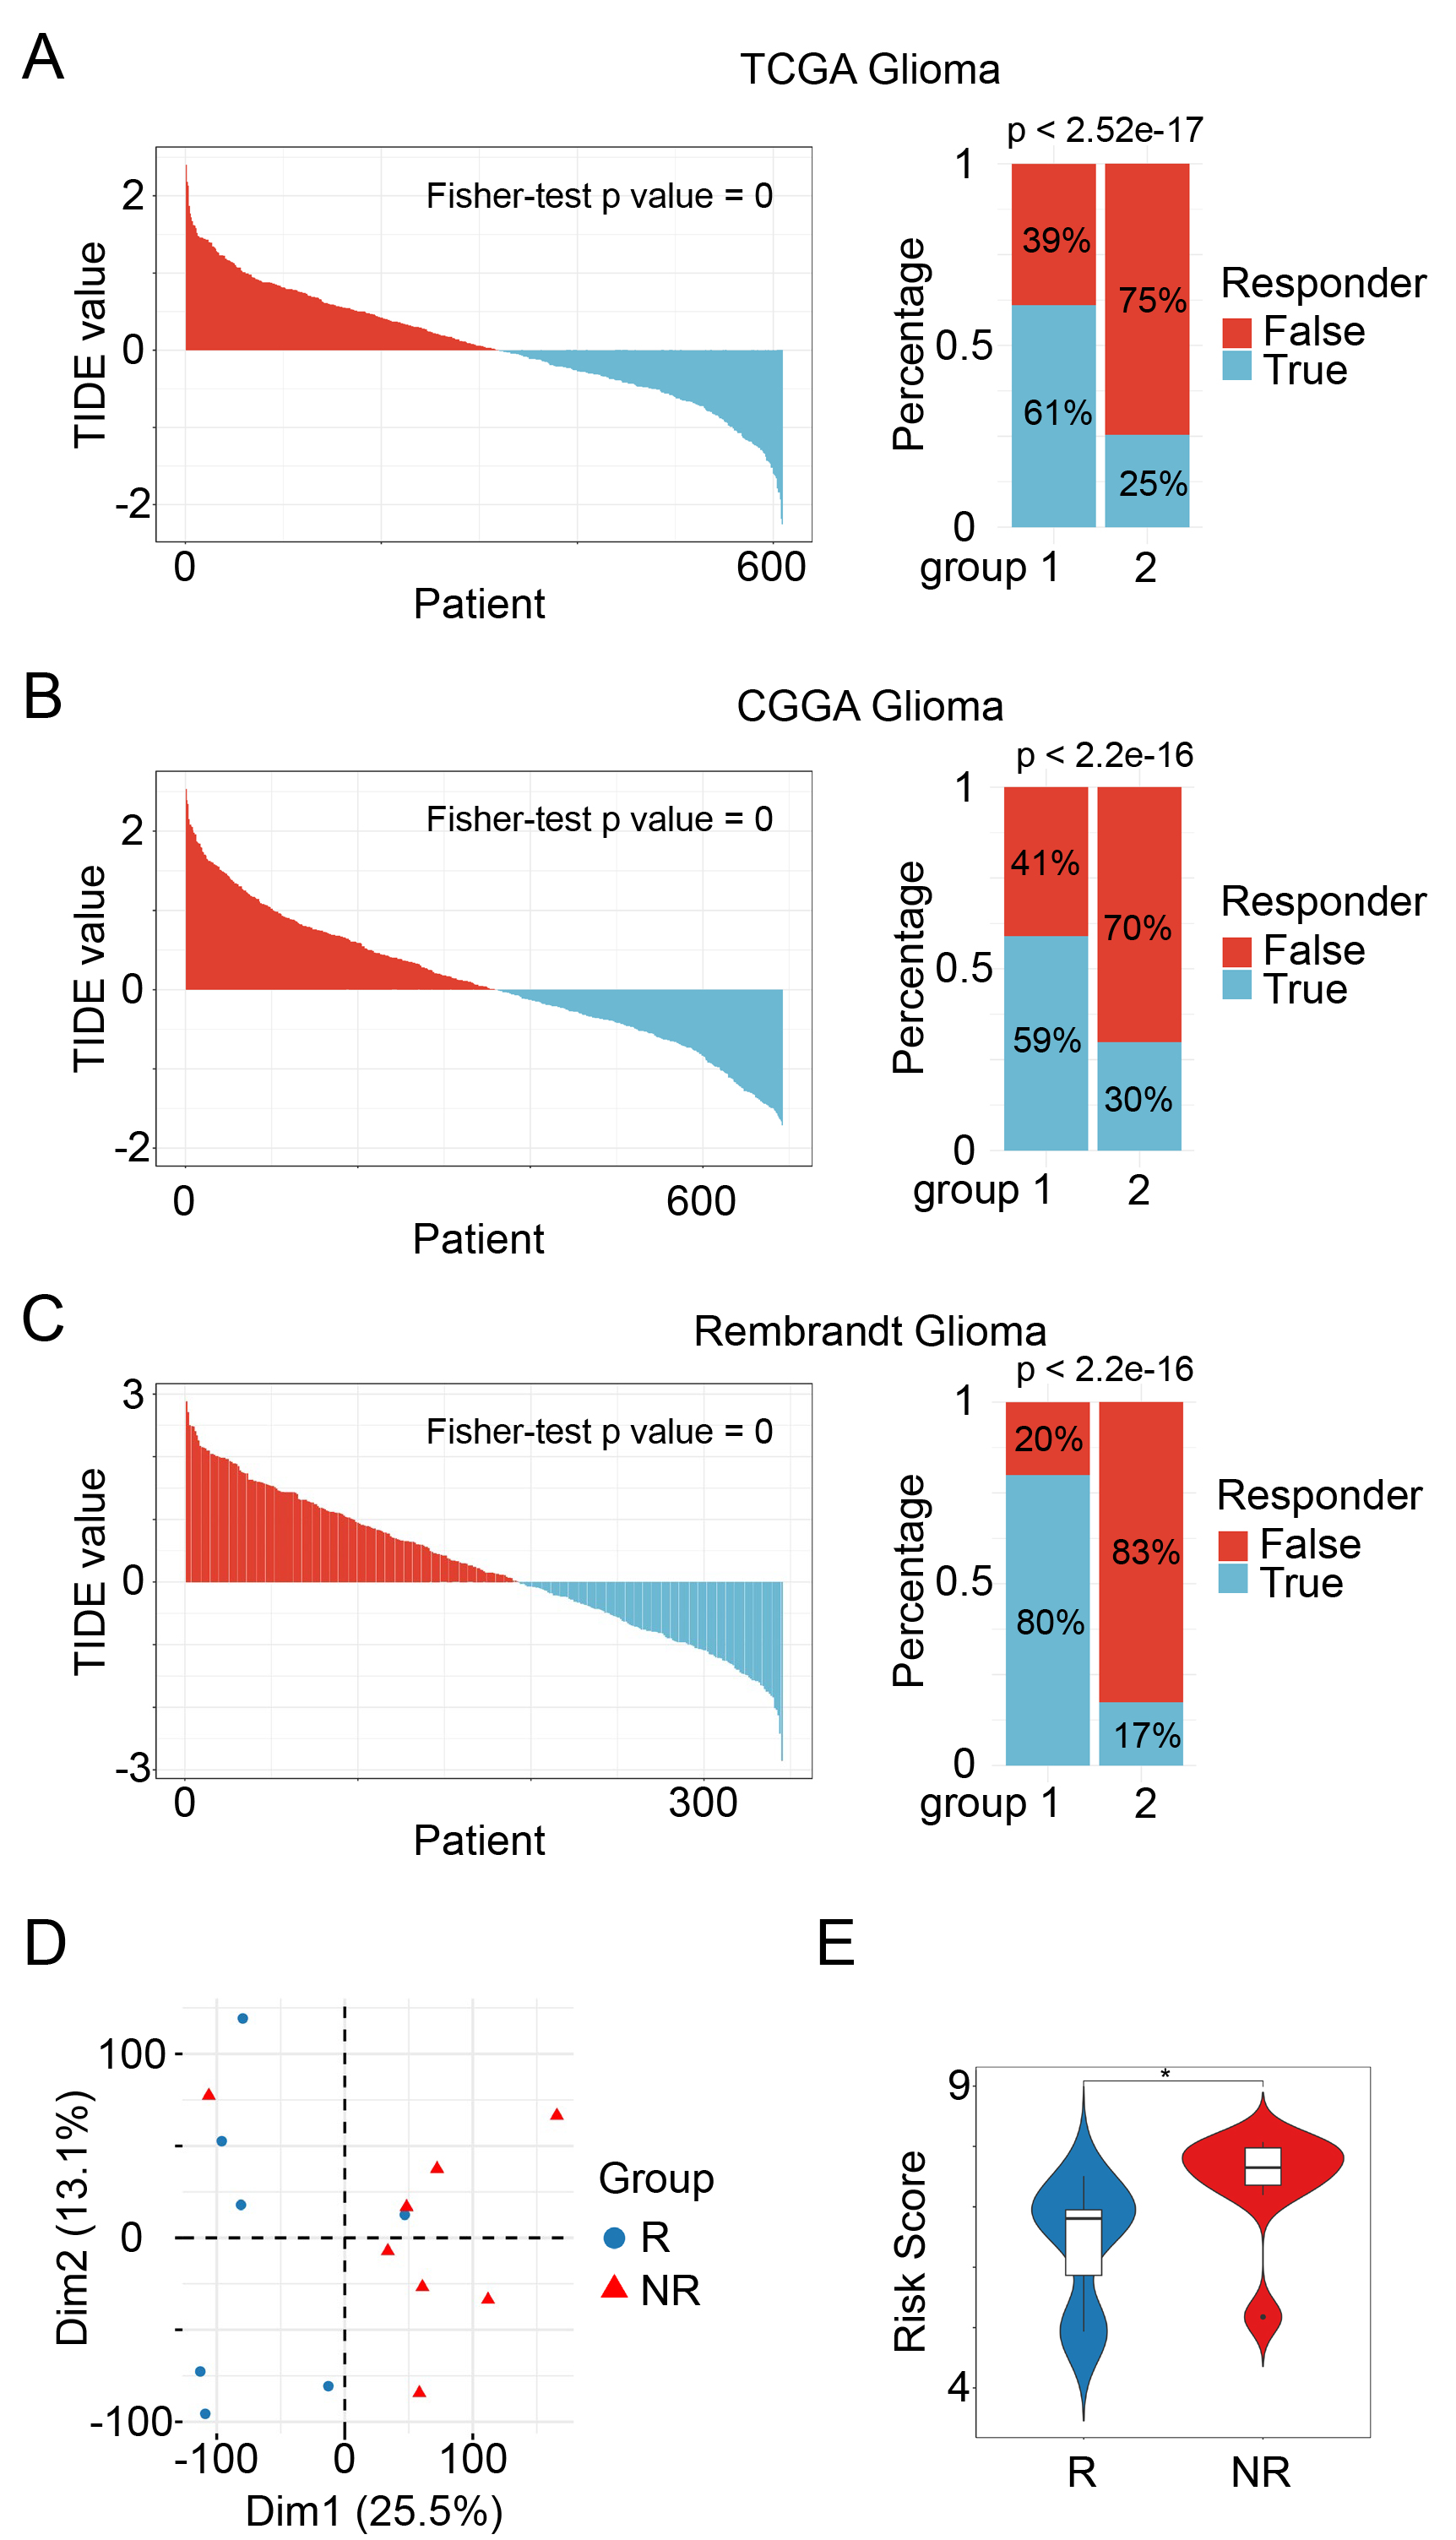
Figure 9. Predictive value of the risk model for immunotherapy response in glioma. The left column presents bar plots illustrating the distribution of TIDE scores among glioma patients. The right column depicts the proportion of potential immunotherapy responders, demonstrating a significantly higher response rate among low-risk glioma patients compared to high-risk patients across three independent glioma cohorts: (A) TCGA, (B) CGGA, (C) REMBRANDT; (D) PCA revealed distinct clustering between GBM responders and non-responders to neoadjuvant anti-PD-1 immunotherapy, emphasizing the differences in gene expression patterns associated with treatment response; (E) The risk model effectively distinguished non-responders from responders, with the former exhibiting significantly elevated risk scores, thereby underscoring its predictive power for immunotherapeutic response. *, P < 0.05. TIDE: Tumor immune dysfunction and exclusion; PCA: principal component analysis; GBM: glioblastoma; TCGA: The Cancer Genome Atlas; CGGA: Chinese Glioma Genome Atlas.