
fig8
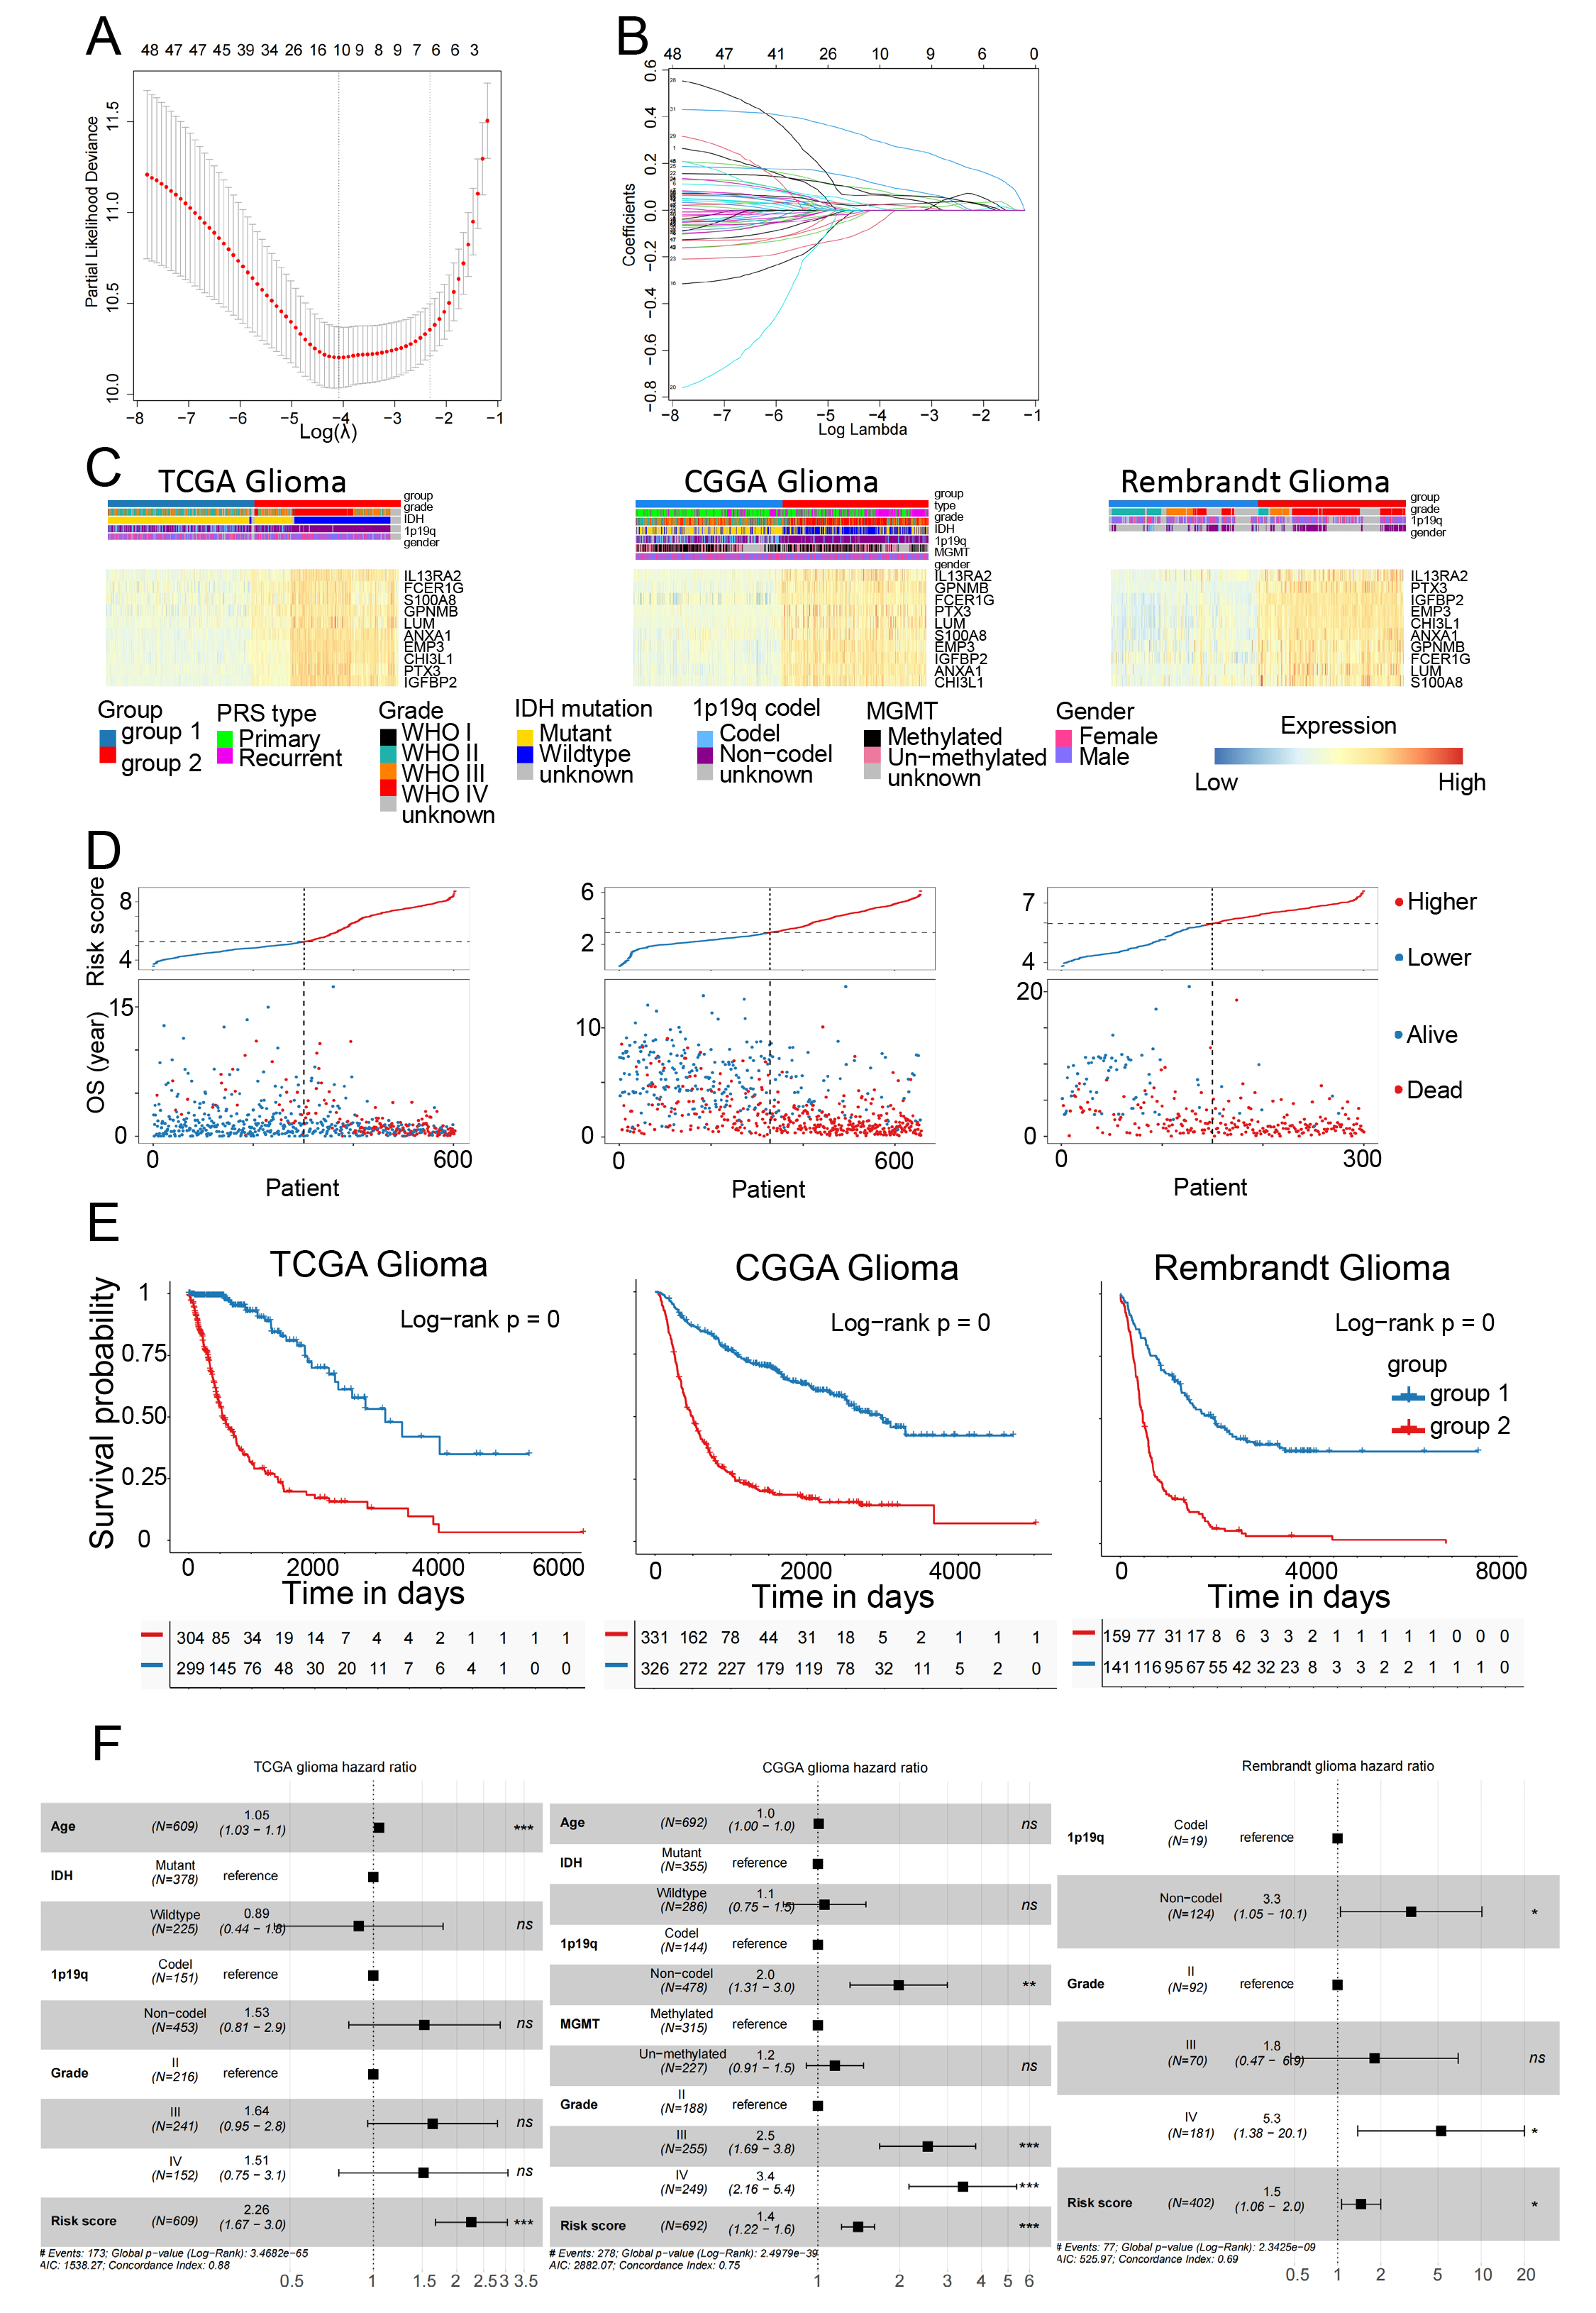
Figure 8. Development and validation of a prognostic risk model for glioma. (A) LASSO regression analysis identified ten key genes as active covariates for constructing the glioma risk prediction model; (B) LASSO regression analysis was applied to calculate the coefficients of the 10 chosen genes; (C) A heatmap visualization illustrated the clinical characteristics and expression profiles of the ten core DEGs across high-risk and low-risk glioma patient groups; (D) Risk score distribution and survival status plots revealed that high-risk patients exhibited an increased likelihood of mortality; (E) Survival analysis indicated a significant association between high-risk status and shortened overall survival in glioma patients; (F) Multivariable Cox regression validated the risk score as an independent prognostic factor for glioma, adjusting for clinical variables. DEGs: Differentially expressed genes; LASSO: least absolute shrinkage and selection operator; TCGA: The Cancer Genome Atlas; CGGA: Chinese Glioma Genome Atlas.