
fig5
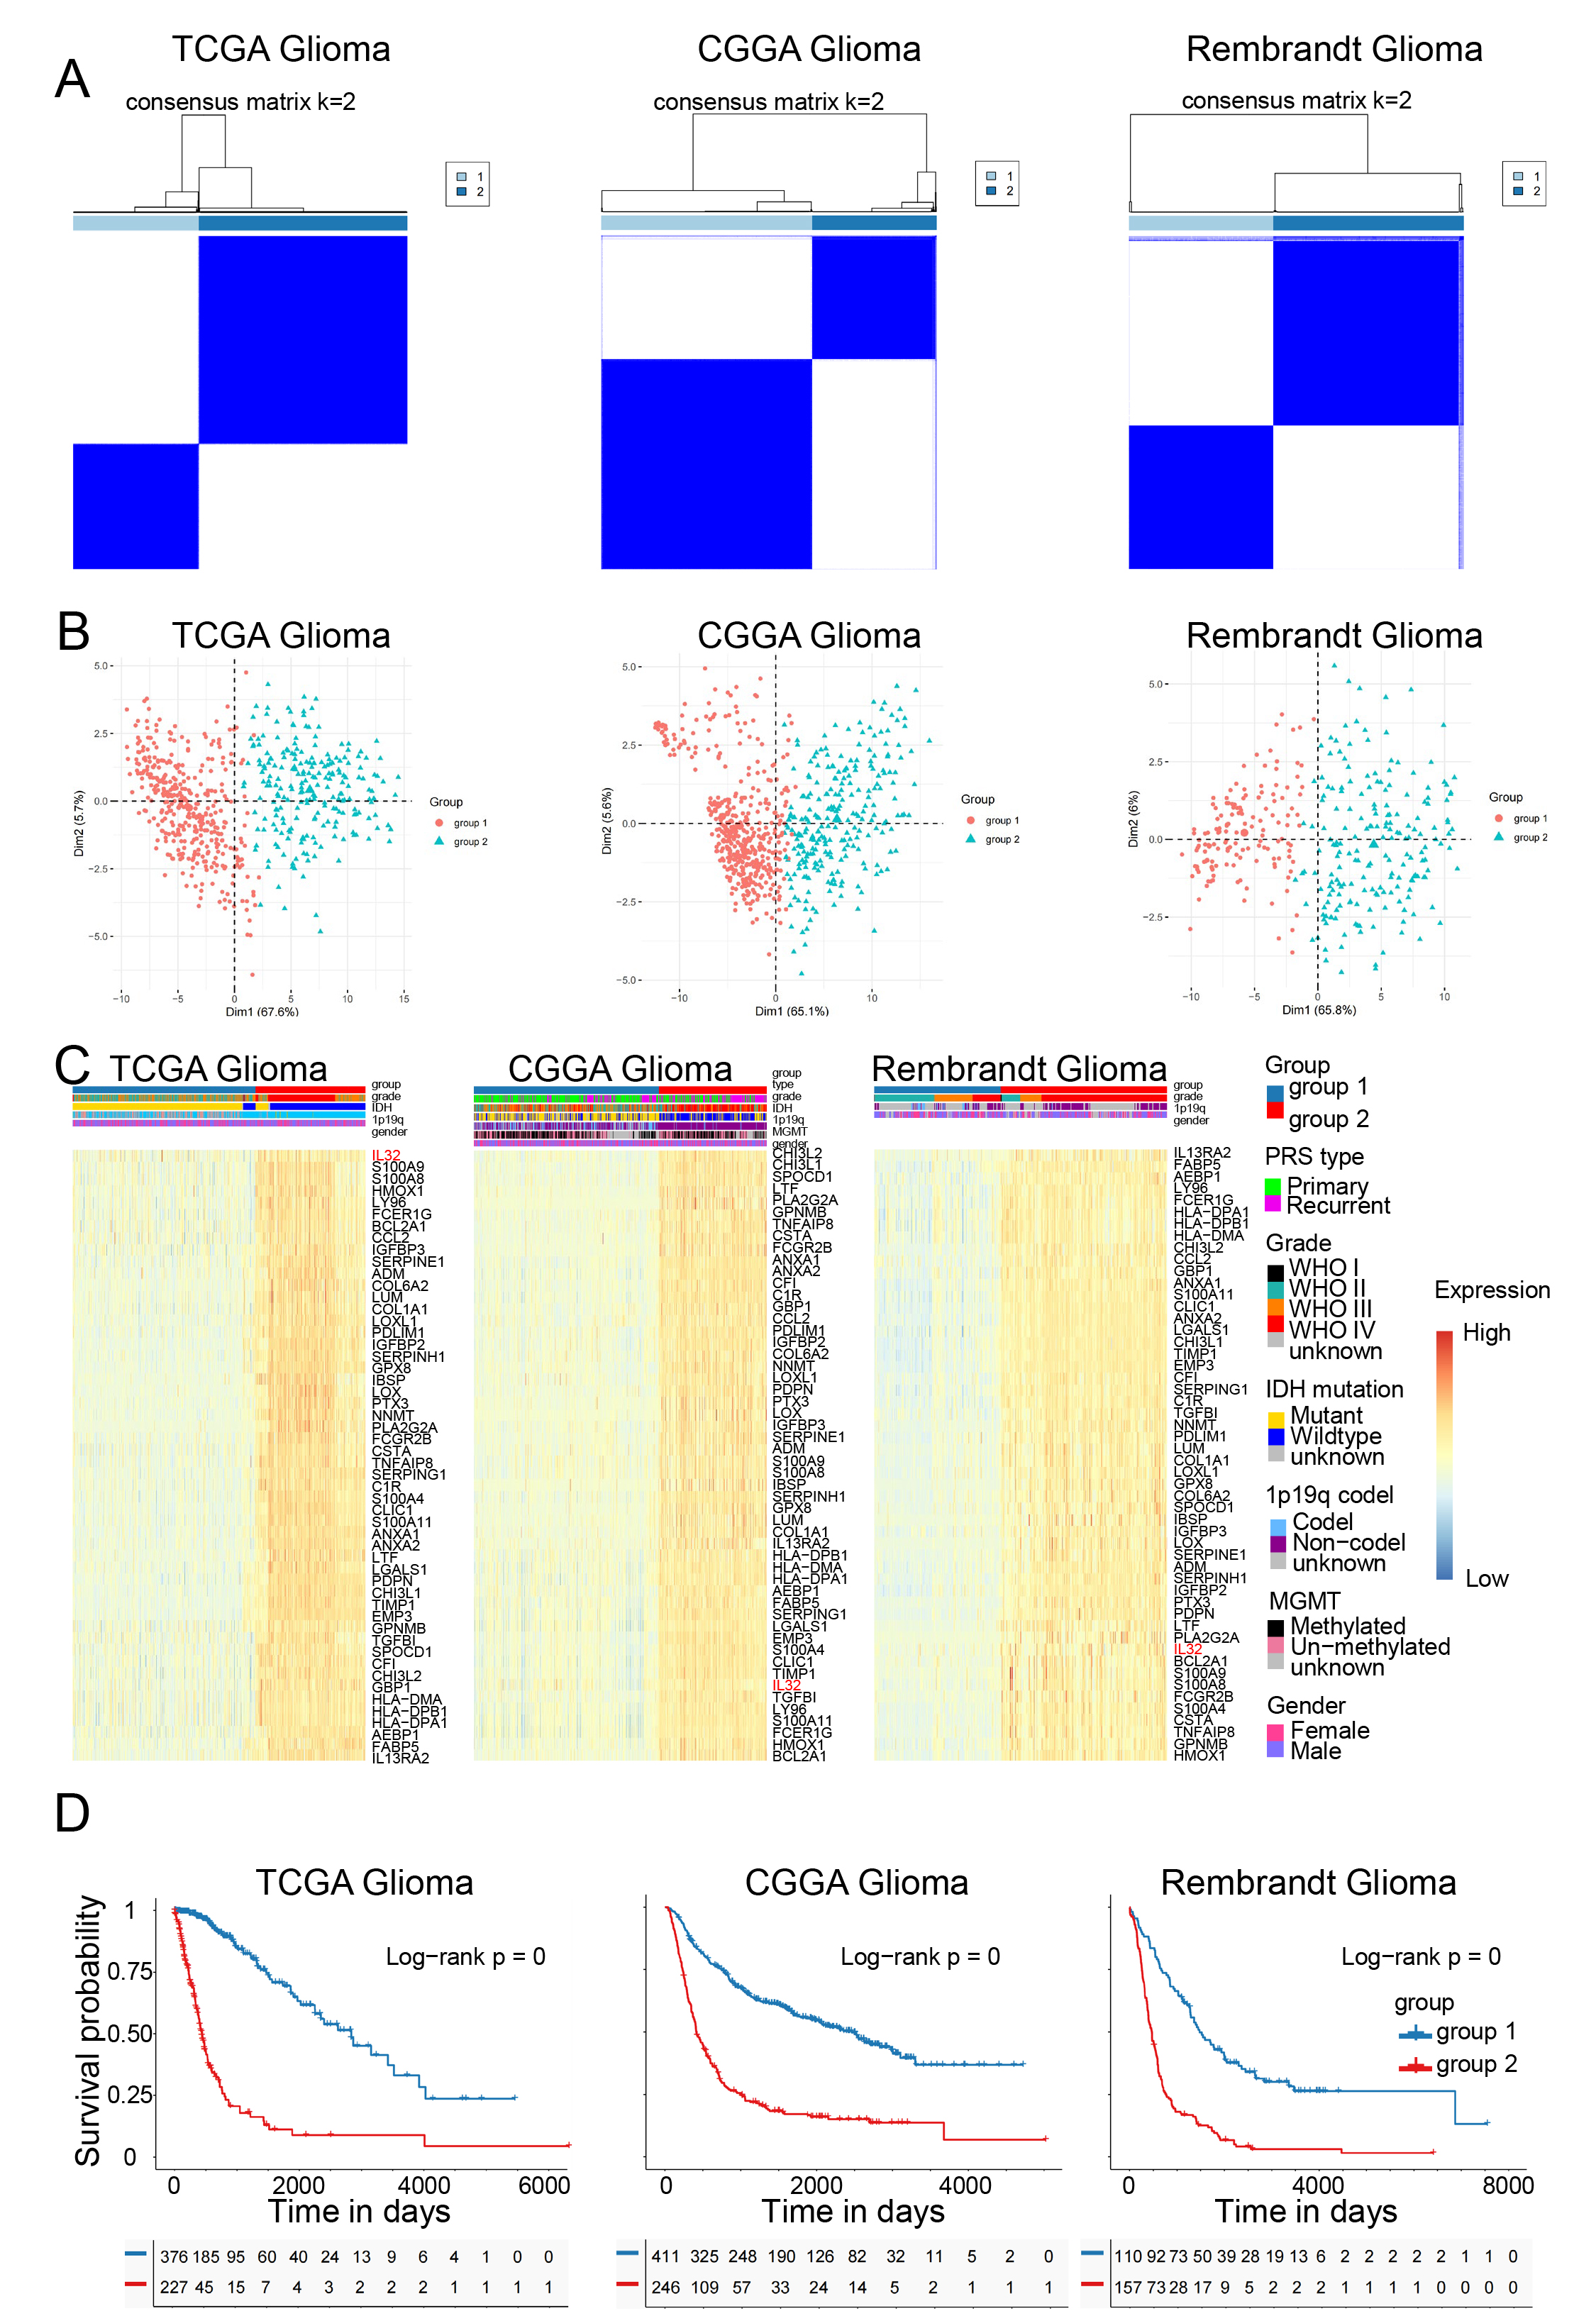
Figure 5. Survival analysis and subtype identification based on intersected DEGs in glioma. (A) Consensus clustering analysis was performed to determine the optimal number of clusters (k) for glioma patients across the TCGA, CGGA, and REMBRANDT datasets. The results identified two distinct molecular subtypes (k = 2), suggesting a robust classification scheme; (B) Principal component analysis further validated the clustering results. The first principal component effectively separated subtype 1 and subtype 2, demonstrating the distinct transcriptional landscapes of these glioma subtypes; (C) A heatmap visualization illustrated the clinical characteristics and expression profiles of 51 DEGs across the two subtypes. Notably, subtype 2 exhibited significantly higher expression of these DEGs, suggesting a more aggressive molecular phenotype; (D) Kaplan-Meier survival analysis revealed a significant reduction in OS for patients in subtype 2 compared to subtype 1, indicating the potential prognostic relevance of this classification. DEGs: Differentially expressed genes; OS: overall survival; WHO: World Health Organization; TCGA: The Cancer Genome Atlas; CGGA: Chinese Glioma Genome Atlas.