fig10
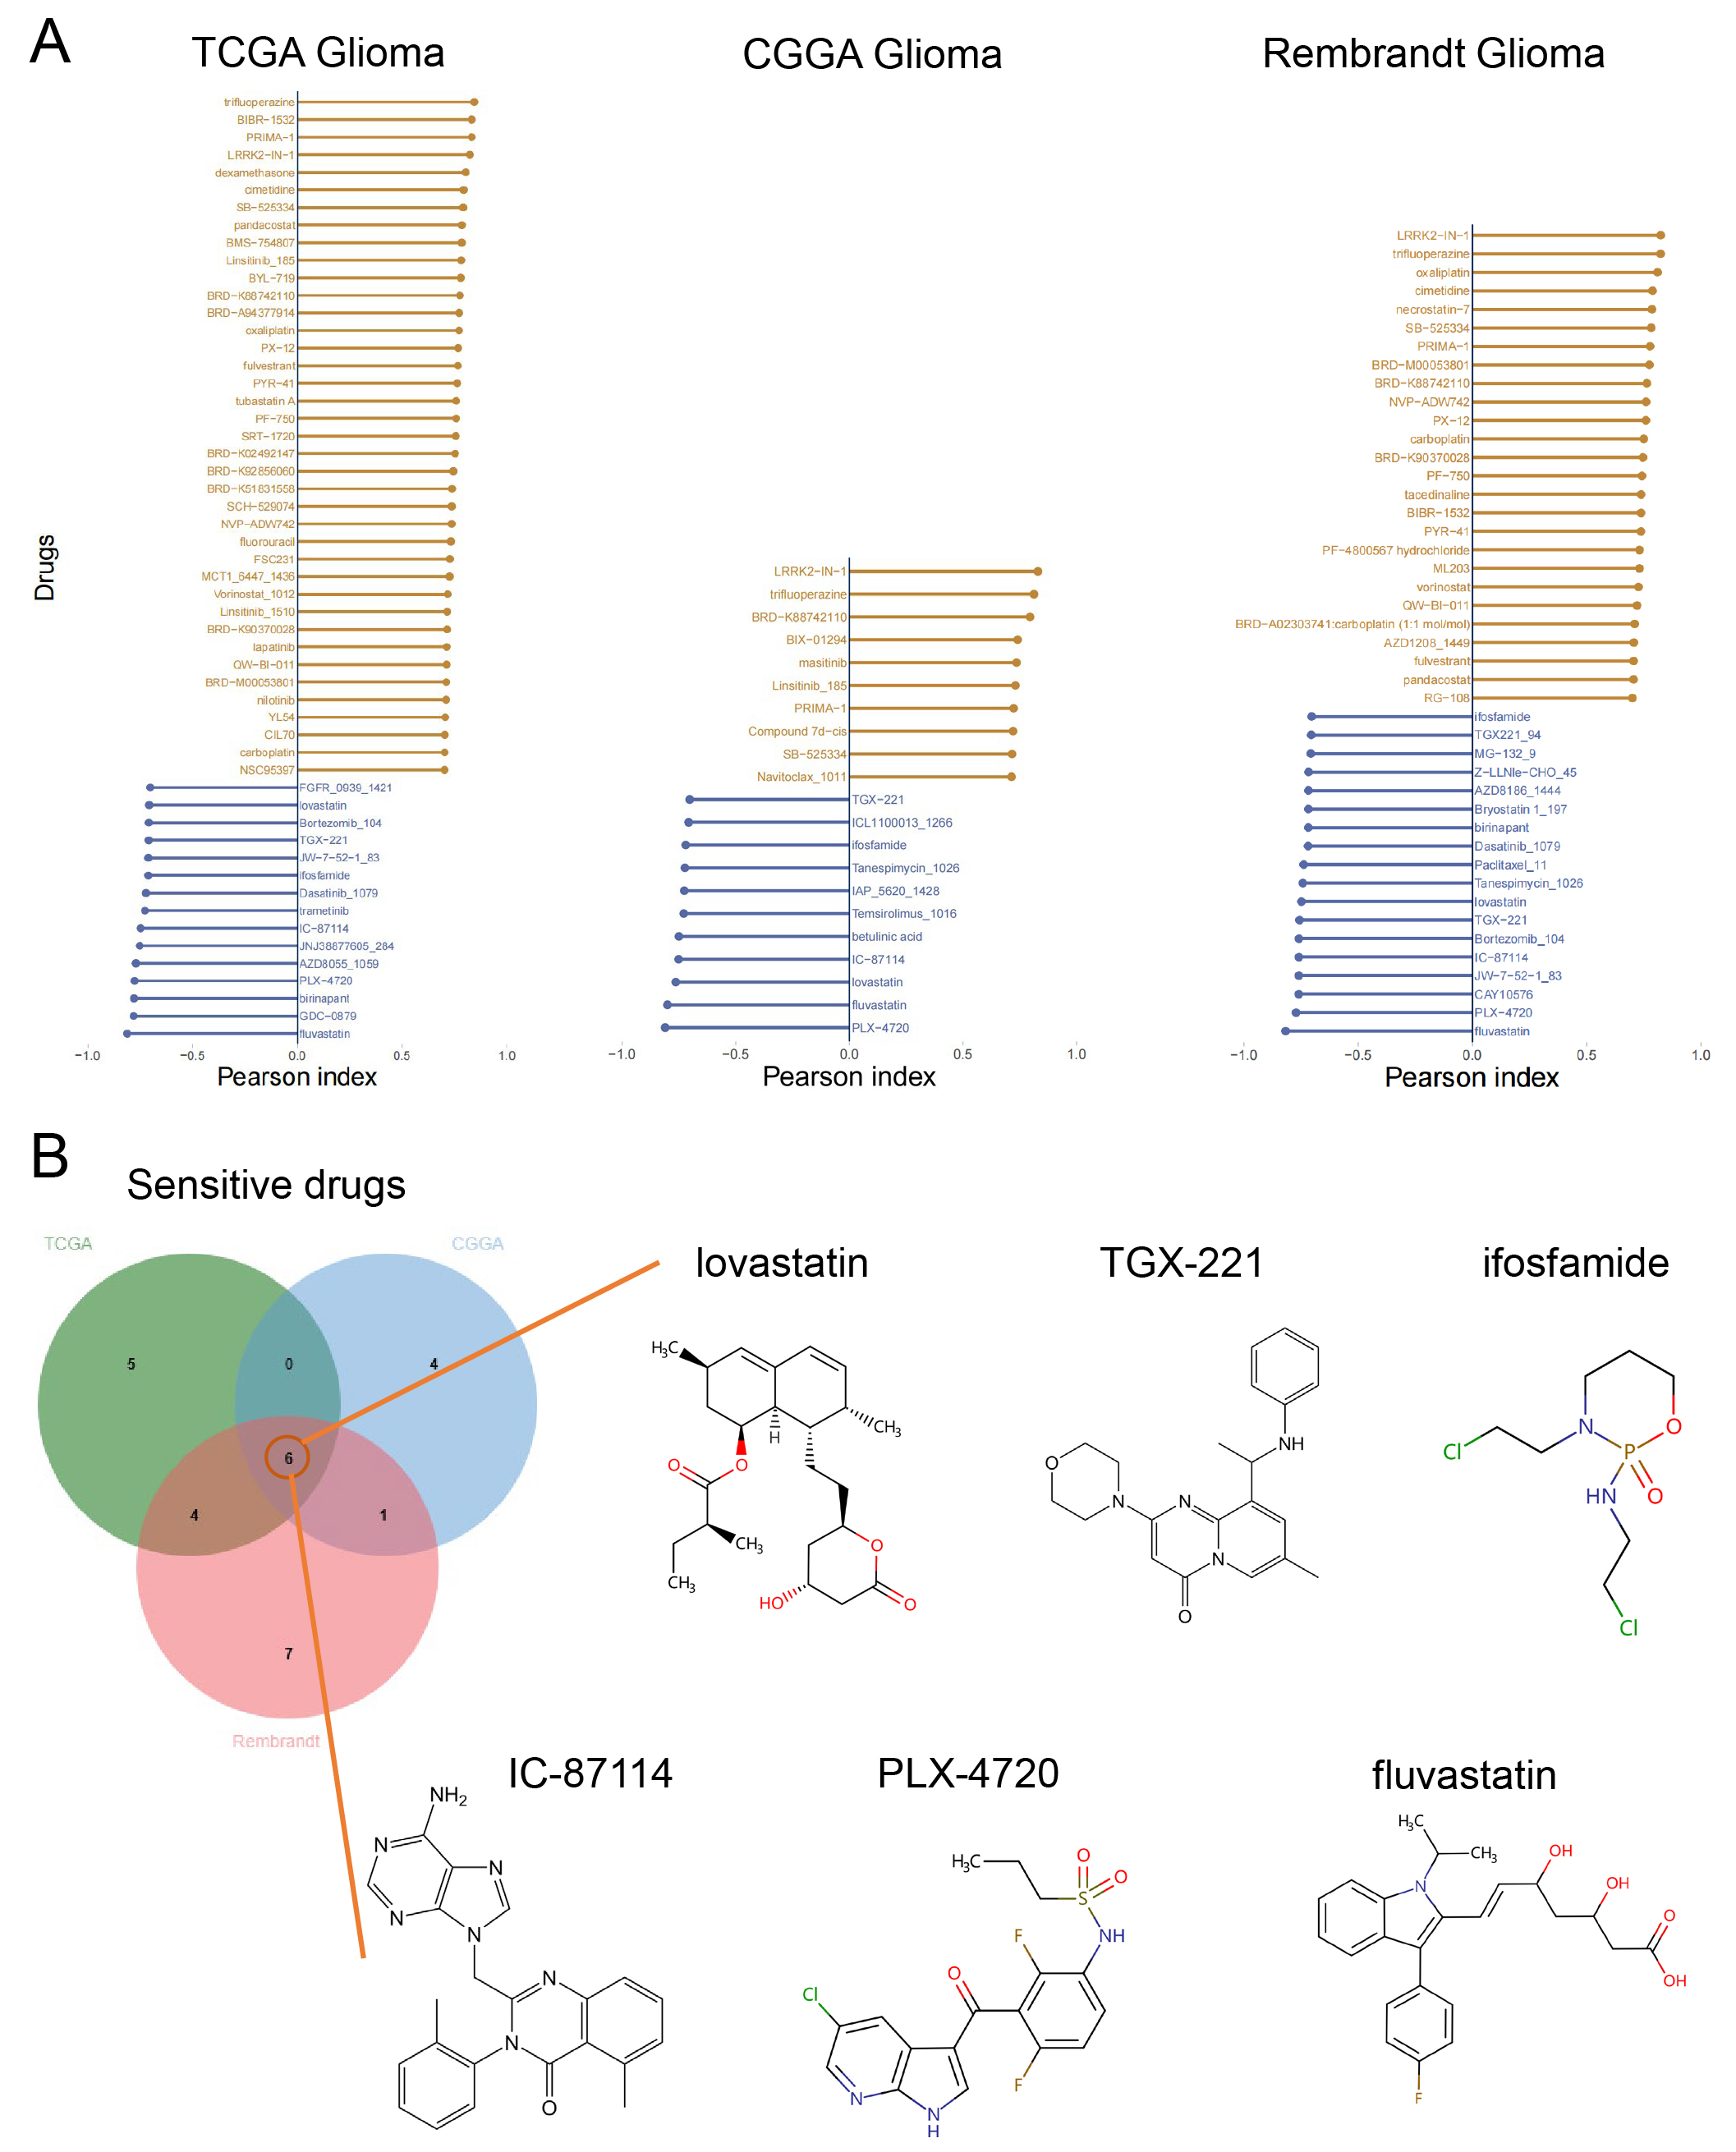
Figure 10. Identification of potentially effective drugs for high-risk glioma patients. (A) Lollipop plots illustrate the Pearson correlation coefficients between the risk score and IC50 values of various drugs across three independent glioma cohorts; (B) A Venn diagram identifies six drugs that are more likely to be effective in high-risk glioma patients, as they consistently demonstrated significant correlations with the risk score across all three cohorts. IC50: Half-Maximal Inhibitory Concentration; TCGA: The Cancer Genome Atlas; CGGA: Chinese Glioma Genome Atlas.