


fig7
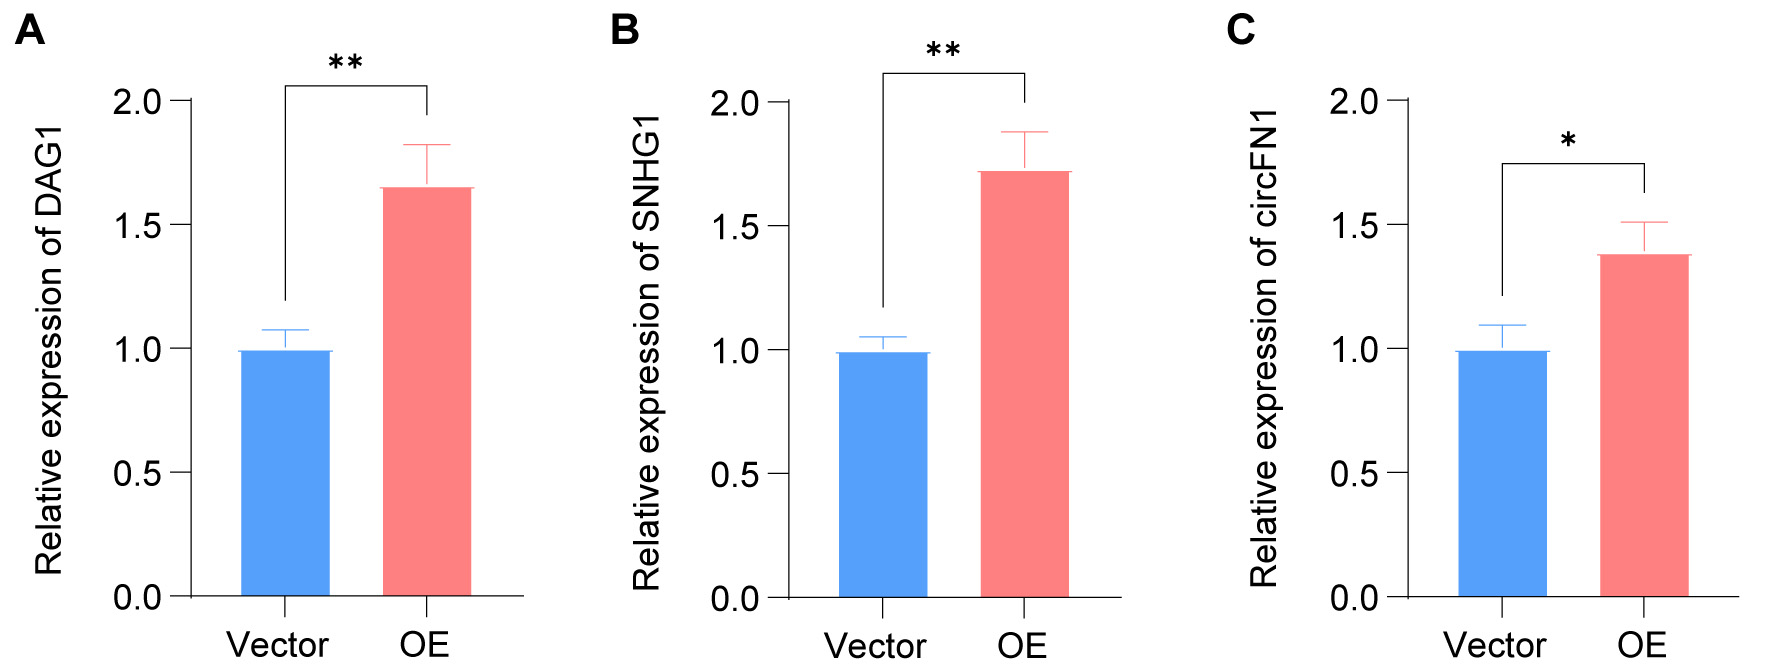
Figure 7. Validation of key regulatory nodes following ITGB5 overexpression by RT-qPCR. The relative expression levels of three selected candidate molecules were assessed: (A) DAG1 mRNA, (B) SNHG1 lncRNA, and (C) circFN1. Data are presented as mean ± SD (n = 3). Statistical significance was determined using an unpaired two-tailed Student’s t-test. *P < 0.05, **P < 0.01. RT-qPCR: Real-time quantitative polymerase chain reaction; mRNA: messenger RNA; lncRNA: long non-coding RNAs; OE: overexpression; SD: standard deviation.


