


fig6
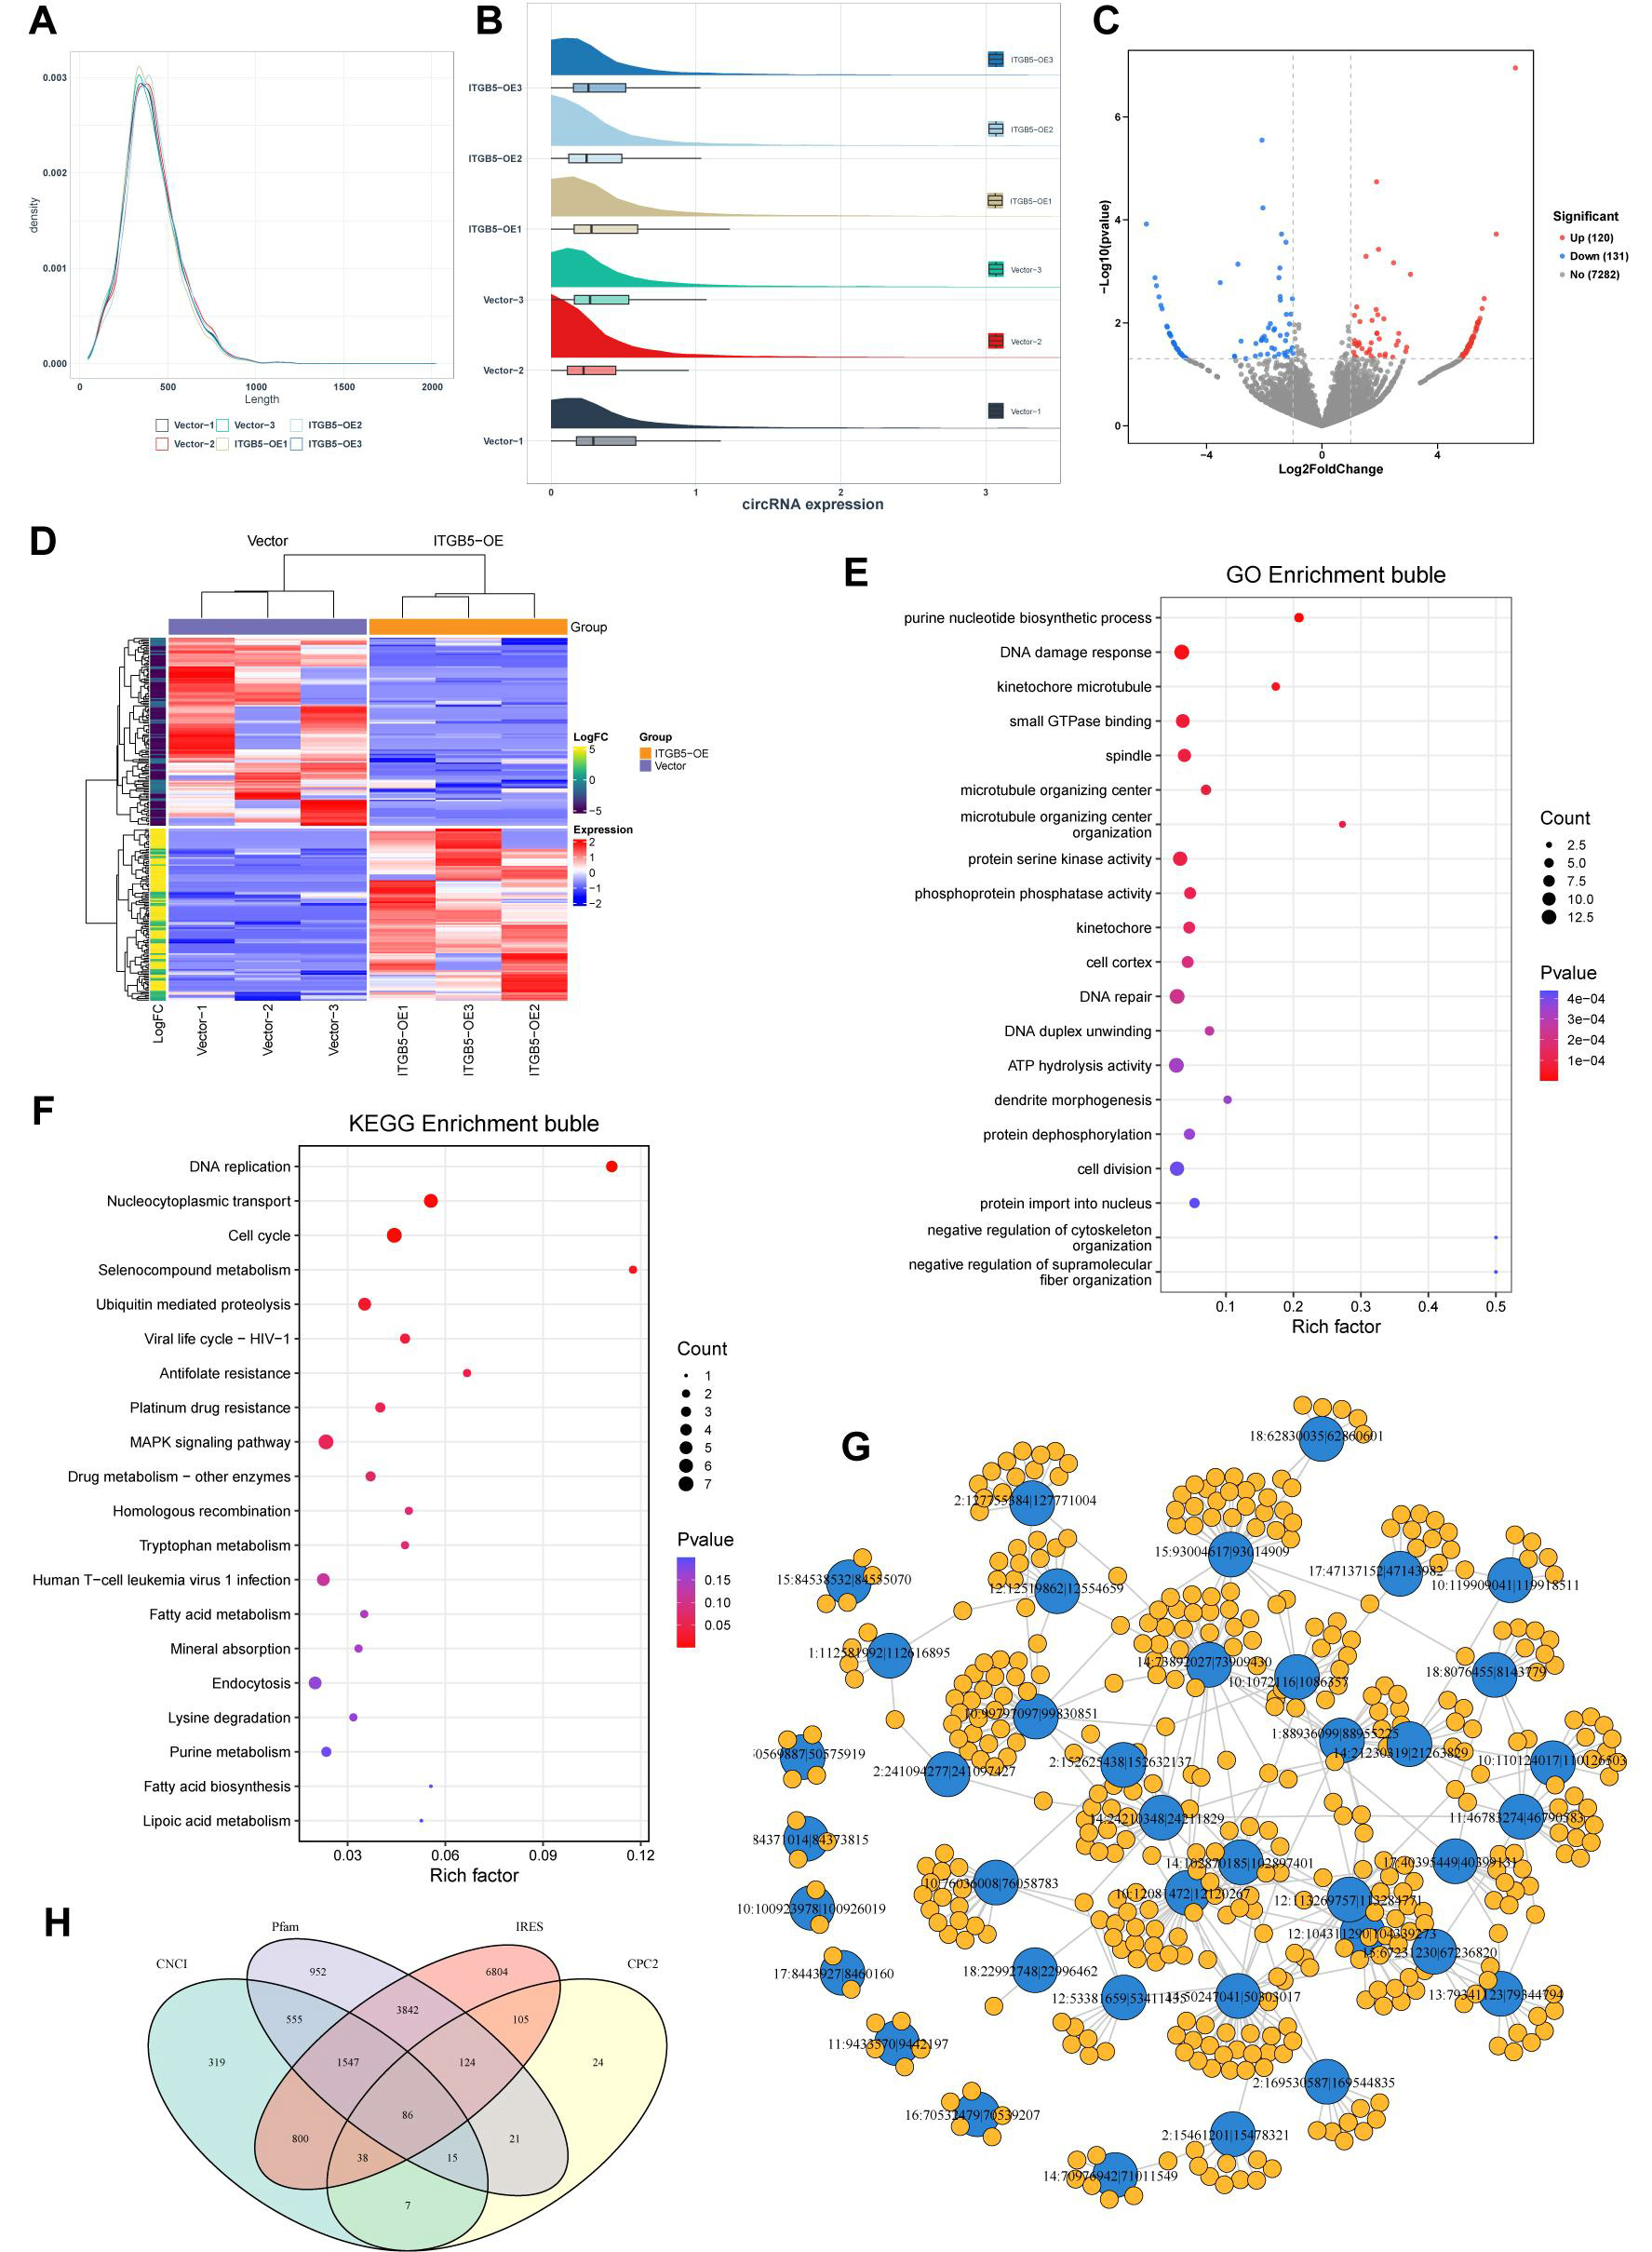
Figure 6. Characterization of circular RNAs (circRNAs) and functional enrichment analysis of their host genes. (A) Length distribution of identified circRNAs; (B) Box plot illustrating the distribution of circRNA expression across samples; (C) Volcano plot depicting differentially expressed circRNAs; (D) Heatmap showing differentially expressed circRNAs with unsupervised hierarchical clustering; (E) GO enrichment bubble plot for the host genes of dysregulated circRNAs; (F) KEGG enrichment bubble plot of the host genes for dysregulated circRNAs; (G) Predicted circRNA-miRNA interaction network; (H) Venn diagram illustrating circRNAs with predicted coding potential based on four algorithms: CNCI, Pfam, IRES, and CPC2. GO: Gene ontology; KEGG: kyoto encyclopedia of genes and genomes; CNCI: coding-non-coding index; IRES: internal ribosome entry site; CPC2: coding potential calculator; ATP: adenosine triphosphate; MAPK: mitogen-activated protein kinase.


