


fig4
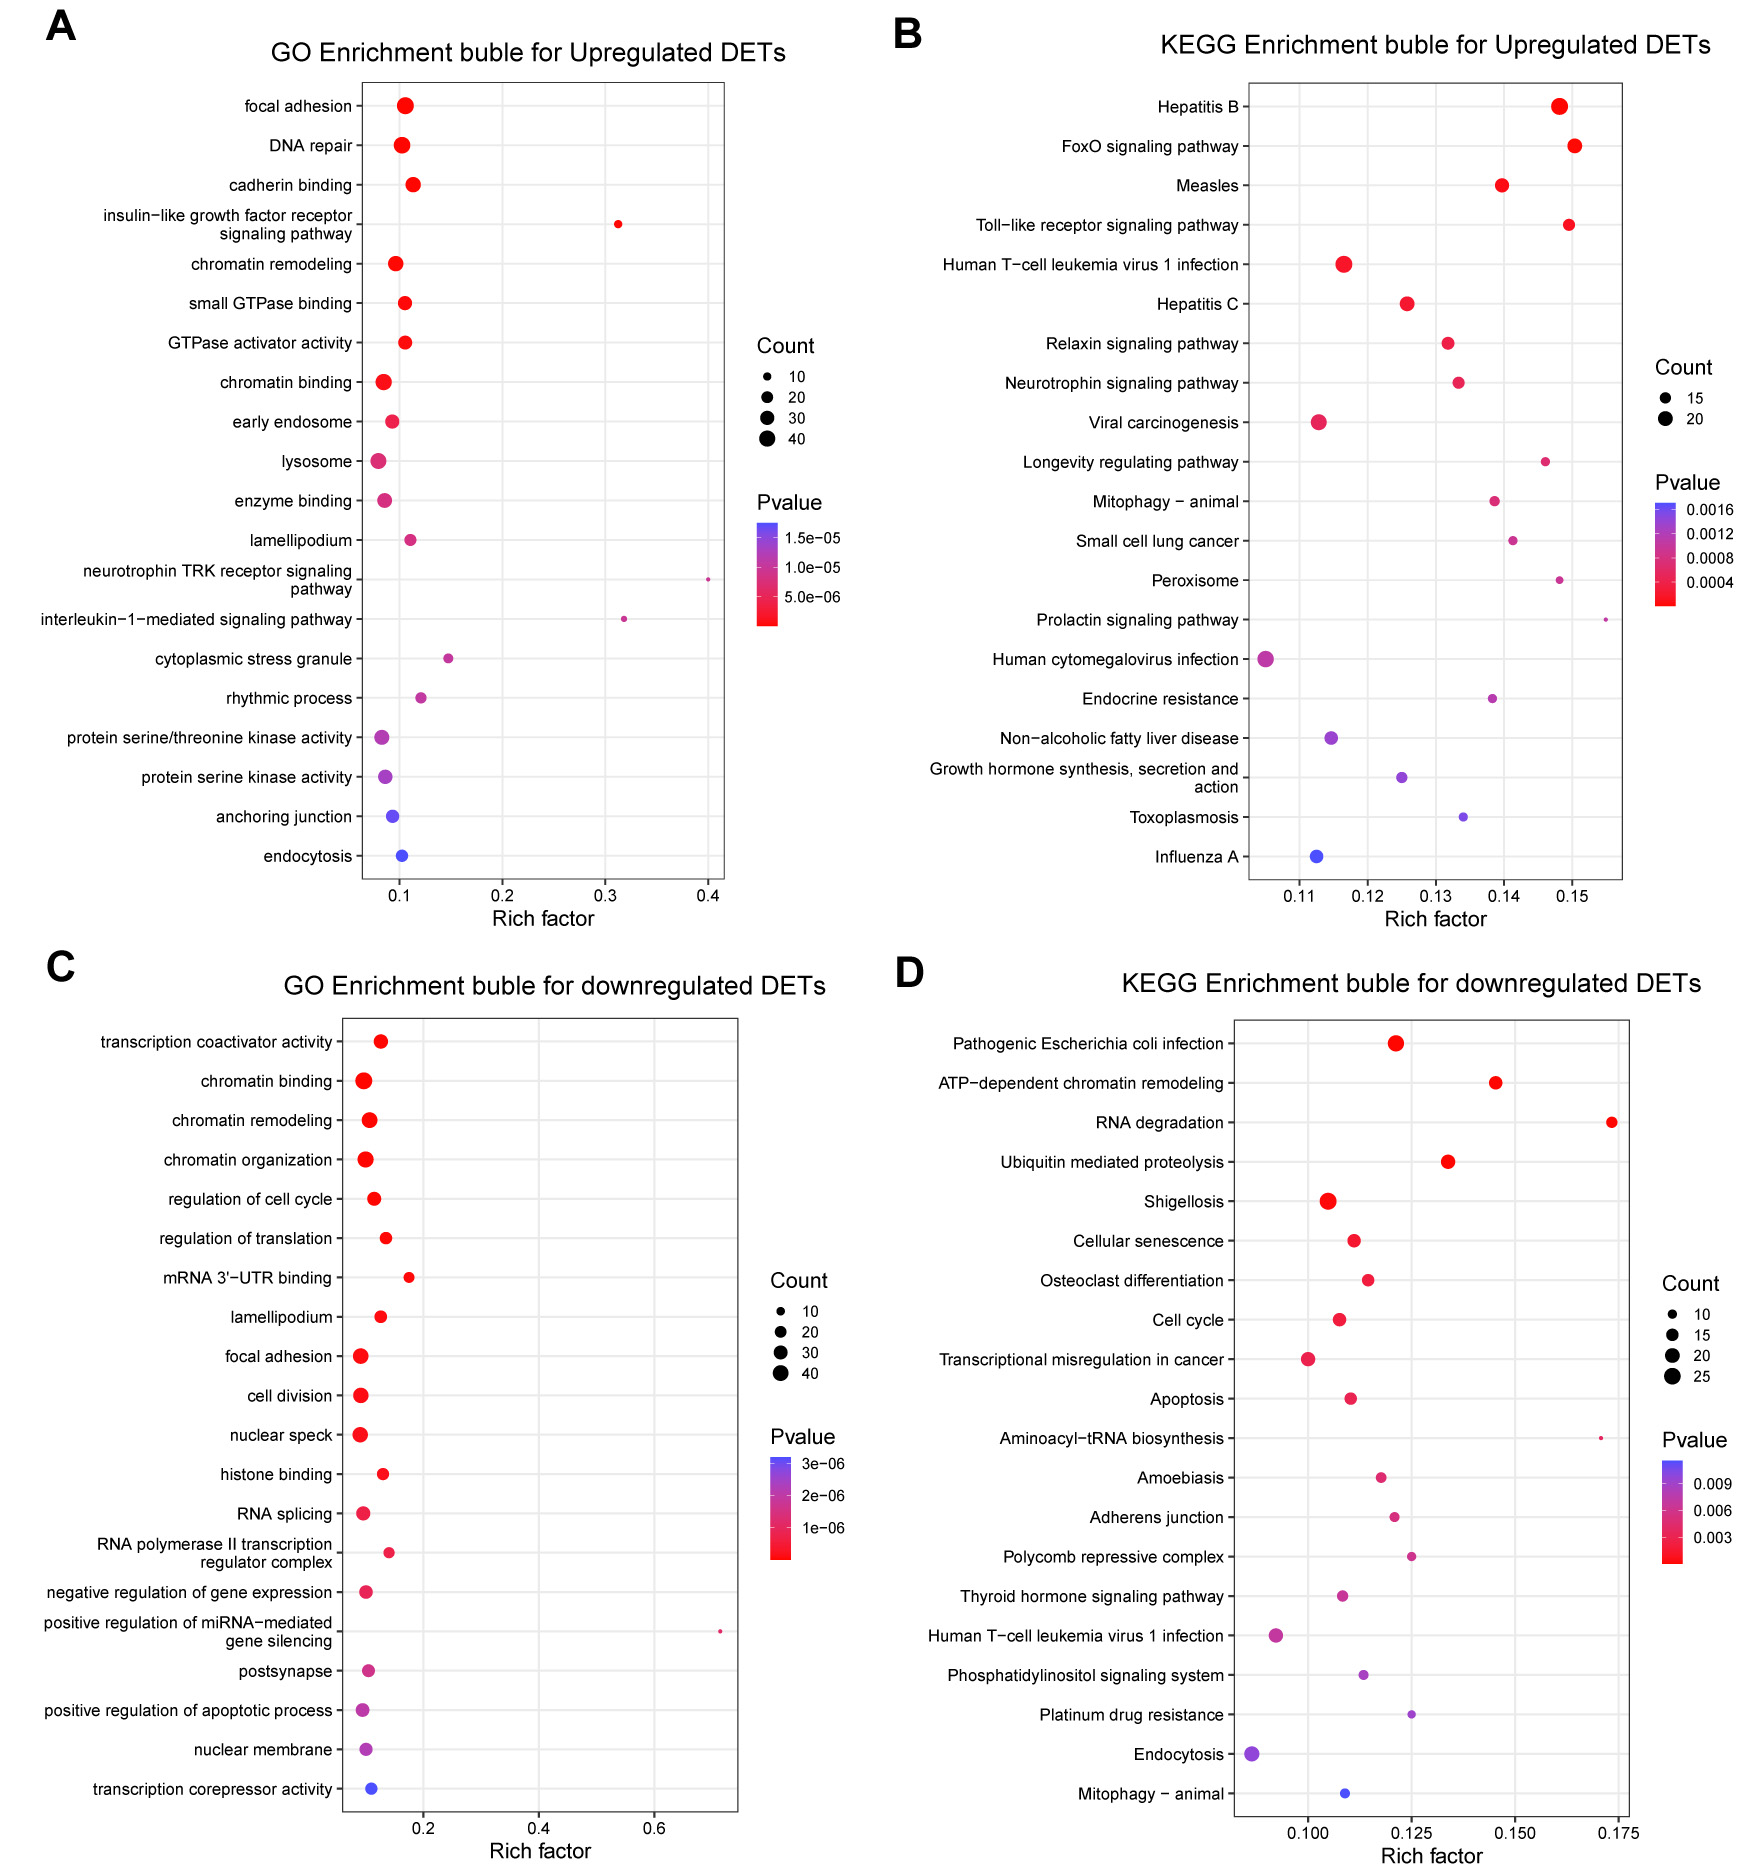
Figure 4. GO and KEGG enrichment profiles of upregulated and downregulated DETs following ITGB5 overexpression. (A) GO enrichment bubble plot illustrating upregulated DETs; (B) KEGG enrichment bubble plot illustrating upregulated DETs; (C) GO enrichment bubble plot illustrating downregulated DETs; (D) KEGG enrichment bubble plot illustrating downregulated DETs. DEGs: Differentially expressed genes; DETs: differentially expressed transcripts; GO: gene ontology; KEGG: kyoto encyclopedia of genes and genomes; TRK: tropomyosin receptor kinase; 3′UTR: 3′ untranslated region; ATP: adenosine triphosphate.


