


fig1
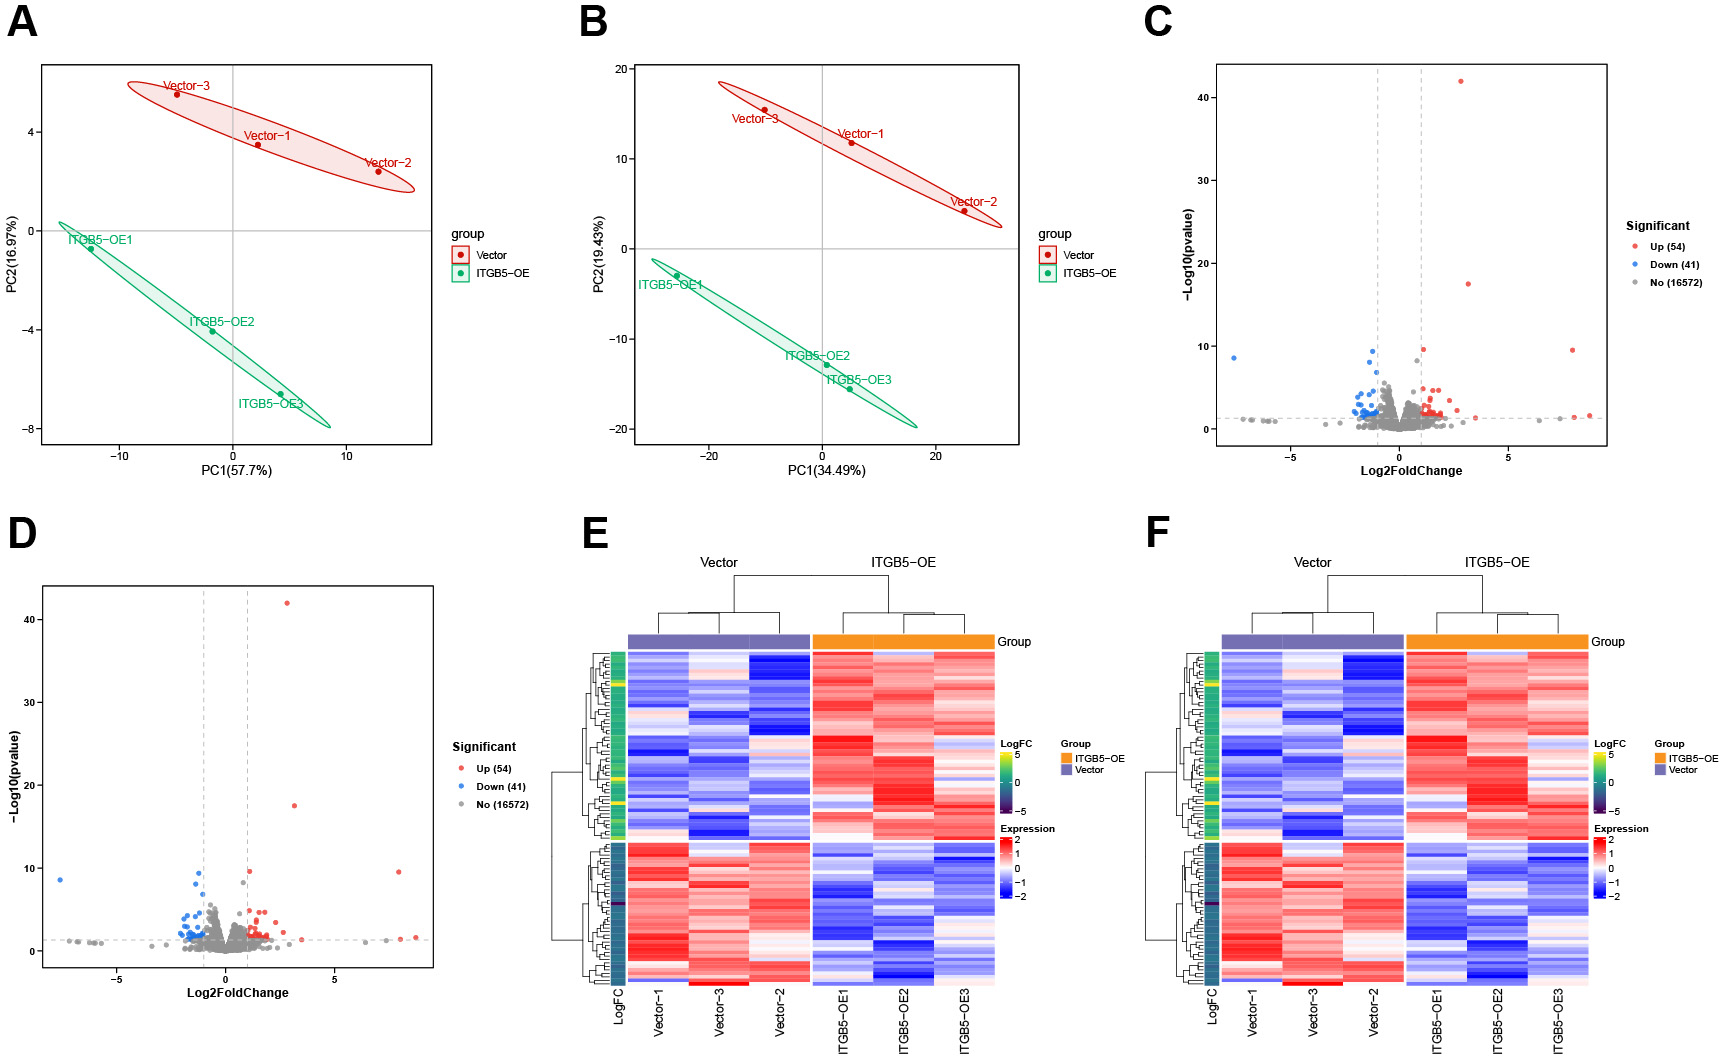
Figure 1. Transcriptomic landscapes and differential expression profiles following ITGB5 overexpression. (A) Principal component analysis (PCA) plot based on differentially expressed genes (DEGs); (B) PCA plot based on differentially expressed transcripts (DETs); (C) Volcano plot depicting DEGs; (D) Volcano plot depicting DETs; (E) Heatmap illustrating the expression of DEGs; (F) Heatmap illustrating the expression of DETs.


