

fig2
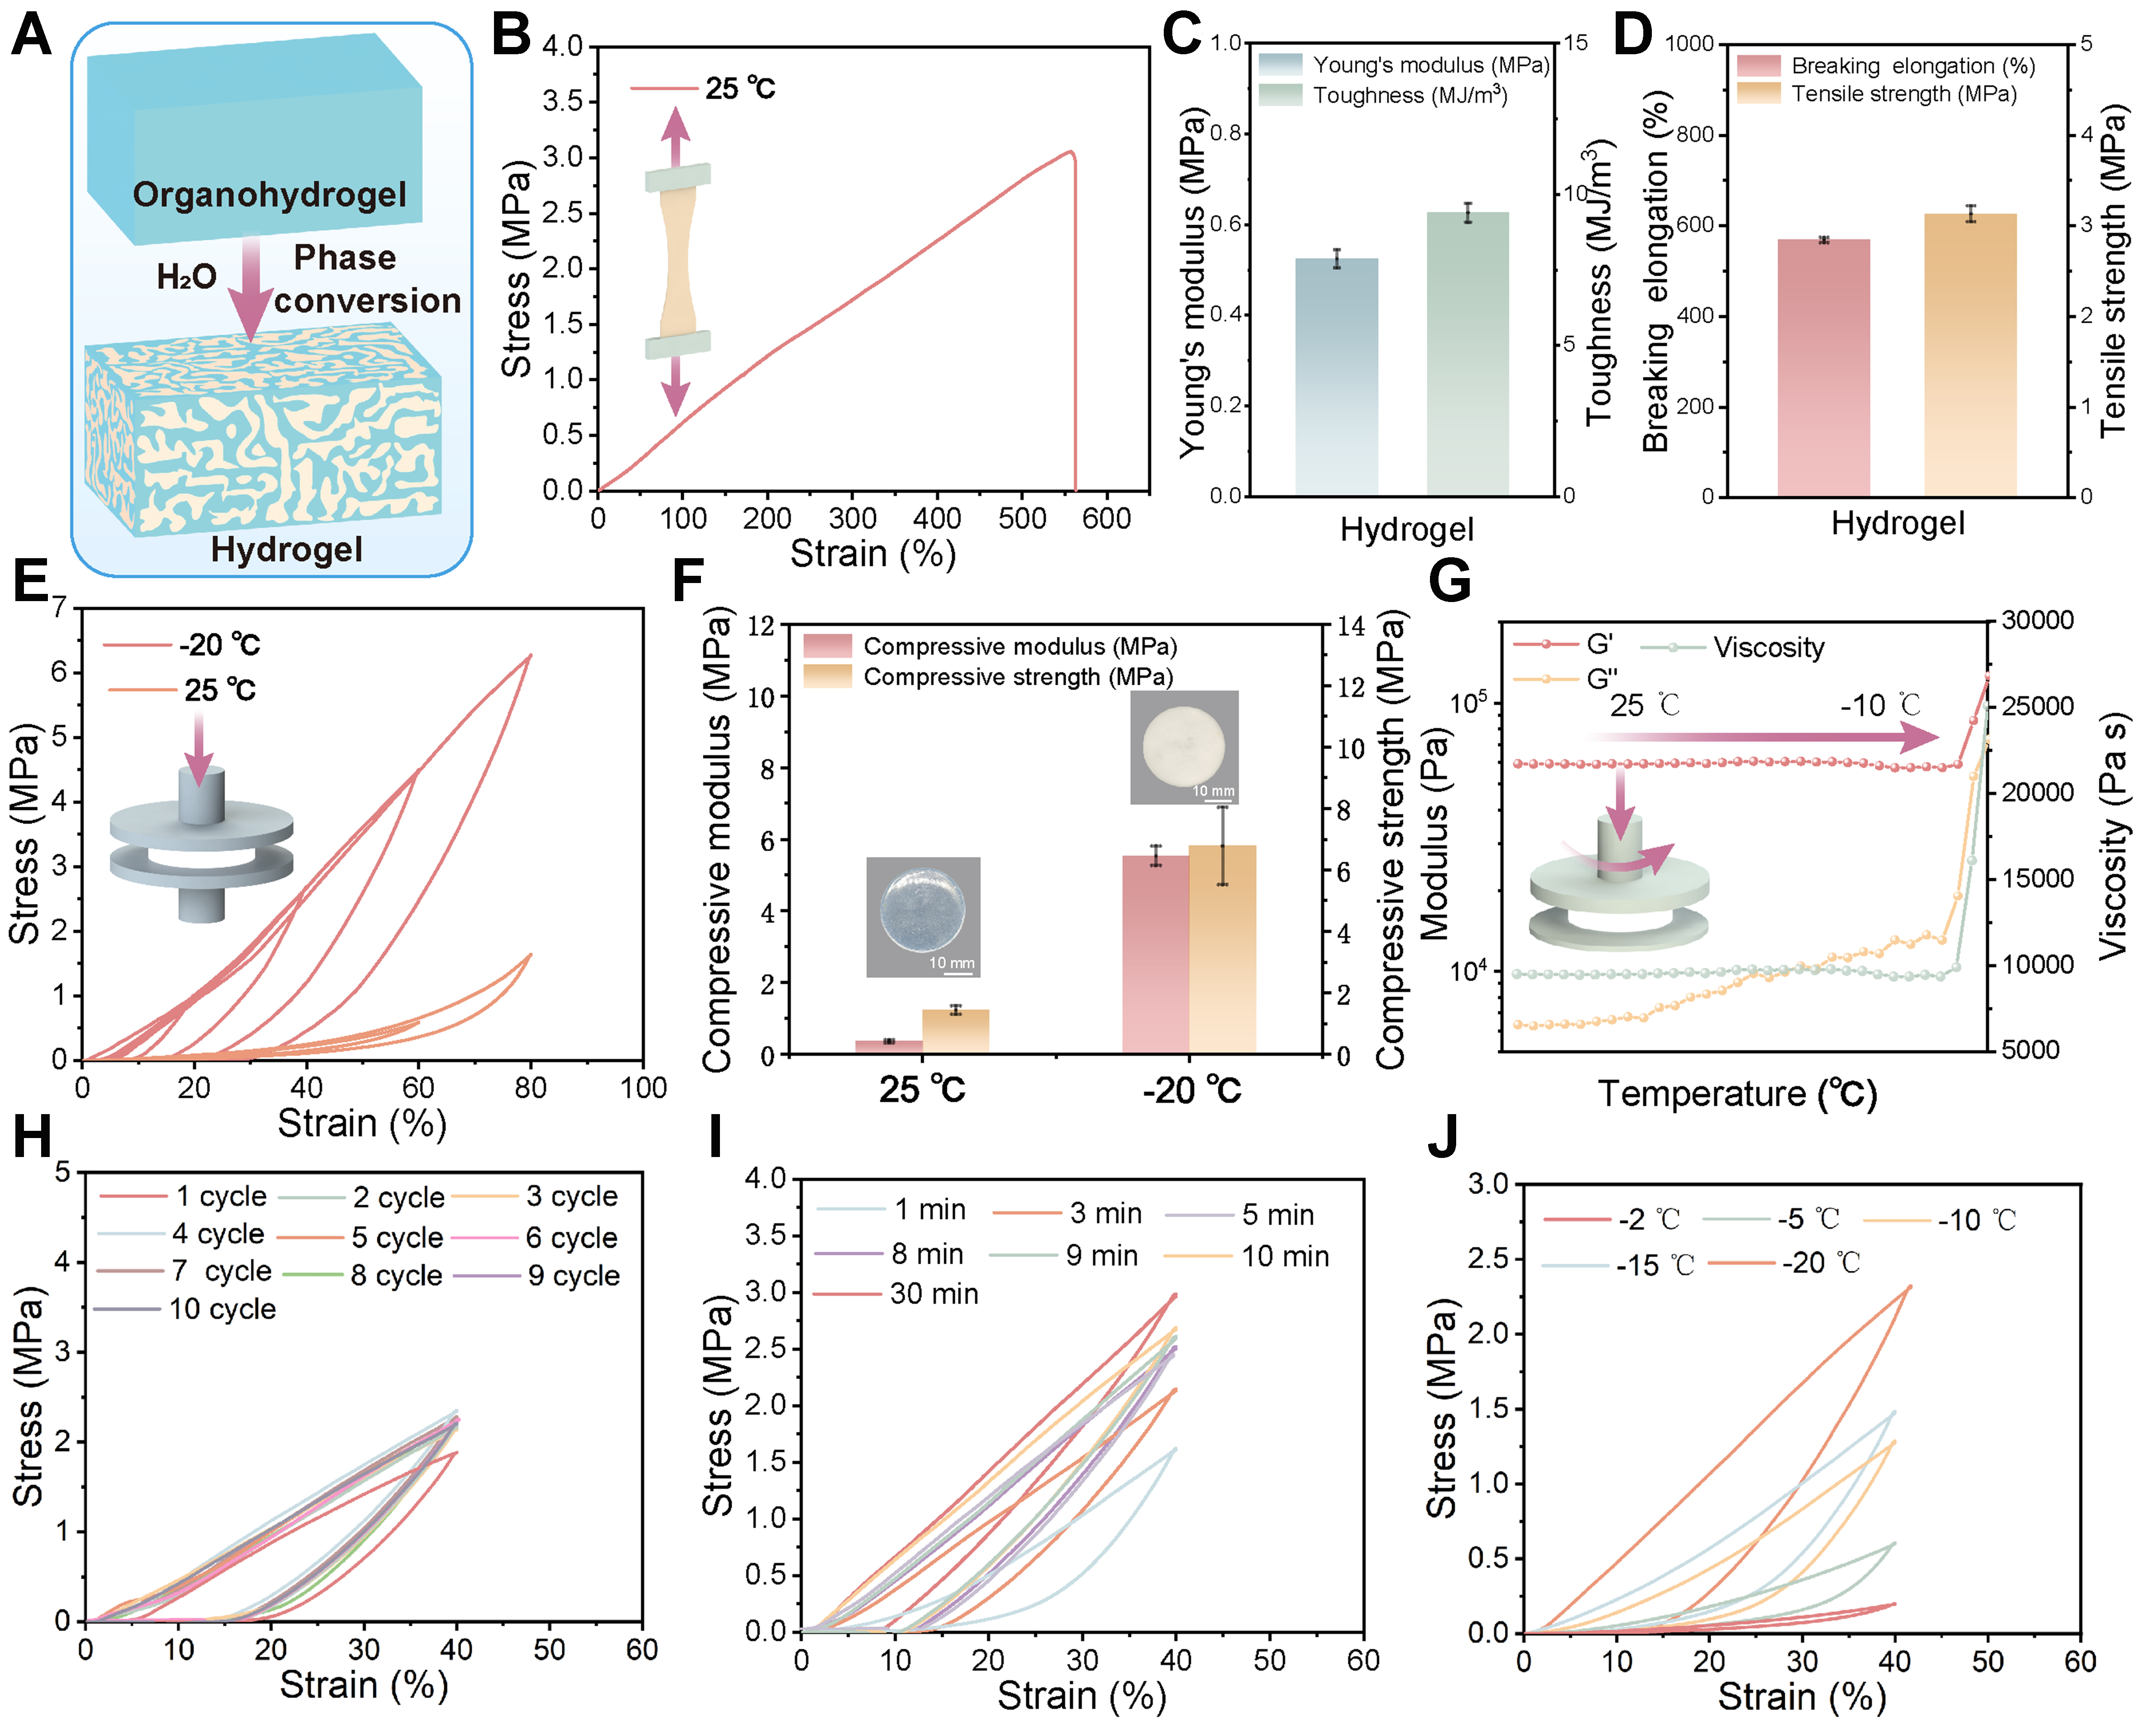
Figure 2. Mechanical properties and structural evolution of supramolecular hydrogels from ambient to low temperatures. (A) Schematic diagram of hydrogen bond reconstruction in hydrogels; (B) Representative tensile stress-strain curves; (C) Young’s modulus and toughness, as well as (D) breaking elongation and tensile strength of hydrogels at 25 °C; (E) Compression stress–strain curves of the hydrogel measured at 25 and -20 °C; (F) Compressive modulus and compressive strength of hydrogels at 25 and -20 °C; (G) Storage modulus G′, loss modulus G′′, and viscosity of the hydrogels from 25 to -10 °C; (H) Compressive loading–unloading curves of the hydrogel during repeated freeze–thaw cycles; (I) Compressive loading–unloading curves of the hydrogel at -20 °C after different freezing times; (J) Compressive loading–unloading curves of the hydrogel at different temperatures. Error bars represent ± SD (n = 3). SD: Standard deviation.





