

fig5
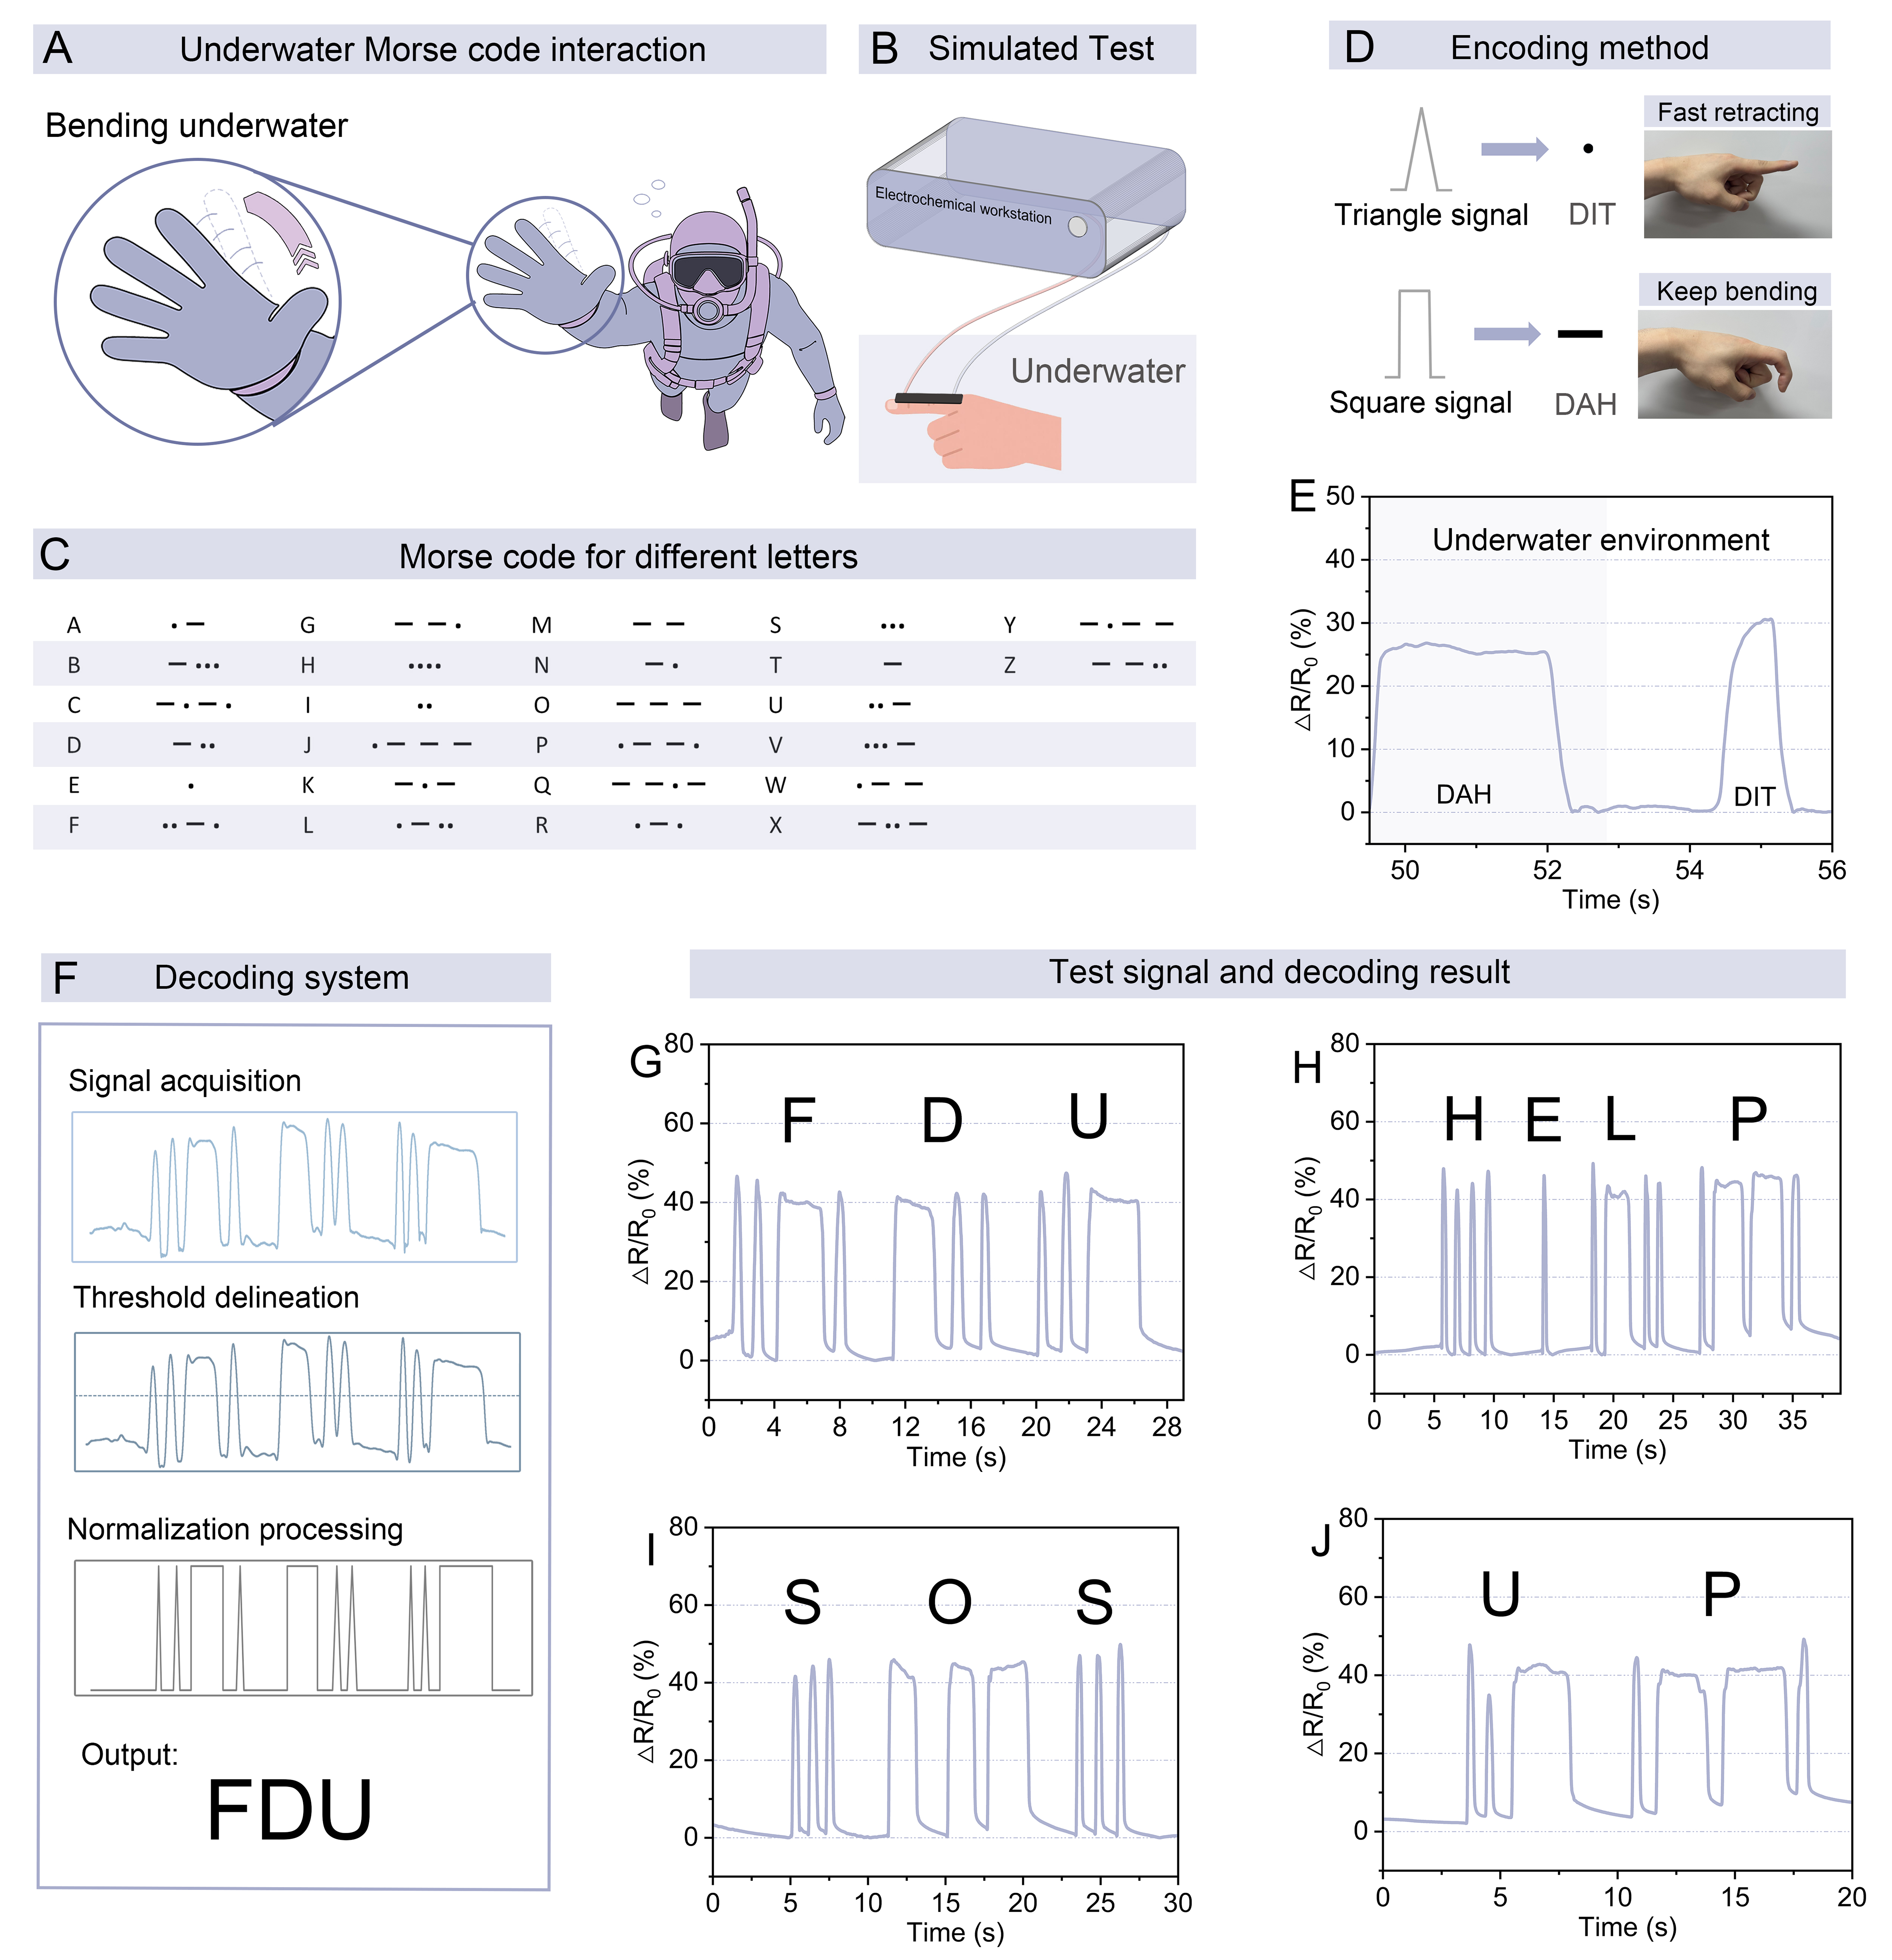
Figure 5. (A) Schematic diagram of underwater Morse code interaction; (B) Schematic diagram of the simulation test setup; (C) Morse code encoding chart; (D) Schematic diagram of the encoding method; (E) Resistance change rate of PPPM-E underwater; (F) Schematic diagram of the decoding system structure; (G-J) Underwater testing and decoding output results: (G) FDU, (H) HELP, (I) SOS, (J) UP. PPPM-E: Enhanced-PVA/PAAm/PEDOT:PSS/MgCl2.





