

fig3
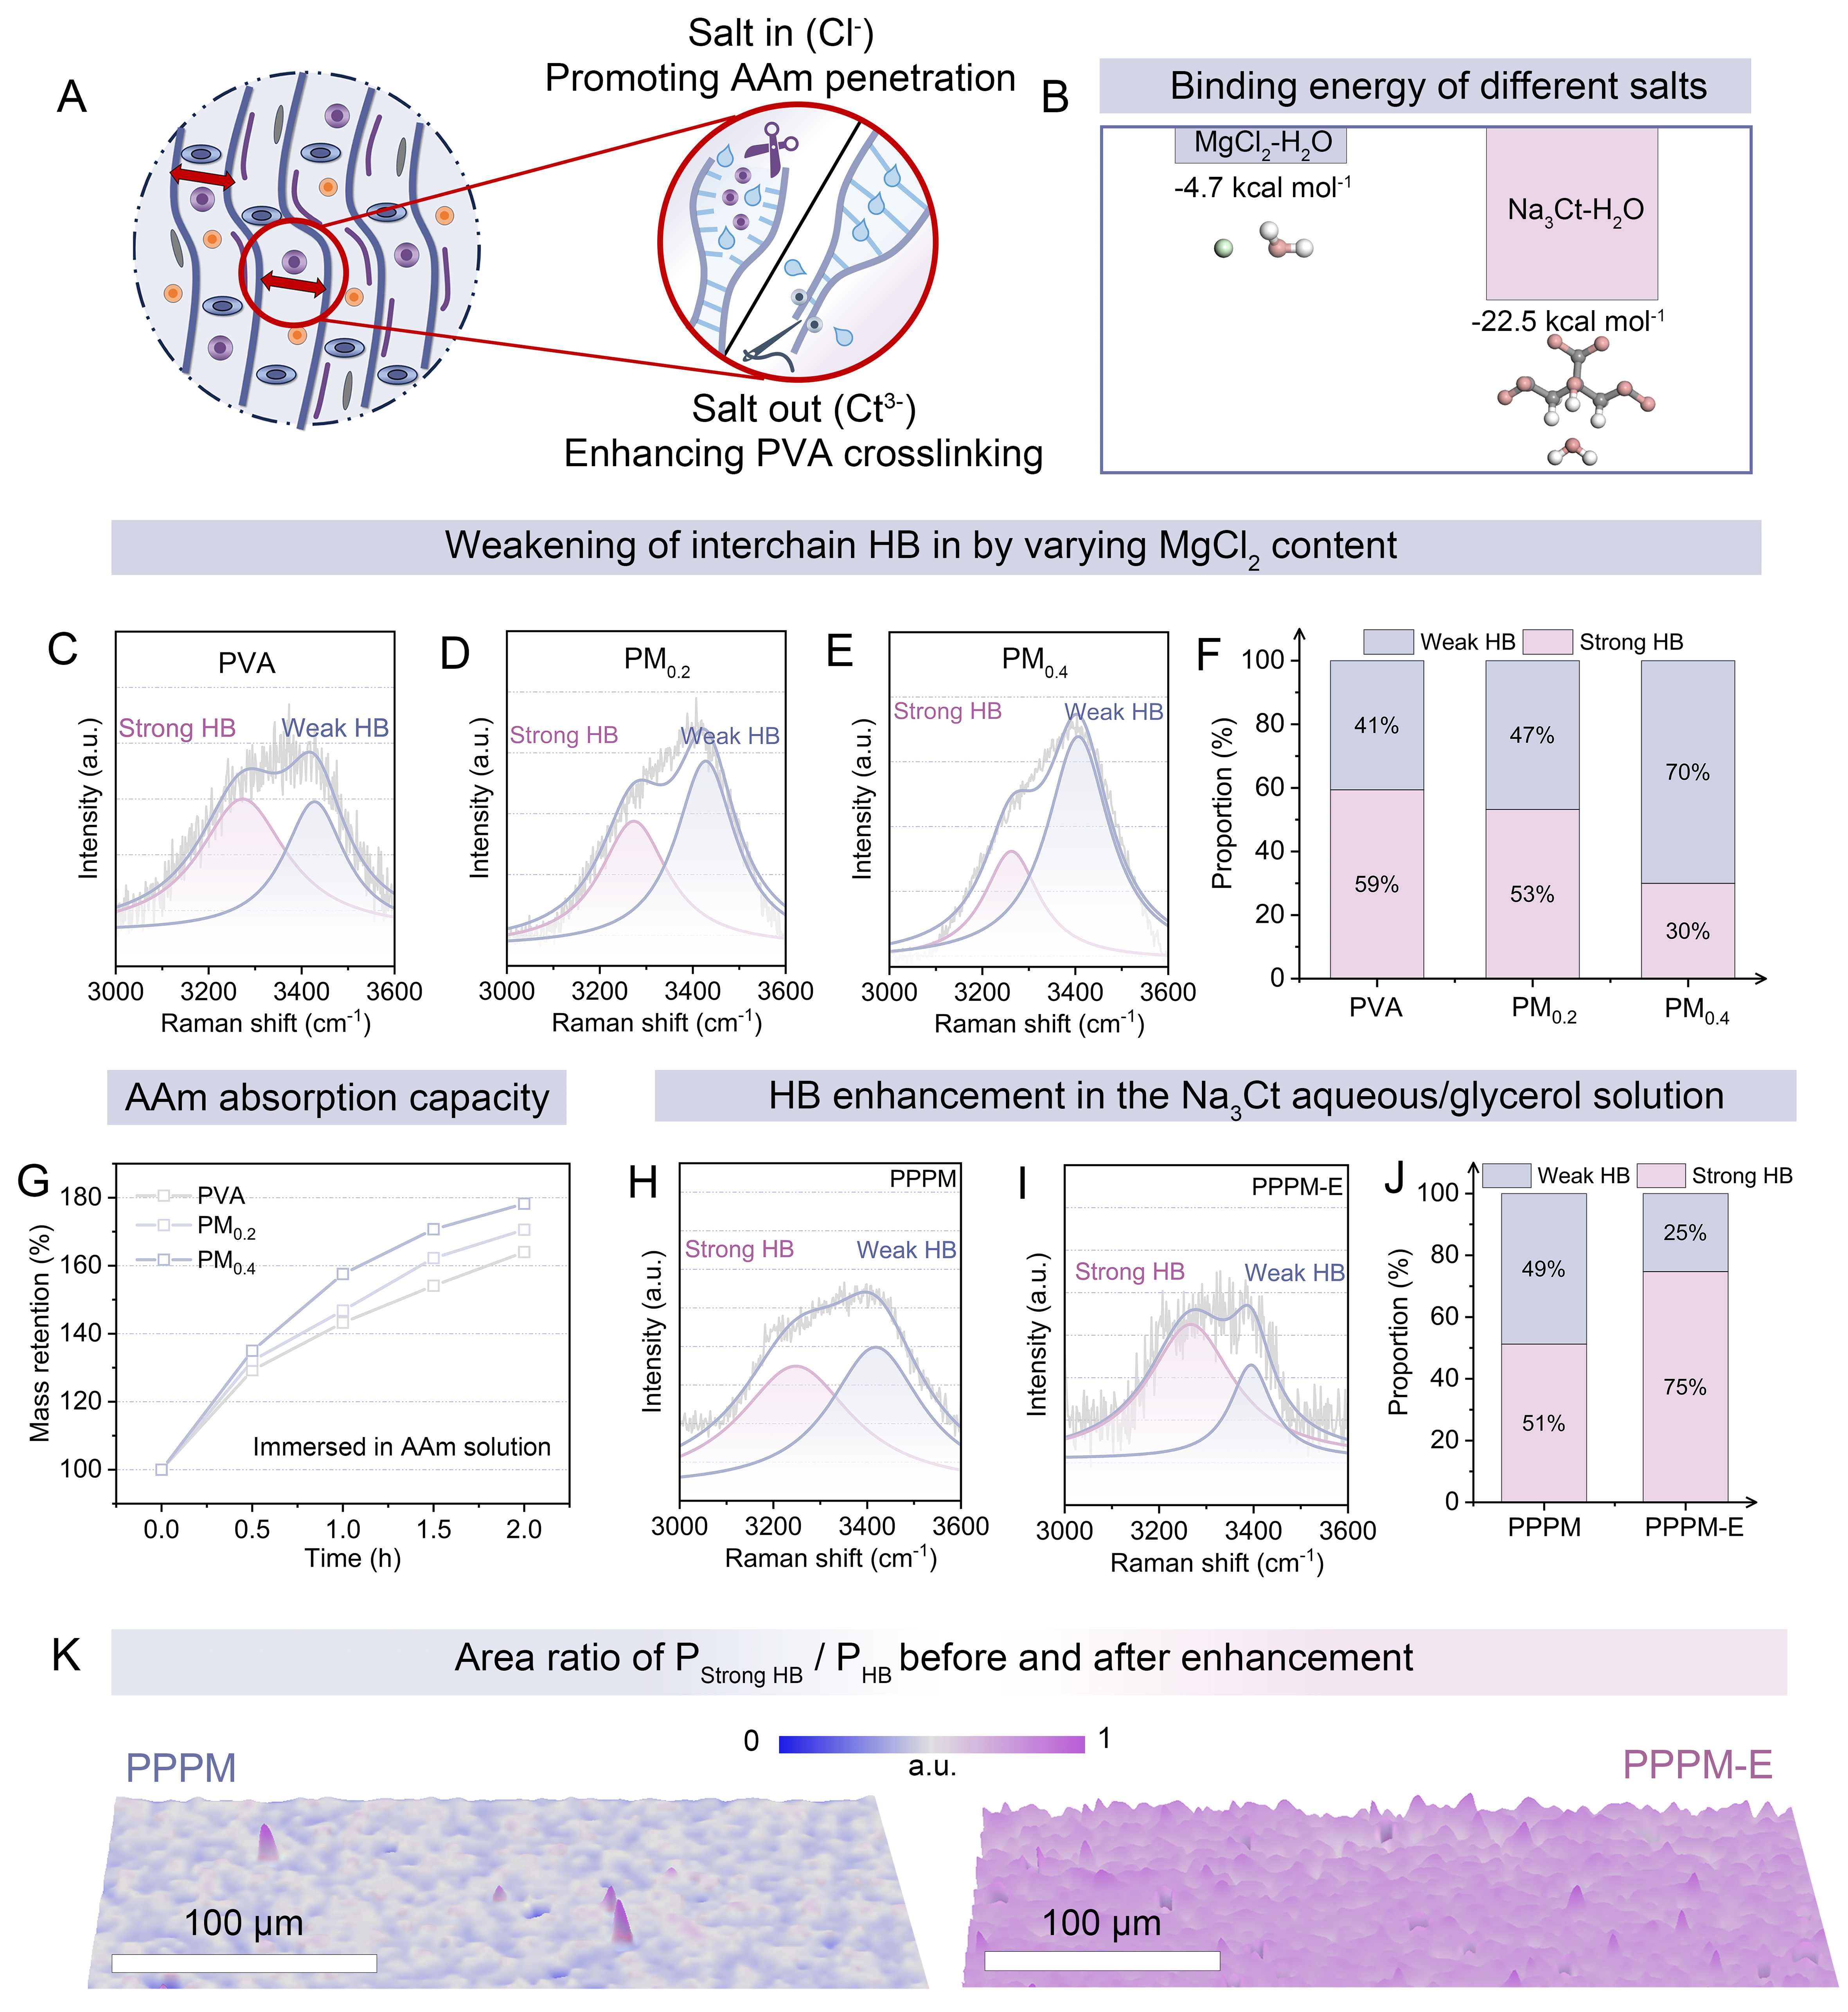
Figure 3. (A) Schematic diagram of the stepwise hydrogen bond modulation mechanism; (B) Binding energies of MgCl2 and Na3Ct with water; (C-E) Raman spectra of hydrogels with different MgCl2 contents: (C) PVA, (D) PM0.2, and (E) PM0.4; (F) Change in the proportion of hydrogen bonds in the Raman spectra of hydrogels with varying MgCl2 content; (G) Mass-time curves of hydrogels with different MgCl2 contents after immersion in the AAm solution; (H and I) Raman spectra of (H) PPPM and (I) PPPM-E before and after strengthening; (J) Change in the proportion of hydrogen bonds in the Raman spectra before and after strengthening; (K) Surface Raman mapping images of PPPM and PPPM-E. PVA: Polyvinyl alcohol; AAm: acrylamide; PPPM: PVA/PAAm/PEDOT:PSS/MgCl2; PPPM-E: enhanced-PVA/PAAm/PEDOT:PSS/MgCl2; HB: hydrogen bond.





