

fig4
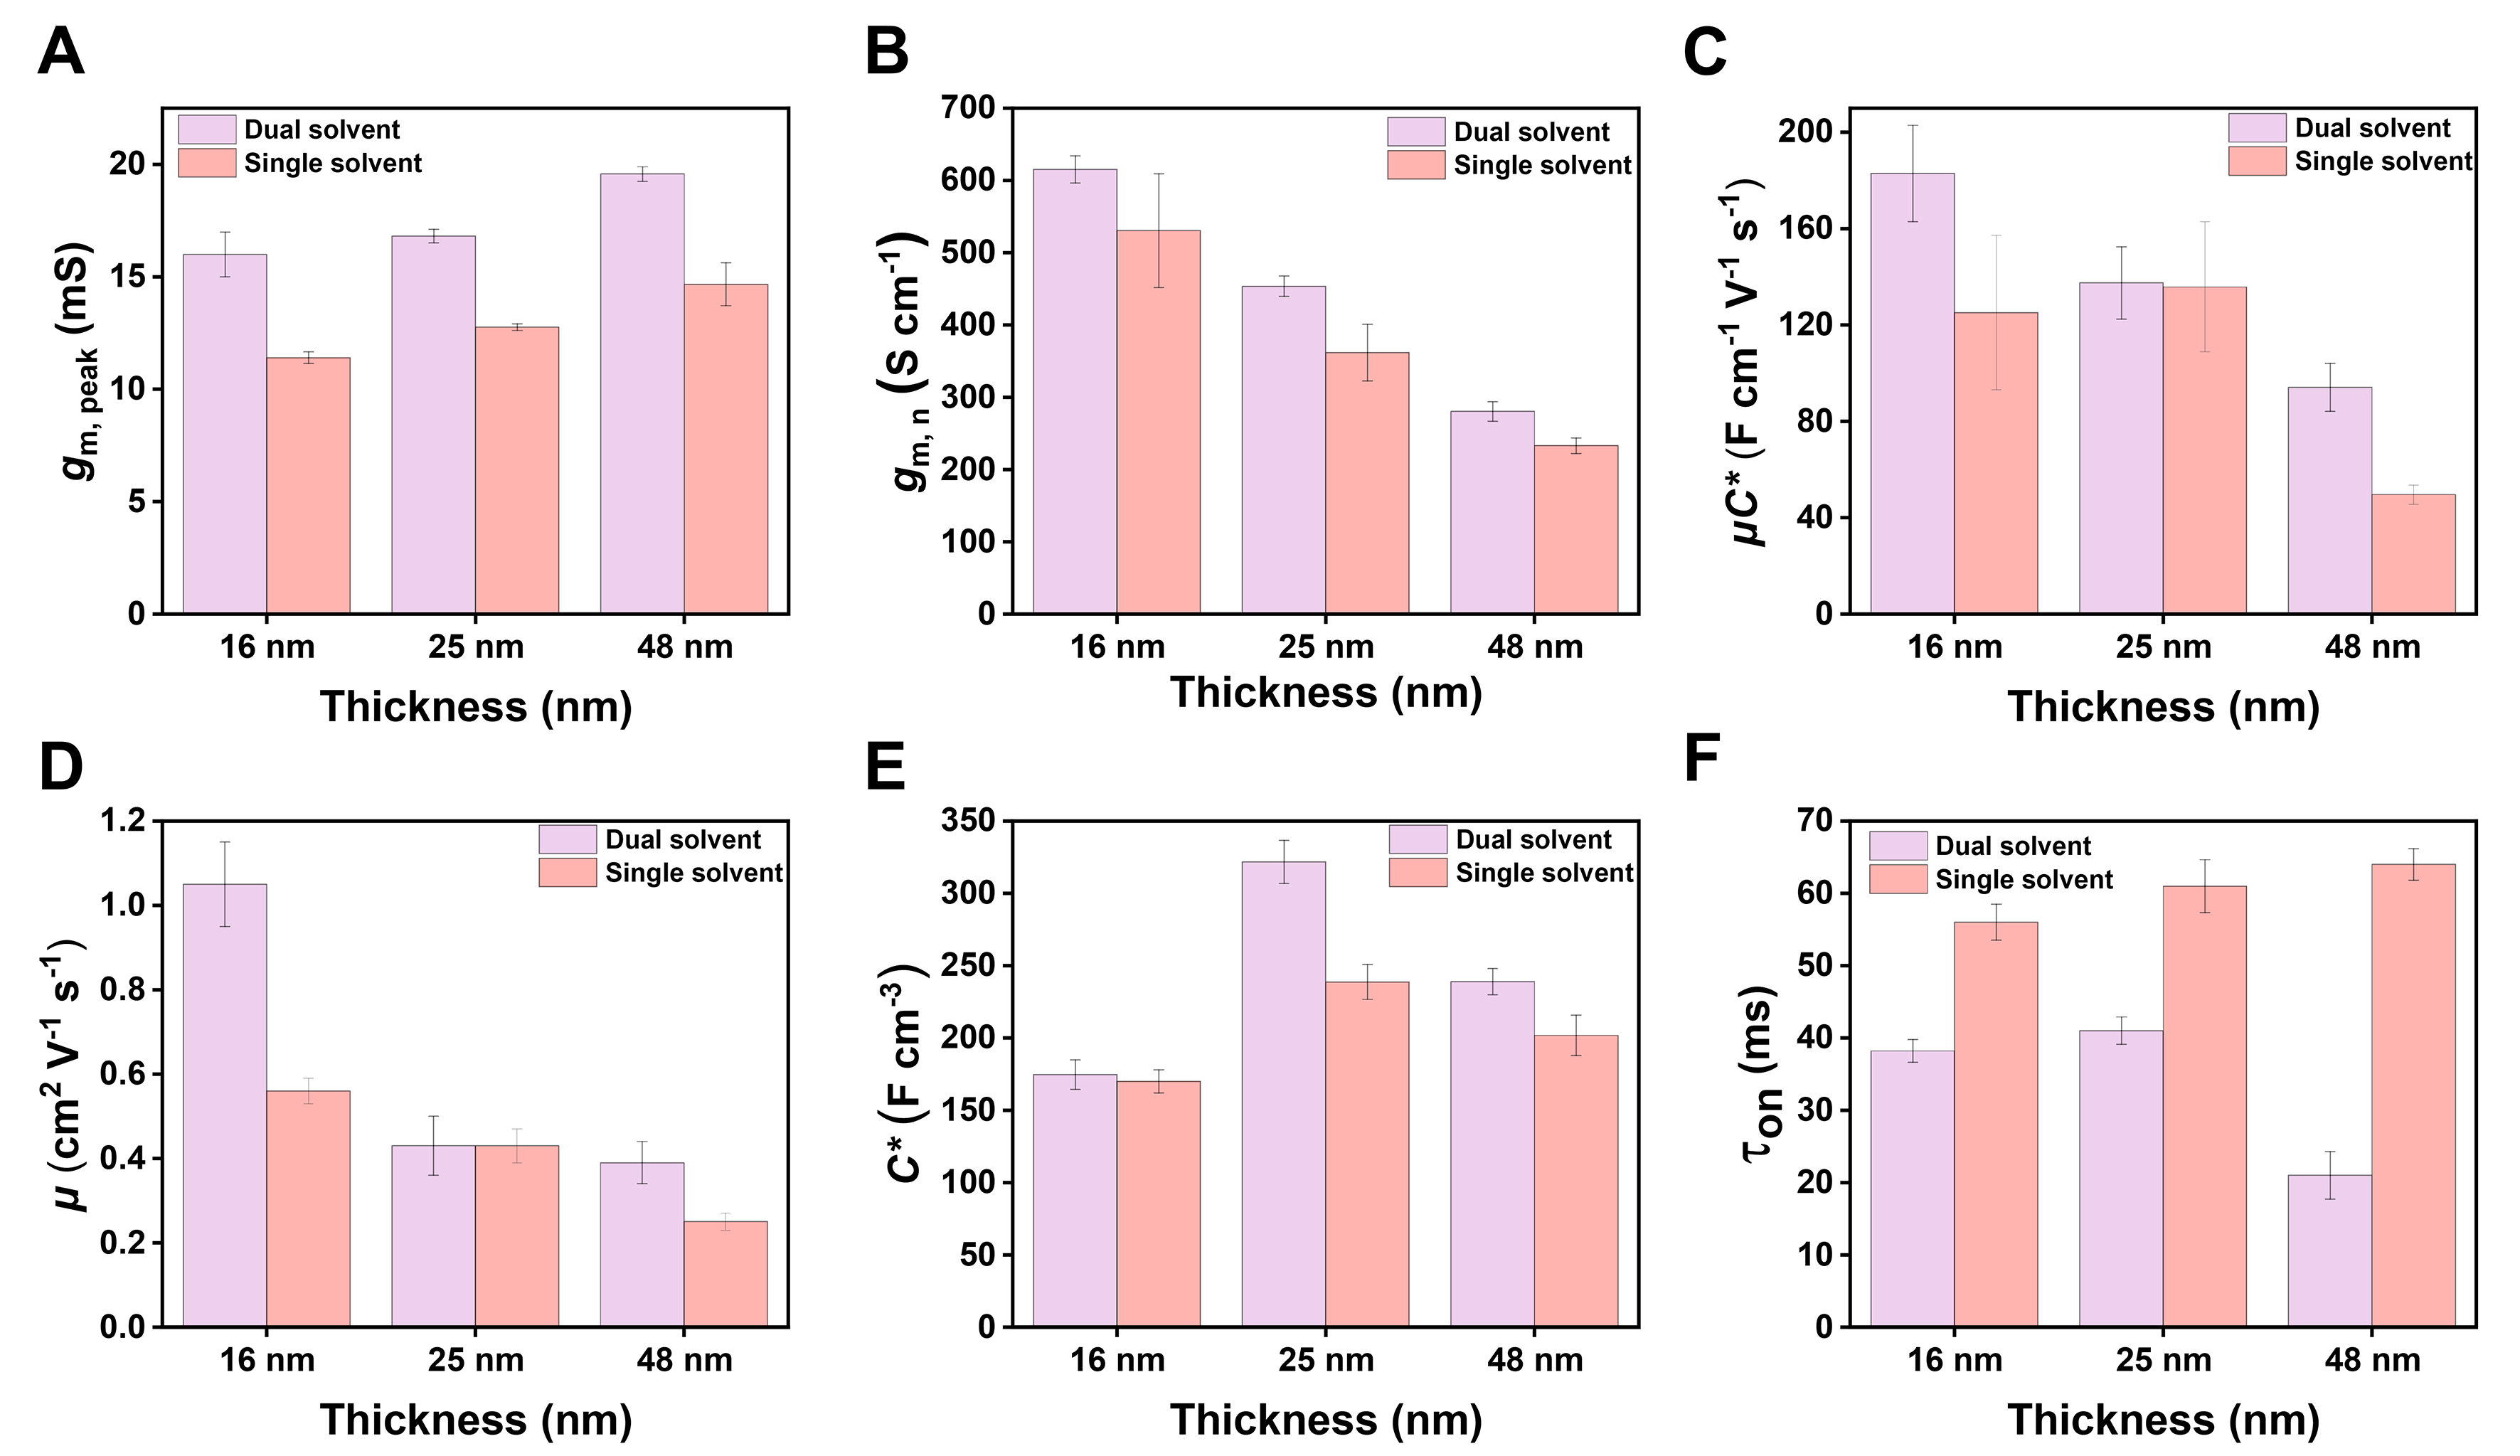
Figure 4. Comparison of the performance levels of single/dual-solvent devices at the same thicknesses of 16, 25, and 48 nm: (A) Peak transconductance; (B) Normalized transconductance; (C) Quality factor µC*; (D) Carrier mobility; (E) Volumetric capacitance; (F) Turn-on time. The error bars indicate the standard deviation (n ≥ 10 independent devices).





