

fig3
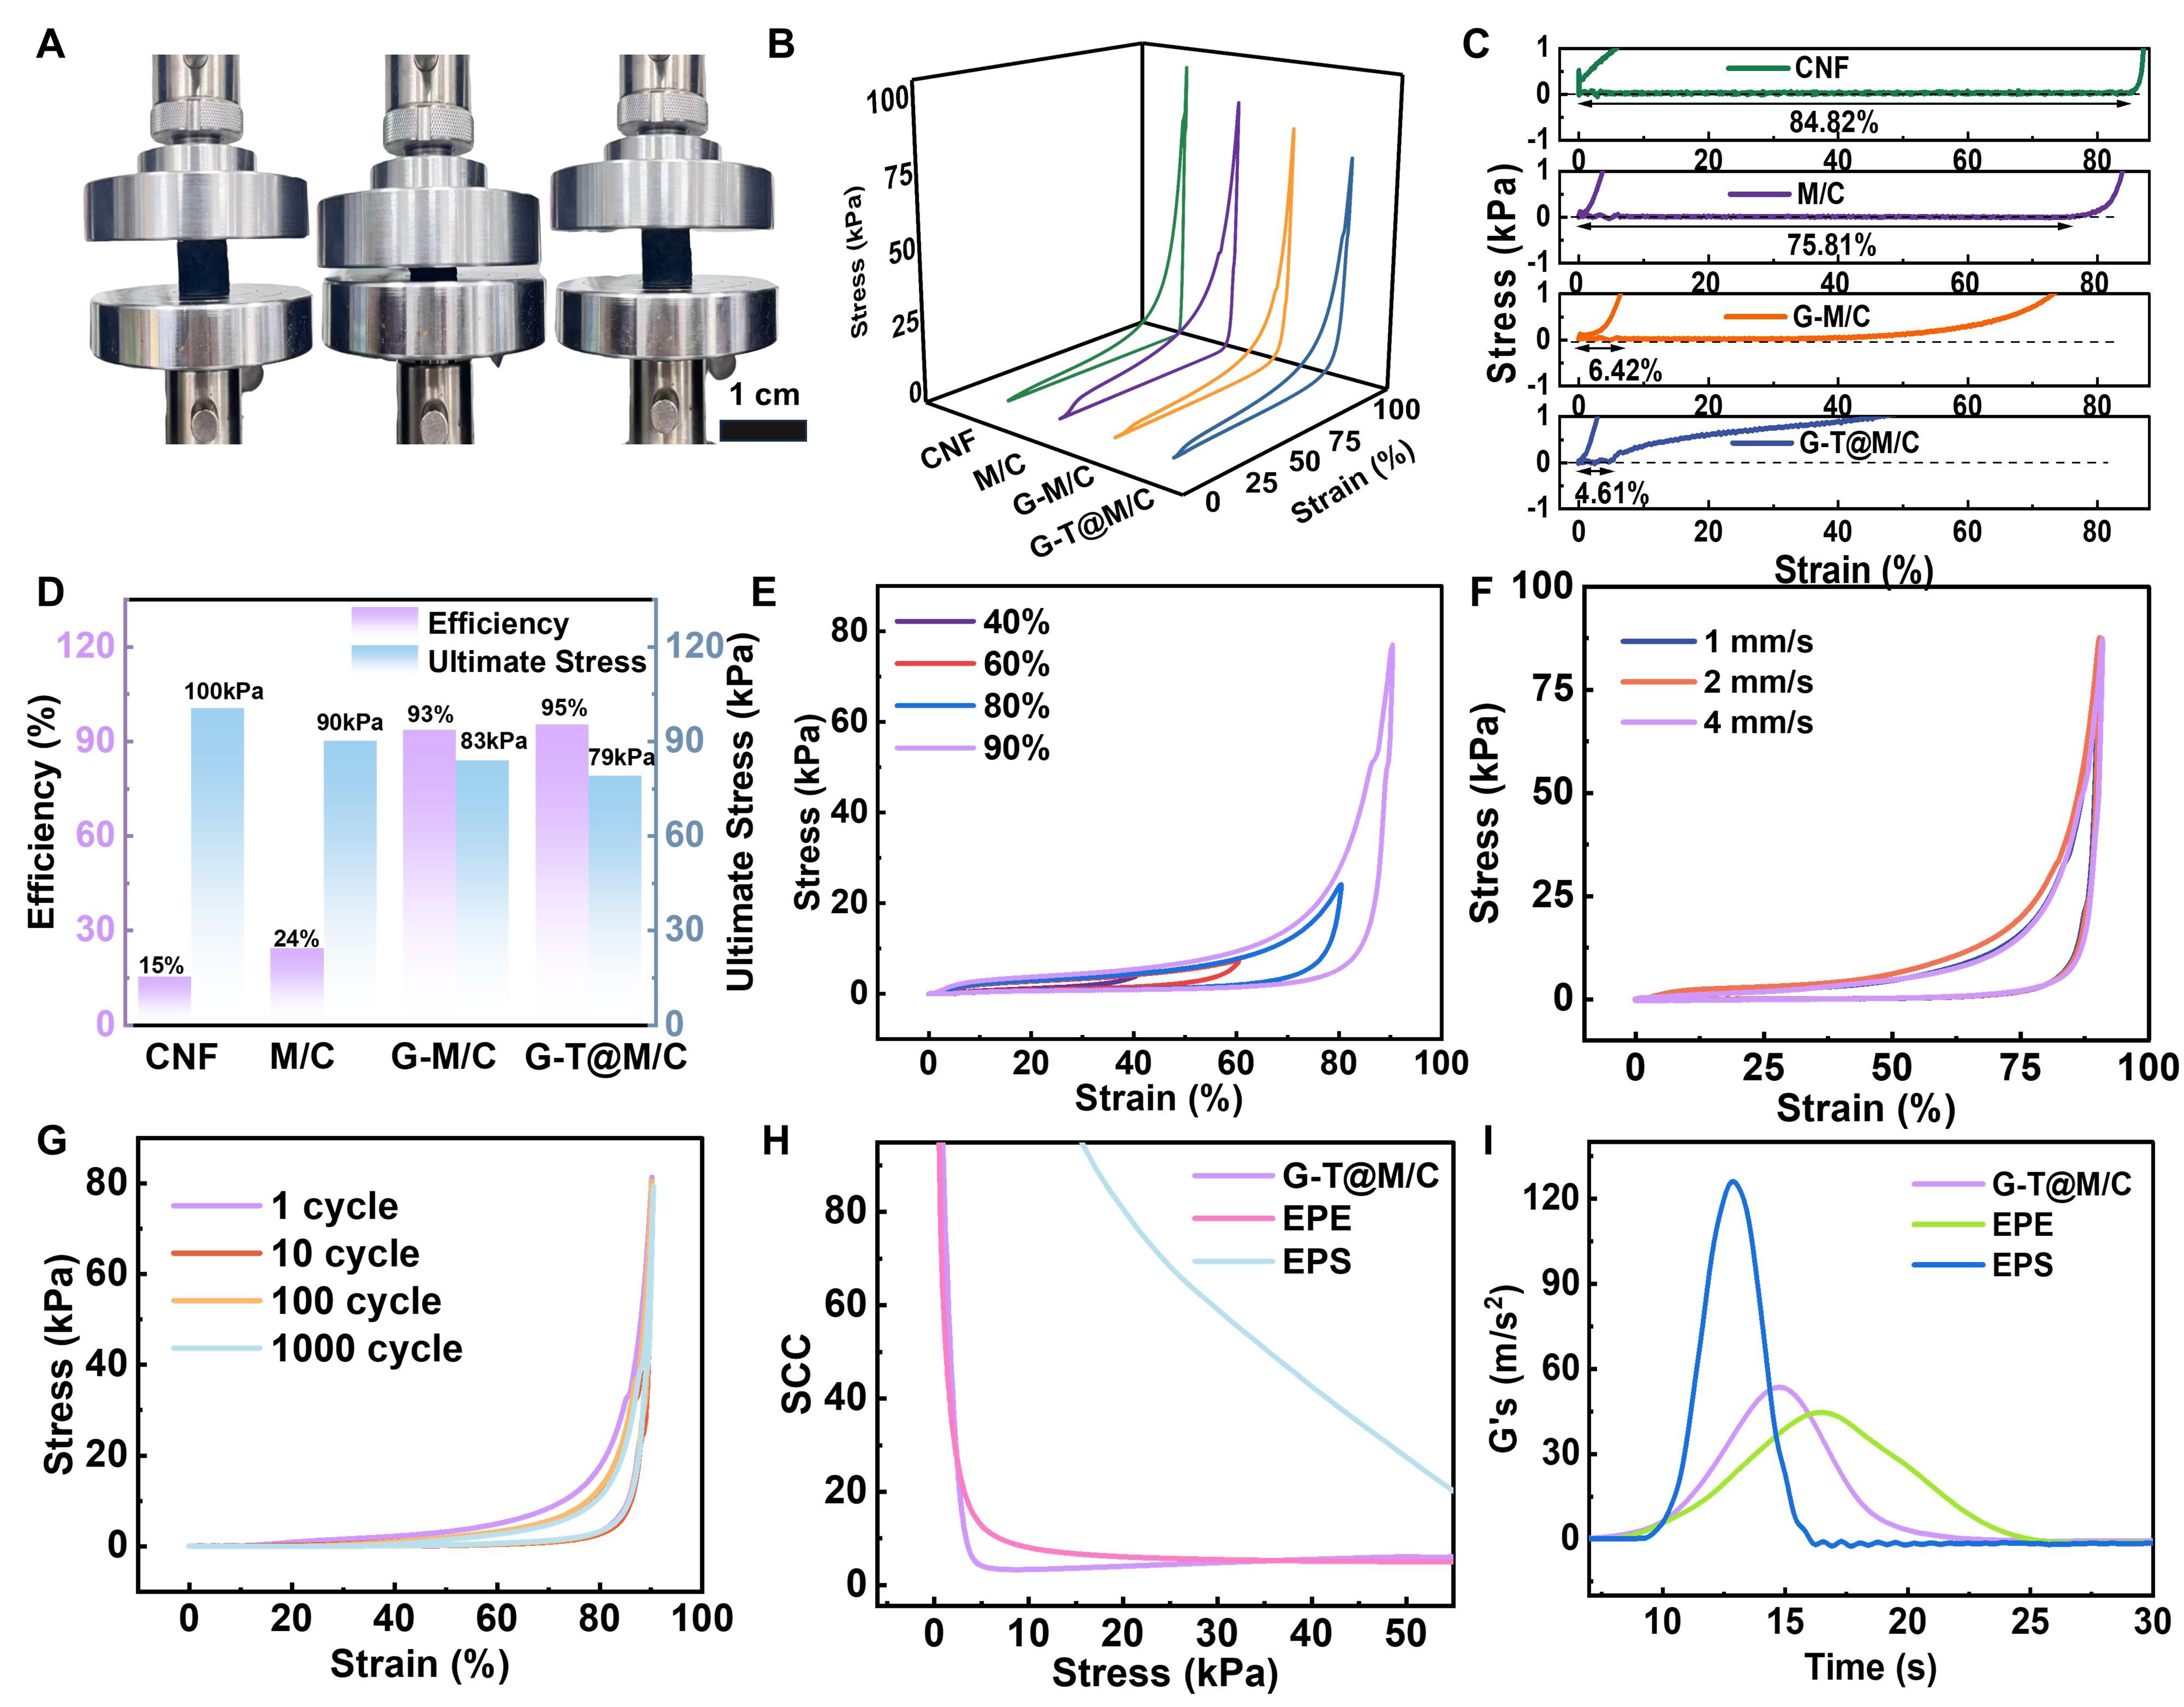
Figure 3. (A) Optical images of G-T@M/C in the initial state, at 90% compressive strain, and after full strain release; (B) Compressive stress–strain curves of CNF, M/C, G-M/C, and G-T@M/C; (C) Partial enlargement of (D); (D) Ultimate stress and height retention of CNF, M/C, G-M/C, and G-T@M/C at 90 % strain; (E) The stress–strain curves of G-T@M/C at different compressive strains; (F) Stress–strain curves of G-T@M/C compressed to 90% at different speeds; (G) Stress–strain profiles of G-T@M/C during the 1st, 10th, 100th, and 1,000th compression-release cycles at 90% strain; (H and I) The SCC and drop acceleration of EPE, EPS, and G-T@M/C foams. CNF: Cellulose nanofiber; SCC: static cushioning coefficient.





