

fig1
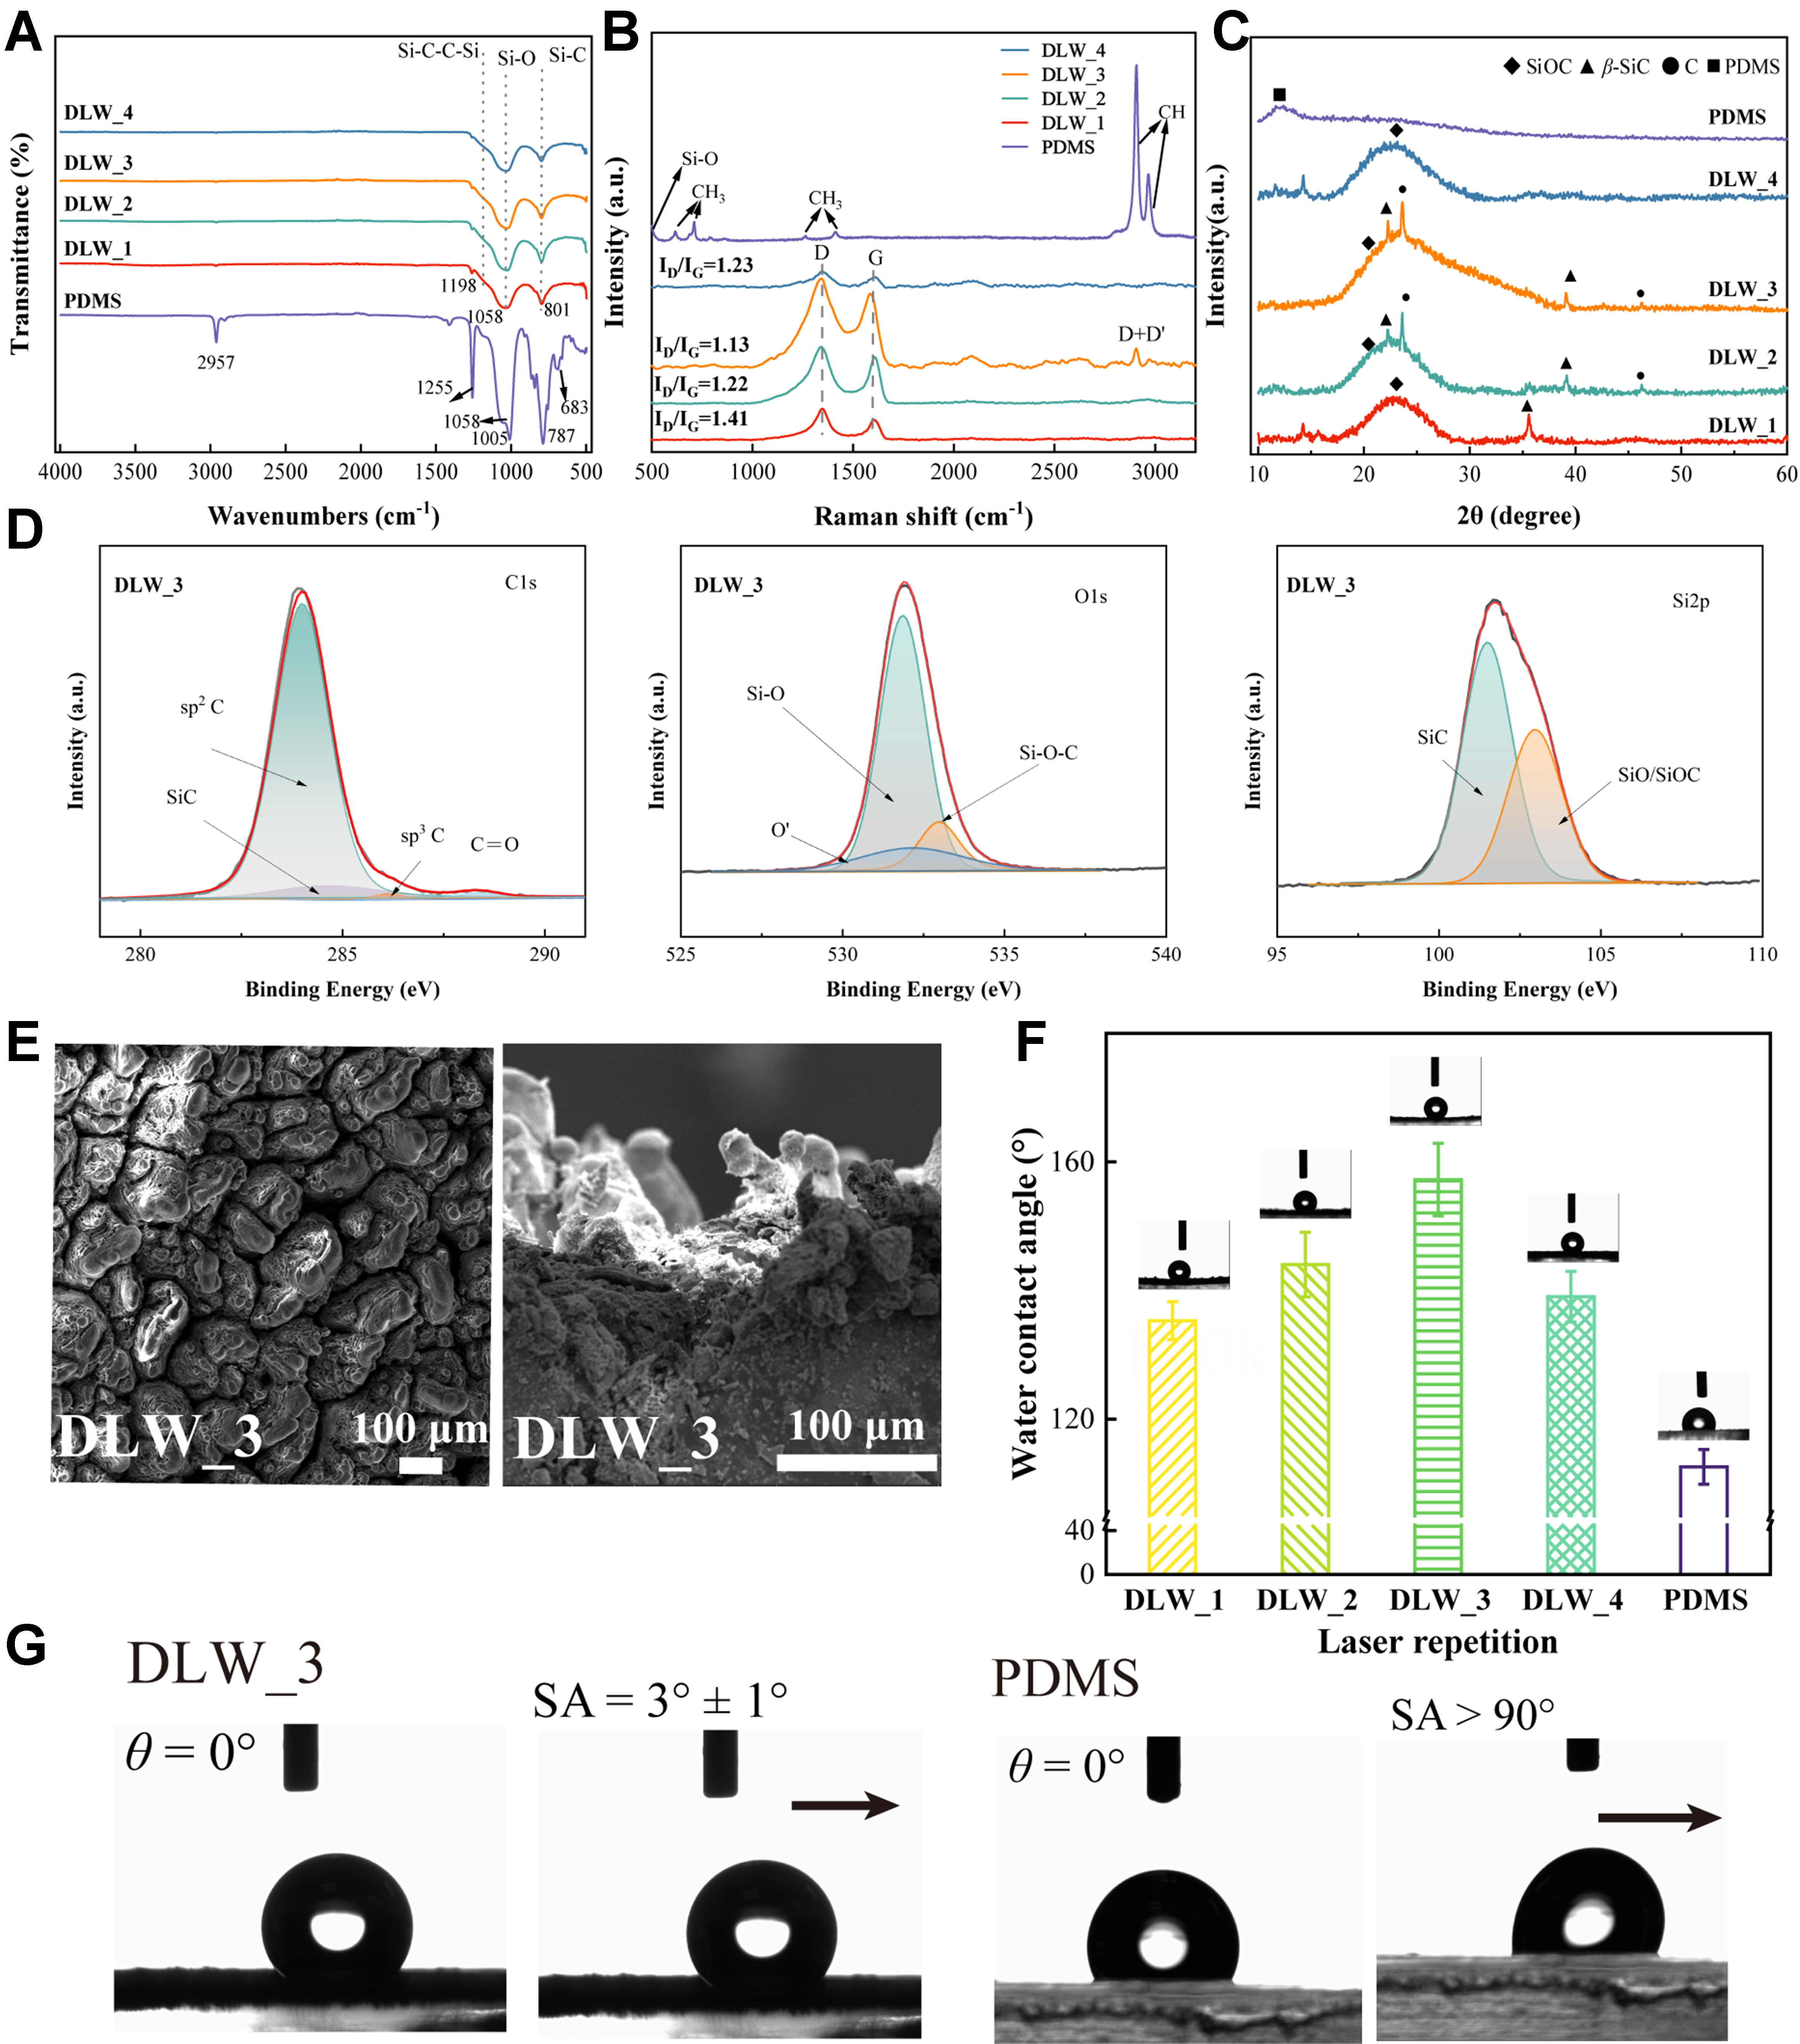
Figure 1. Characterization of the DLW-PDMS under different laser repetitions. DLW_n denotes n repetitions of a laser scan (1,000 mm/s speed, 1.8 W power, 10 kHz frequency, 5 pulses/dot). PDMS refers to the untreated substrate. (A) ATR-FTIR spectra; (B) Raman spectra showing the evolution of D and G bands; the ID/IG ratio is compared; (C) XRD patterns illustrating the emergence of crystalline phases with increased repetitions; (D) XPS spectra of the C 1s, O 1s, and Si 2p regions for the DLW_3 surface. The XPS spectra from other conditions are presented in Supplementary Figure 6; (E) SEM images of the hierarchical morphology of the DLW_3 surface; the scale bar is 100 μm. Other conditions are displayed in Supplementary Figure 7; (F) WCA measurements for untreated PDMS and DLW-treated surfaces; (G) SA measurements of DLW_3 and PDMS. The SA measurements from other conditions are presented in Supplementary Figure 8. Data for WCA and SA are presented as mean ± SD (n = 3, three independent samples per group). DLW: Direct laser writing; PDMS: polydimethylsiloxane; ATR-FTIR: attenuated total reflectance-Fourier transform infrared spectroscopy; XRD: X-ray diffraction; XPS: X-ray photoelectron spectroscopy; SEM: scanning electron microscopy; WCA: water contact angle; SA: sliding angle; SD: standard deviation; SiOC: silicon oxycarbide.





