

fig4
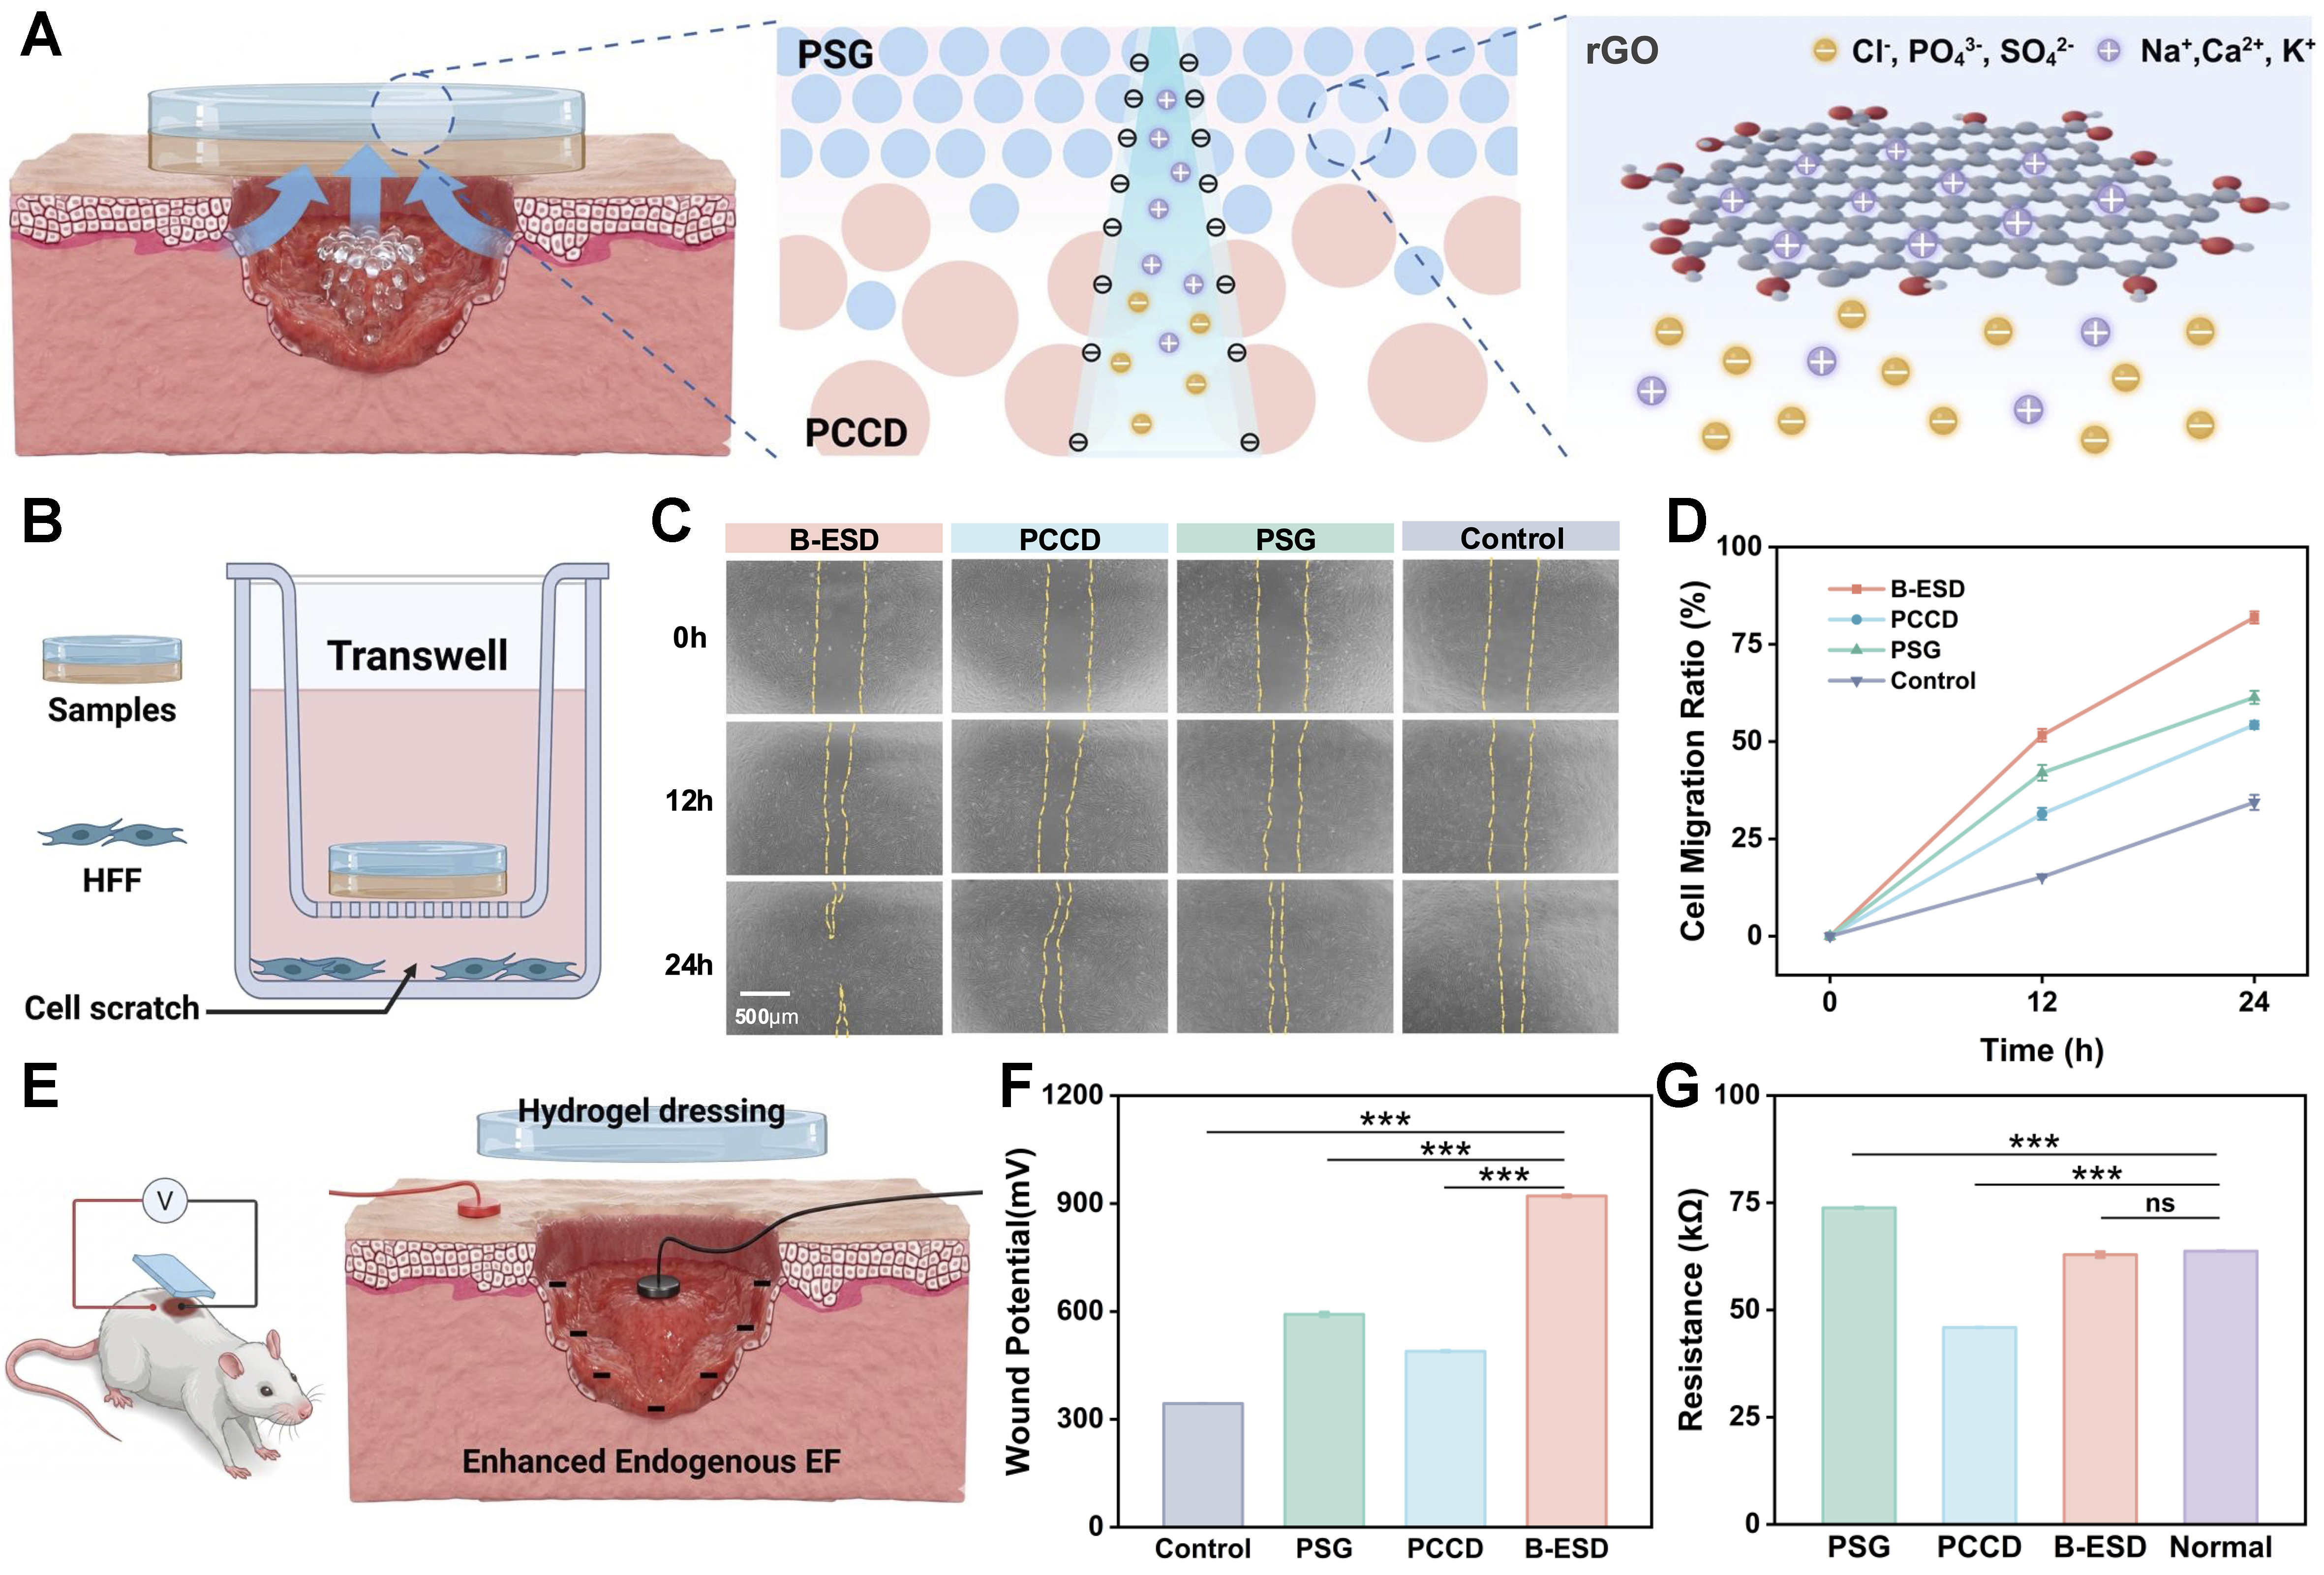
Figure 4. Mechanism of endogenous EF amplification and subsequent in vitro and in vivo evaluations. (A) Schematic illustration of streaming potential generation driven by unidirectional exudate pumping and rGO charge collection; (B) Setup of the modified Transwell cell scratch healing test; (C) Representative images and (D) quantitative analysis of HFF cell migration ratios at 0, 12, and 24 h; (E) Schematic of in situ potential measurement on a rat wound model; (F) Wound potential and (G) resistance tested under different treatments. Data are expressed as mean ± standard deviation (n = 3, ***P < 0.001, ns: not significant). (A, B, and E) were created with BioRender. Du, X. (2026) https://BioRender.com/6b3d3he. EF: Electric field; rGO: reduced graphene oxide; HFF: human foreskin fibroblast; PSG: polyacrylamide/sodium alginate/reduced graphene oxide (PAM/SA/rGO); PCCD: polyacrylamide/sodium carboxymethyl cellulose/calcium chloride/dopamine; B-ESD: bilayer electrogenerative smart dressing.





