

fig7
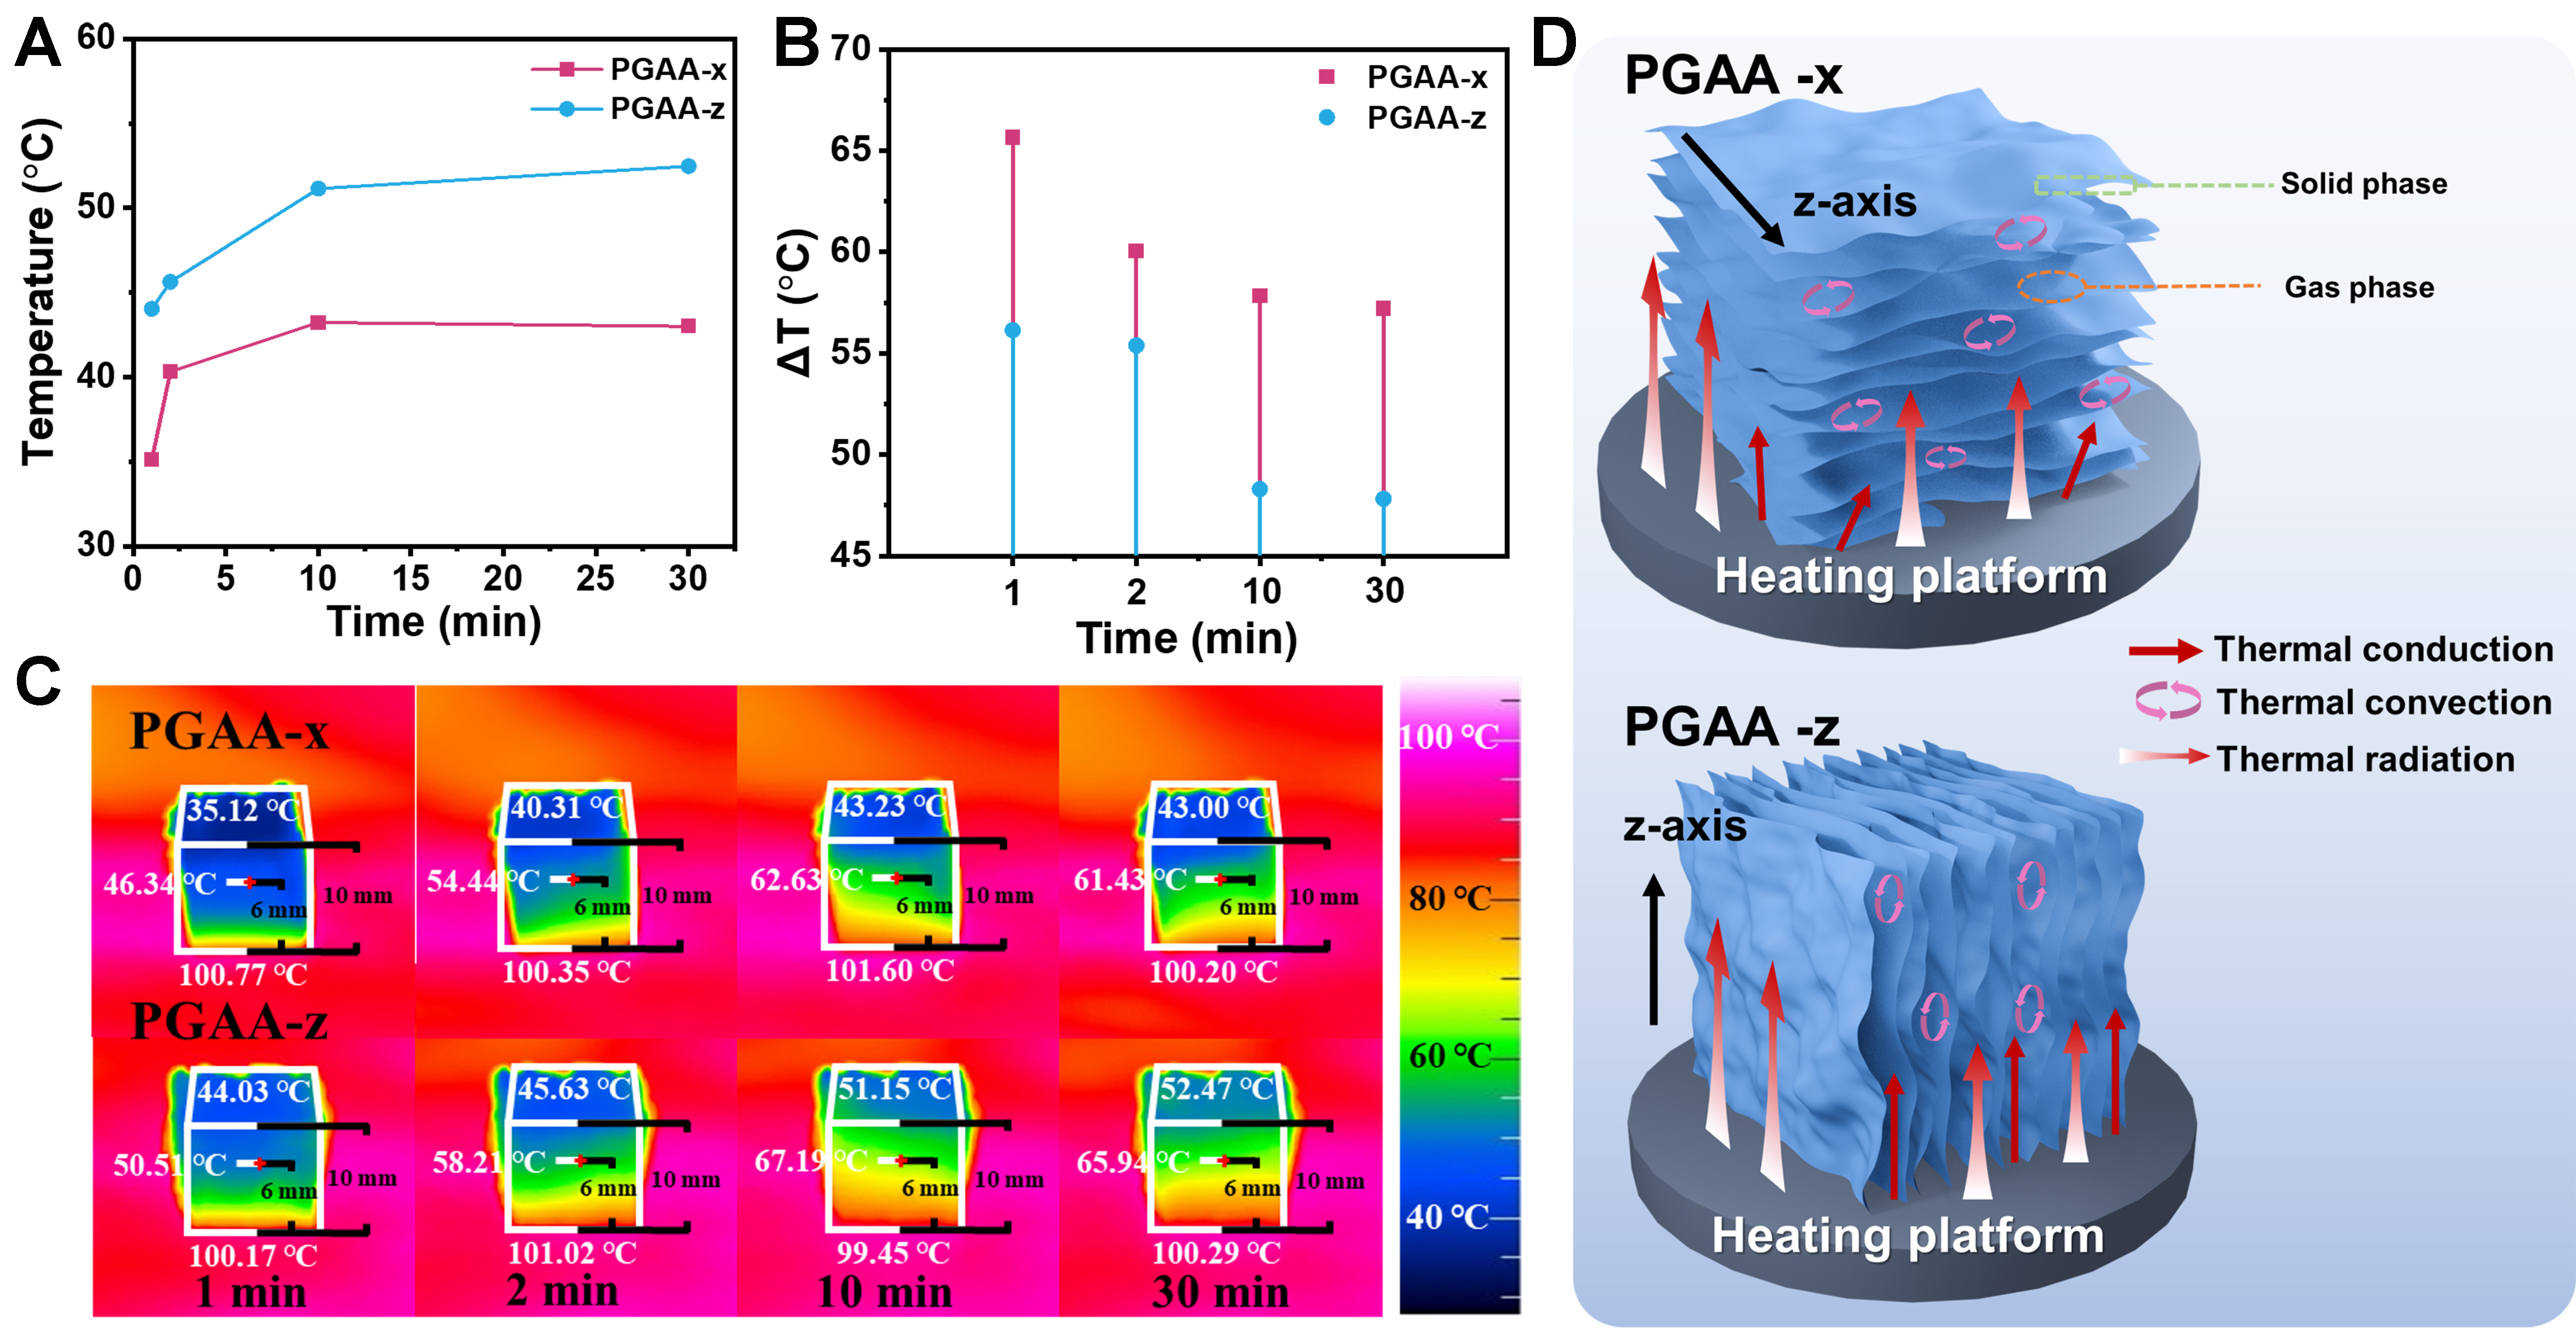
Figure 7. (A and B) Temperature-rise curves and corresponding ΔT values of PGAA during heating from 1 to 30 min; (C) IR thermal images and corresponding temperature profiles of PGAA composite aerogels recorded at different heating times; (D) Schematic illustration of the placement configurations of the PGAA composite aerogel. IR: Infrared.





