

fig3
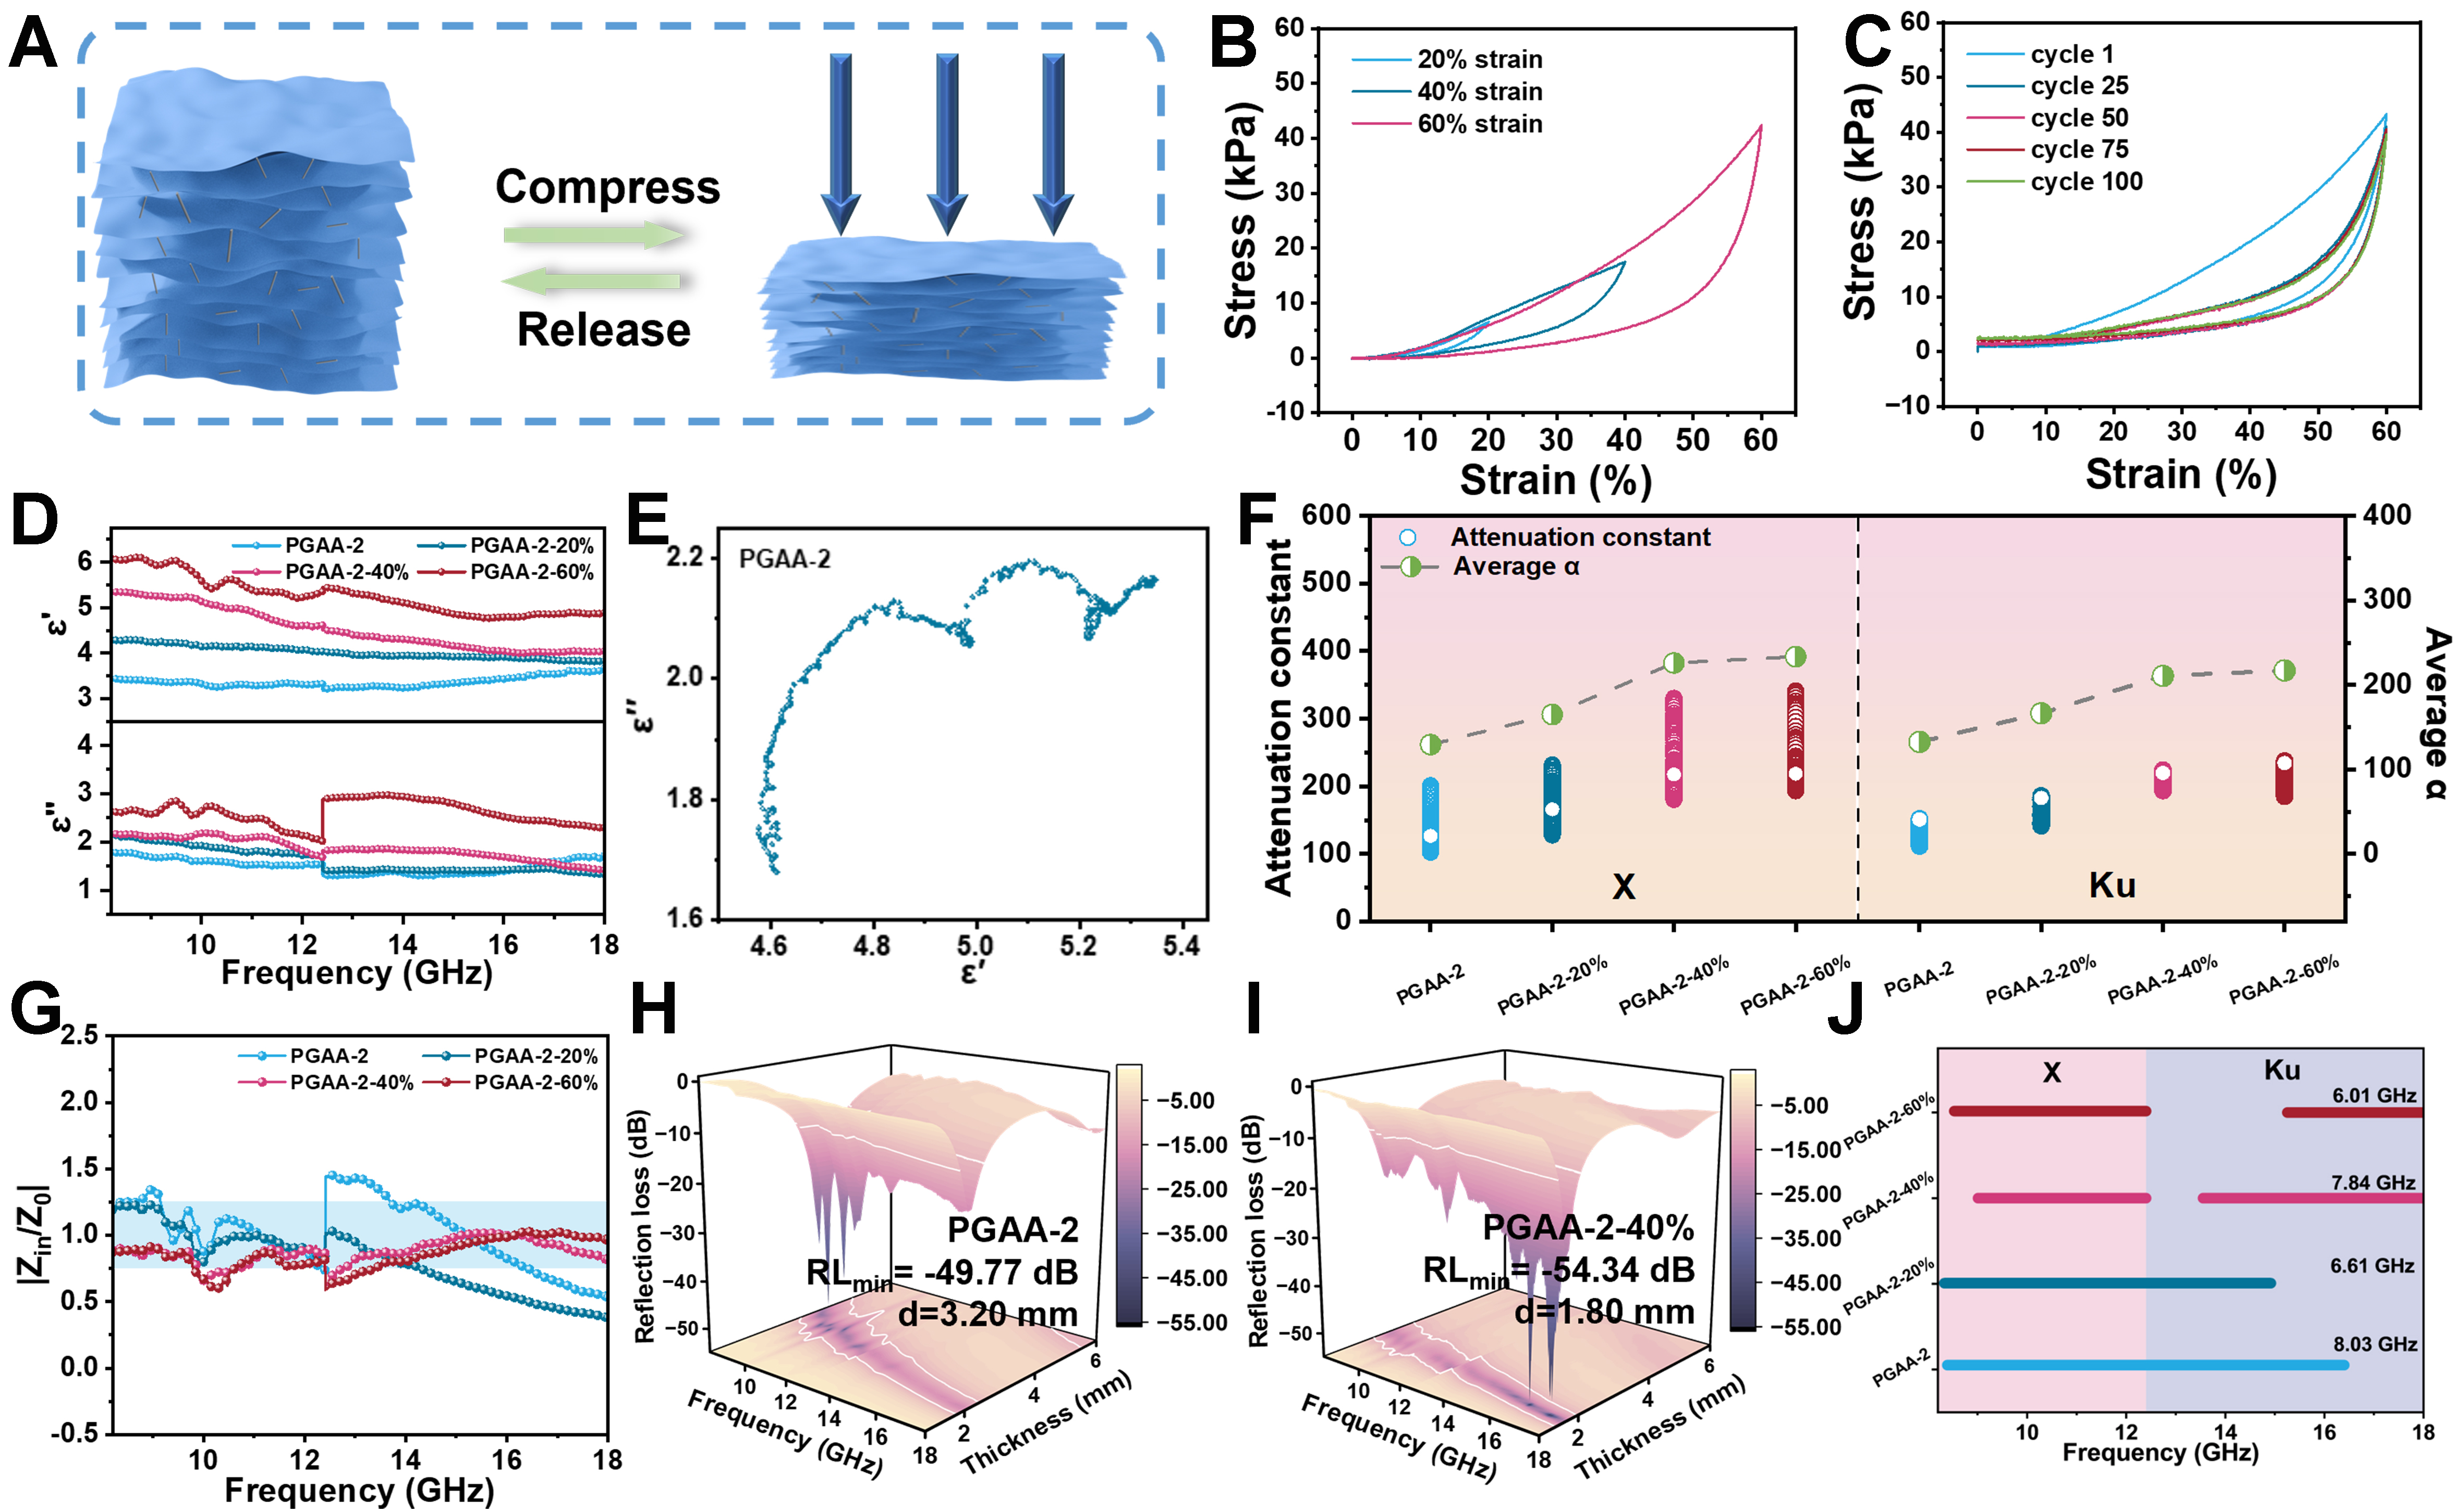
Figure 3. (A) Schematic diagram of mechanical compression of PGAA-2; (B) Stress‒strain curve of PGAA-2; (C) Compression cycle curve of PGAA-2; (D) ε′ and ε′′ of PGAA-2; (E) Cole-Cole curve of PGAA-2; (F) Attenuation constant (α); (G) |Zin/Z0|; (H and I) 3D RL curves of PGAA-2 and PGAA-2-40%; (J) EAB of PGAA-2 under different strains in the X-band and Ku-band. 3D: Three-dimensional; RL: reflection loss; EAB: effective absorption bandwidth.





