

fig1
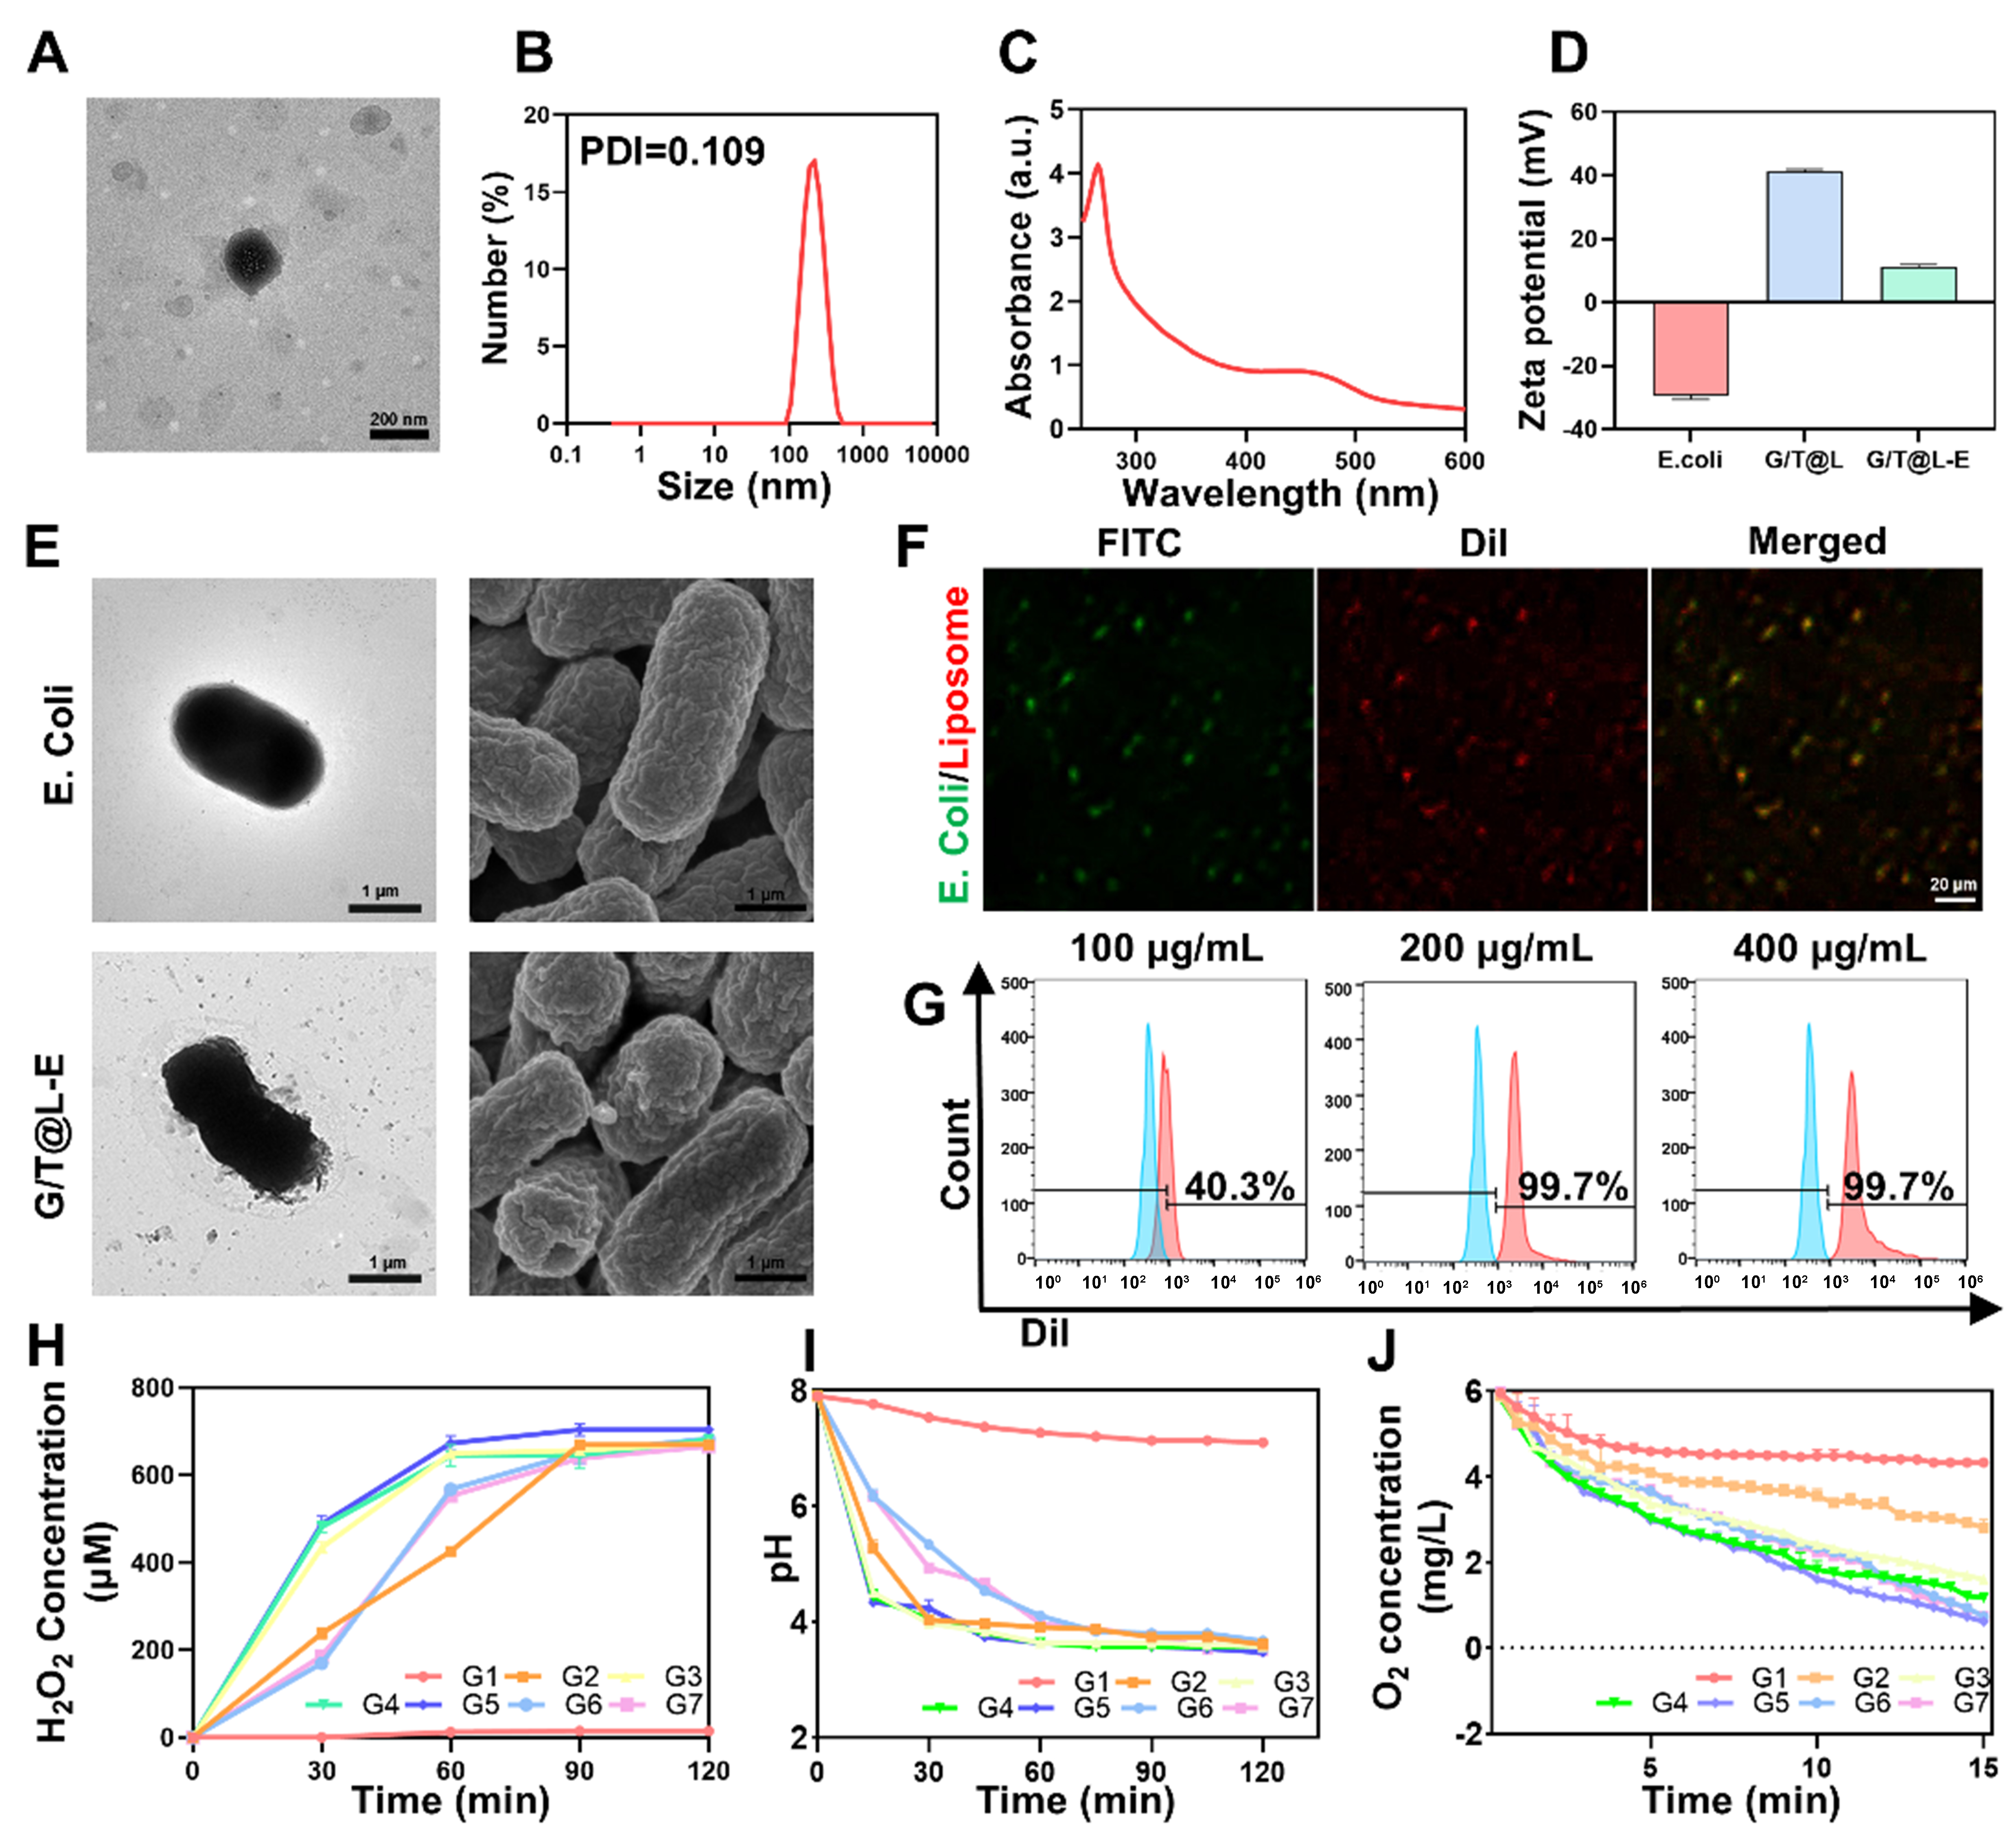
Figure 1. Characterization of G/T@L-E. (A) TEM image of G/T@L. Scale bar: 200 nm; (B) Size distribution of G/T@L via DLS; (C) UV-vis absorbance spectra of G/T@L; (D)Zeta potentials of E. coli, G/T@L, and G/T@L-E. n = 3; (E) TEM and SEM images of E. coli DH5α and G/T@L-E. Scale bar: 1 µm; (F) Typical CLSM images of G/T@L-E. The green and red channels indicate E. coli labeled with FITC and G/T@L labeled with Dil, respectively. Scale bar: 20 µm; (G) Flow cytometric analysis of E. coli conjugated with different proportions of Dil-labeled liposome. Blue: bare E. coli; red: G/T@L-E; (H) H2O2 concentration in glucose solution (1 mg/mL, 10 mL) after addition of free GOx, G@L or G/T@L. n = 3; (I) pH decreases in glucose solution (1 mg/mL, 10 mL) with time after addition of free GOx, G@L or G/T@L. n = 3; (J) Time-dependent changes in dissolved O2 in buffered saline with varied concentrations of free GOx, G@L and G/T@L in the glucose solution





