


Deep learning-based inverse design and forward prediction of bi-material 4D-printed facial shells
 0
0 
Abstract
The programmable properties of polylactic acids and shape memory polymers in 4D printing enable time-dependent shape transformations, allowing the fabrication of 3D shells with zero material waste. However, achieving target geometries requires inverse design, often constrained by slow evolutionary algorithms or complex analytical models. Herein, we present a 2D curve matrix, tuned by material ratios and arc angles, to enable contraction or elongation and thereby reproduce protruding features such as noses. A fully convolutional network (FCN) directly generates design patterns with high accuracy from depth images in a single step, with multi-task learning predicting rib composition and curvature. In parallel, we refine the inverse design of the line matrix and utilize transfer learning to accurately reconstruct human facial geometries, while the FCN also performs well in forward prediction to bypass computational costs. Furthermore, the fabricated 3D shells closely match target facial features in both scale and geometry, with minimal deviation between simulations and experiments, demonstrating the method’s potential for scalable, customizable 4D-printed applications.

Keywords
INTRODUCTION
Thin-walled shell structures exhibit an exceptional strength-to-weight ratio due to their efficient stress distribution[1]. This allows them to withstand substantial external loads with minimal material usage, making them ideal for applications in aerospace, automotive, and biomedical manufacturing[2-5]. However, traditional scalable production methods such as injection molding, subtractive manufacturing, and additive manufacturing have significant limitations when it comes to producing customized complex geometries. These challenges arise from high mold costs, lengthy production cycles, and the creation of material waste. In three-dimensional (3D) printing, the amount of support material can exceed the primary structure’s volume. Therefore, 4D printing technology has been proposed as an innovative solution that achieves high manufacturing efficiency with zero material waste[6-9]. Integrating time as the fourth dimension and utilizing smart materials enables rapid prototyping, allowing for a high level of customization in structural geometry[10-14], as well as the potential for rotary 4D printing, which has recently been proposed as an advanced manufacturing approach[15].
To effectively control and predict shape-morphing behavior, parametric design has emerged as a crucial approach[16-19]. This method quantitatively encodes various material properties and the levels of deformation, systematically integrating them into the design framework[20-27]. By incorporating finite element analysis (FEA), parametric design not only improves the efficiency of experimental iterations but also allows for accurate predictions of structural deformation[28-33]. However, achieving the target shape and property requires inverse design strategies, such as conformal mapping[20,34], mathematical functions[35-37], topology optimization[25], and machine learning with evolutionary algorithms[21], to establish a connection between the design framework and the desired geometry. With the rapid advancement of artificial intelligence, deep learning demonstrates significant advantages through high computational efficiency. It enables the automatic generation of optimal design solutions[38-43], greatly improving both design efficiency and accuracy, thereby facilitating the realization of customized target geometries in 4D printing.
Facial masks have become a focal point of research due to their complex geometric features and high degree of personalization. Noses, eyes, mouths, and facial contours at various scales have unique curvatures and concavities, requiring more complicated and precise inverse design methods to implement 4D printing technology effectively[44]. Boley et al. utilized machine learning combined with conformal mapping to compute the lattice design required for a single Gaussian human face[20]. Nojoomi et al. used conformal mapping with a cone singularity to compute the growth function, and then applied digital light optical 4D printing to fabricate the design corresponding to a 3D face scan[34]. Ahn et al. employed mathematical functions and strain distribution to determine the 4D printing parameters necessary for a Korean facial mask[35]. However, the multi-step inverse design process required for a single facial target shape remains a significant challenge in manufacturing applications. We present the curve matrix, designed to emulate the geometric characteristics of the nose, which enables greater deformation with less material compared with the previously adopted line matrix[45]. Moreover, a fully convolutional network (FCN) is employed, utilizing multi-task learning on the curve matrix and transfer learning on the line matrix, to effectively address the inverse design of human facial features with complex global and local curvatures. The FCN also carries out a forward prediction task to estimate the 3D structure following deformation. Integrating FEA of shape morphing with deep learning for 3D feature extraction allows for the fabrication of customized complex geometries, significantly reducing manufacturing costs and simplifying the inverse design process.
EXPERIMENTAL
Curve matrix
Employing a stacked arrangement of polylactic acids (PLA) and shape memory polymers (SMP) and fabricating the structures using conventional fused deposition modeling (FDM) printing processes, we developed a curve matrix that, when thermally activated, stably retains its 3D shape at room temperature and can revert to its original planar form upon reheating through the shape-memory effect. The previous line matrix achieved deformation primarily through contraction between two endpoints[45]; however, the curve matrix allows for both contraction and extension of the endpoint distance, offering a more versatile deformation mechanism in 3D space. To validate the controllable deformation of the curved matrix, we chose to apply it to the nasal region, a small area characterized by distinct curvature variations on the human face [Figure 1A]. The axial and longitudinal expansion and contraction characteristics of the curve matrix can just meet the nose’s needs for 3D contour expansion and contraction during the heating deformation process.
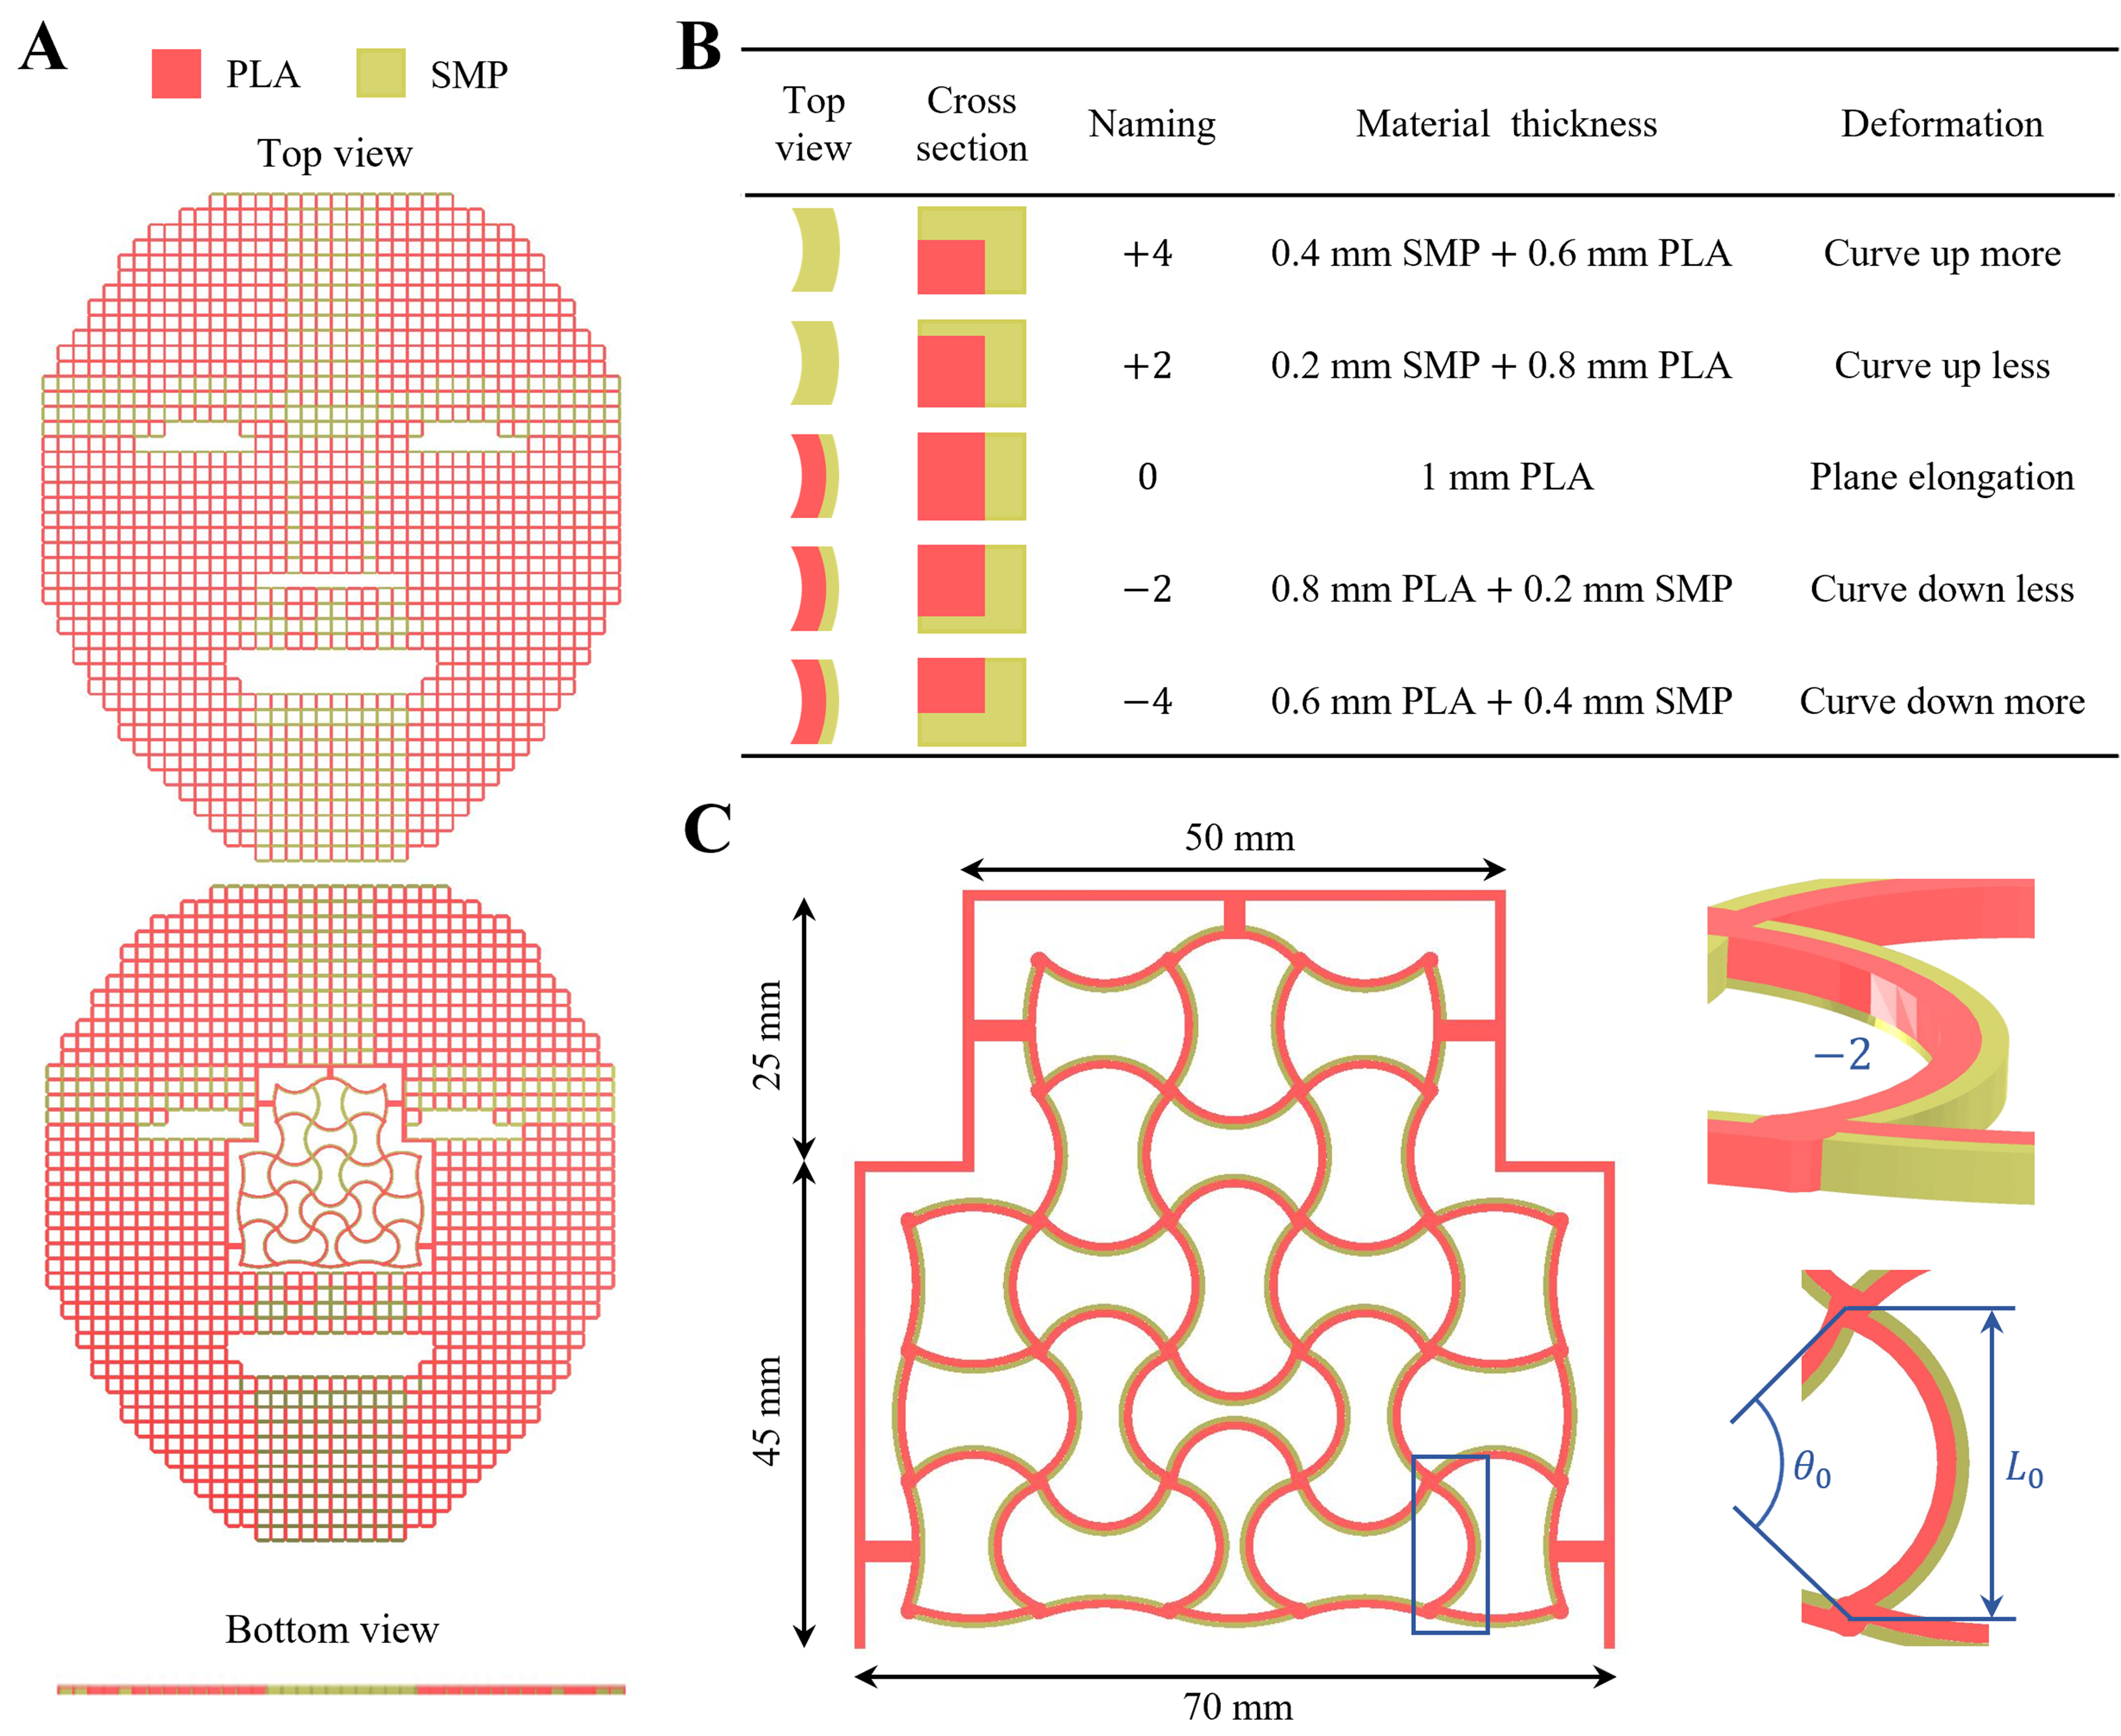
Figure 1. (A) Replacement of line matrix in the nasal region of the previously developed facial mask with the curve matrix; (B) Five deformation mechanisms designed by stacking PLA and SMP, showing top view, cross-section, naming, and thicknesses; (C) Definition of connecting frame size, rib end points (L0 = 12 mm), and sweep angle (θ0 = 30°-160°). PLA: Polylactic acid; SMP: shape memory polymer.
Each rib unit in the curve matrix involves two design categories. (1) Material design [Figure 1B]: by varying the distribution ratio of materials through the thickness of the rib unit, we achieve five bending directions and bending levels. The widths of the five ribs are 0.75 mm for PLA and 0.5 mm for SMP. The high-shrinkage SMP is placed on the exterior side of the arc, while the lower-shrinkage PLA is placed on the interior side. Upon thermal activation, the greater contraction of SMP draws the ends of the rib outward along the arc, while the PLA resists, causing the midsection of the rib to push inward [Supplementary Figures 1 and 2]; (2) Angle design [Figure 1C]: the distance between the two end points of each rib unit L0 is set to 12 mm, and the degree of curvature is defined by the sweep angle θ0 of the arc. To avoid interference within the 3D printing space and to adhere to maximum machine limitations, the value of θ0 is constrained between 30° and 160°. The connecting frame was constructed as a bridge between the line and curve matrices.
In 4D printing, a 3D printer (Bambu Lab X1-Carbon, BLSP007) was used to print rib designs using PLA (Bambu Lab, BL00003) and SMP (developed by KYORAKU Co., Ltd., Supplementary Figure 3). We employed shape hot programming[46], in which the material is heated above its glass transition temperature during shaping and then cooled under constraint to fix the temporary shape. The printing was performed on a heated bed set at 55 °C, with both PLA and SMP extruded at 220 °C. The printing speed was set to
The basic shape of the human nose has several key features. First, the midline of the nasal dorsum is the most prominent area, with its height decreasing toward the lateral sides. Second, the nasal tip represents the highest point, and the elevation diminishes as one moves away from this tip. Third, the wings of the nose generally slope downward. Lastly, the shape at the root of the nose is more complex; it may curve upward, remain straight, or curve downward. We designed a symmetrical structure that aligns with angles and materials, using the nasal midline as the axis of symmetry. Furthermore, we integrated the heterogeneous architecture to facilitate out-of-plane deformation, thereby enhancing the overall 3D morphing capability
FEA
This study approximates the mechanism of pre-stress release in SMP using a linear thermal expansion model. By modifying the material’s coefficient of thermal expansion and the temperature differential applied, we can replicate a deformation field similar to that of a fully nonlinear SMP finite element model. To ensure consistent boundary conditions between experiment and simulation, we determined that the center of mass of the mask was at the center of the fourth row of the curve matrix [Supplementary Figures 14 and 15]. Its position was fixed during hot water immersion to ensure consistent deformation by preventing tilting. In the simulation, this design was fixed while an acceleration field was applied to simulate gravity and buoyancy, using the Shell181 element to account for nonlinear geometric deformation. Owing to the symmetrical geometry and material configuration, adopting symmetrical model settings not only reduces computational costs but also aids in convergence and effectively reproduces the deformations observed in the hot-water experiments. By moderately reducing the Young’s modulus and increasing the thermal expansion coefficient, an optimal balance between deformation accuracy and simulation convergence was achieved [Supplementary Table 1]. After replacing the nasal region with a curve matrix, the simulation time increased from 200 to 330 s, representing an approximate 65% increase. To investigate the deformation field and inverse design feasibility of the curve matrix, the boundary conditions of the line matrix at the connecting frame were applied to a large number of subsequent curve matrix simulations
Deep learning dataset
In the previous study[45], four types of grid units were designed using different stacking configurations of SMP and PLA in the line matrix. We refined the previous dataset generation process [Figure 2A]. To better fit human facial features in this study, we improved the polynomial function with 28 parameters that describe the shapes of eyes, eyebrows, nose, philtrum, mouth, chin, cheeks, and facial contours
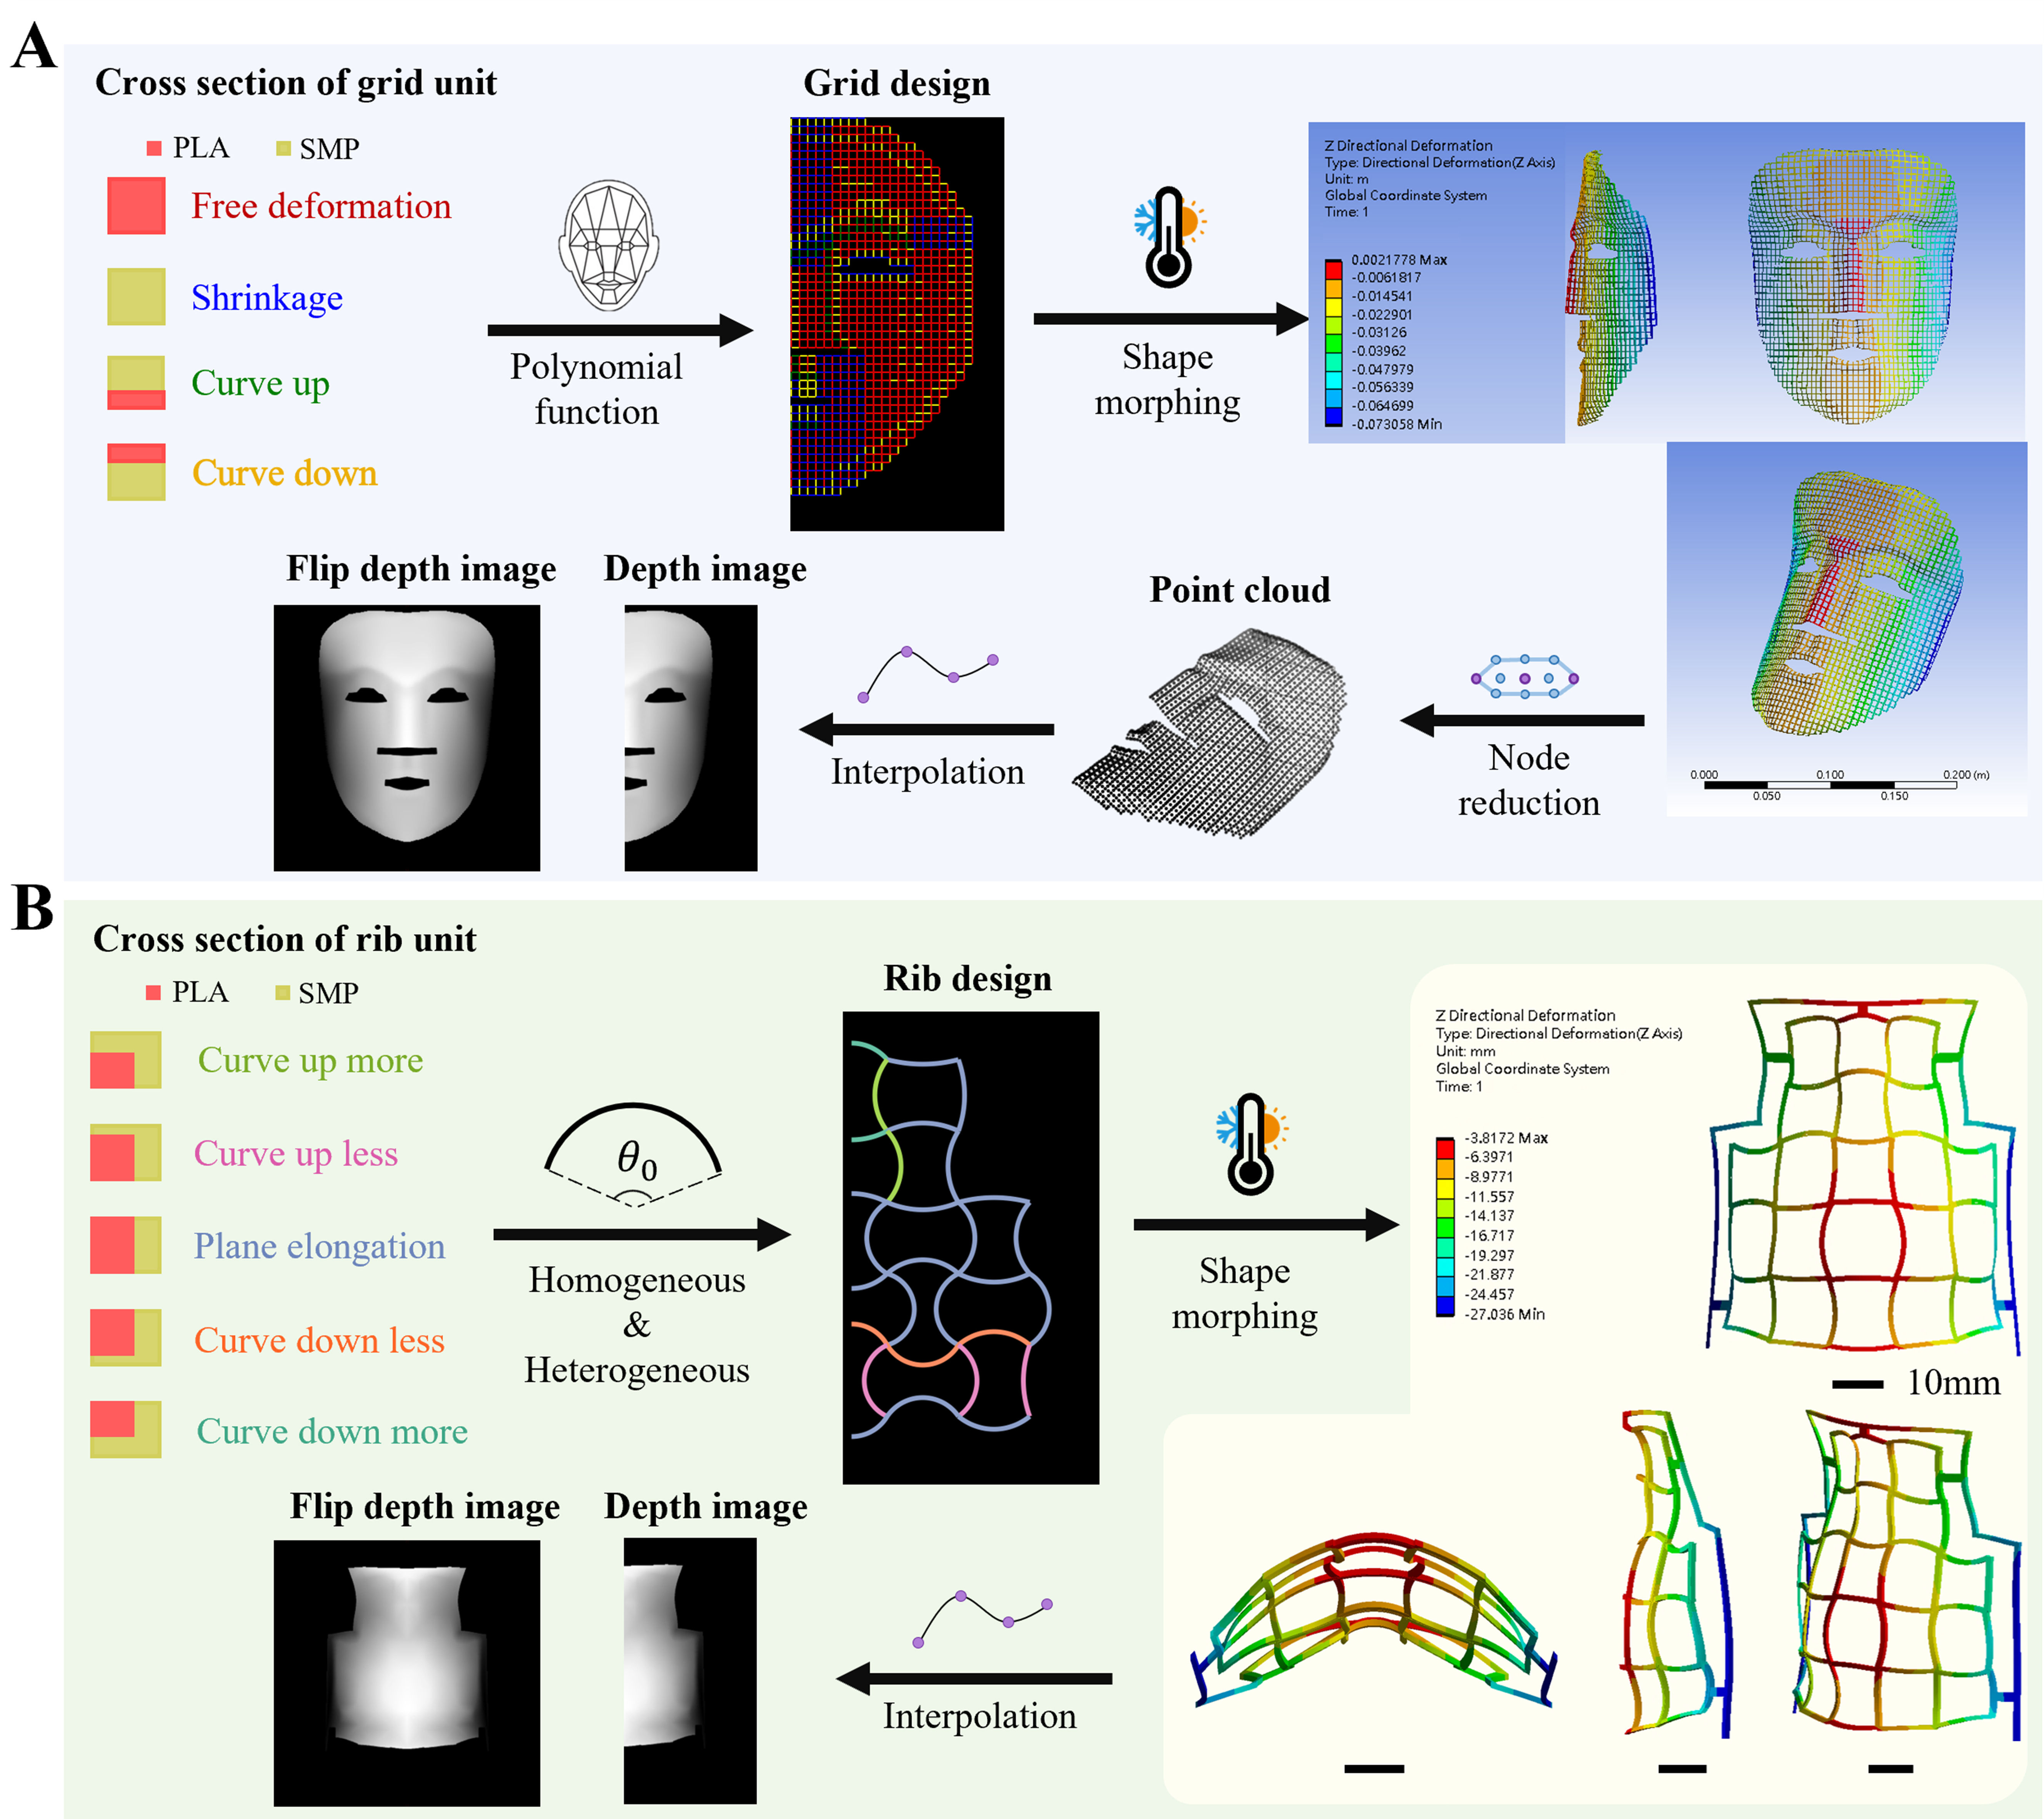
Figure 2. Workflow for generating deep learning datasets for (A) line matrix and (B) curve matrix. PLA: Polylactic acid; SMP: shape memory polymer.
The workflow for generating the nose depth image [Figure 2B] is similar to that for the mask, without node reduction, and the same parameter settings are applied to the same parts. To minimize computations and prevent interpolated values from filling areas outside the connecting frame, the 3D coordinates of each node obtained from FEA were rounded to make it easier to identify node numbers within the frame. The top of each nose is then fixed in the same position, 0.01 meters lower than the original position, to complete the generation of the depth image [Supplementary Figure 27]. This cycle completes 13,360 nose designs and incorporates angle design, material design, and depth image into the .npy file, with the angle design represented as a two-dimensional array of integer values [Supplementary Figures 28 and 29]. In contrast to the line matrix, the curve matrix does not suffer from the issue of being unclosed. The only drawbacks are non-convergence and incomplete nodes provided by ANSYS Workbench, which ultimately enhance the quality of the simulation process.
Depth image of human face
Utilizing 1,270 facial images (hereinafter called REAL) from three publicly available facial databases: 666 images from the Chicago Face Database (https://www.chicagofaces.org/)[47-49], 400 from the FEI Face Database (https://fei.edu.br/~cet/facedatabase.html)[50], and 204 from the London Face Research Laboratory (https://figshare.com/articles/dataset/Face_Research_Lab_London_Set/5047666)[51]. We developed the REAL dataset using a preprocessing pipeline that can handle facial images of various sizes, producing cropped images, facial landmarks, and corresponding scaled depth images [Supplementary Figure 30 and Supplementary Movie 4].
We utilized OpenCV and MediaPipe to obtain face landmarks, using the iris as a reference for proportional scaling to align with real-world dimensions [Supplementary Figure 31]. Given the relative consistency of iris size within individuals and minimal variation across individuals, with mean diameters of 11, 11.39, 11.8, and 12 mm[52-56], this study scales the mean of both irises to 12 mm to establish a reliable coordinate system. We present the point numbers of the facial landmarks utilized in this study, along with overlays of the RGB (Red, Green, and Blue) face images and corresponding depth images to validate the accuracy and enhance the credibility of the data [Supplementary Table 3 and Supplementary Figure 32].
Filtered RANDOM and target shape
Incomplete, erroneous, or inappropriate training data can lead to unreliable models that ultimately produce suboptimal decisions[57]. To enhance the model performance and extrapolate facial data, we apply data filtering through feature extraction with a vision transformer (ViT)[58]. The pretrained ViT-Base-Patch16-224 model from the Torch Image Models library has been modified by removing its classification head and replacing it with “torch.nn.Identity()” to serve as a feature extractor. We fed 36,087 RANDOM depth images and 1,270 REAL depth images into the pre-trained ViT model to extract feature representations for each. These feature tensors were then flattened into arrays and reduced to two dimensions using principal component analysis (PCA), enabling visualization of the overall distribution of RANDOM and REAL [Figure 3A]. We utilized the mathematical properties of distances in PCA space to identify a RANDOM dataset that closely resembles REAL[59-61], thereby improving the quality of our training dataset. The orange box represents the boundary of the REAL, within which 21,373 green RANDOM dots were identified to create the filtered RANDOM dataset [Figure 3B].
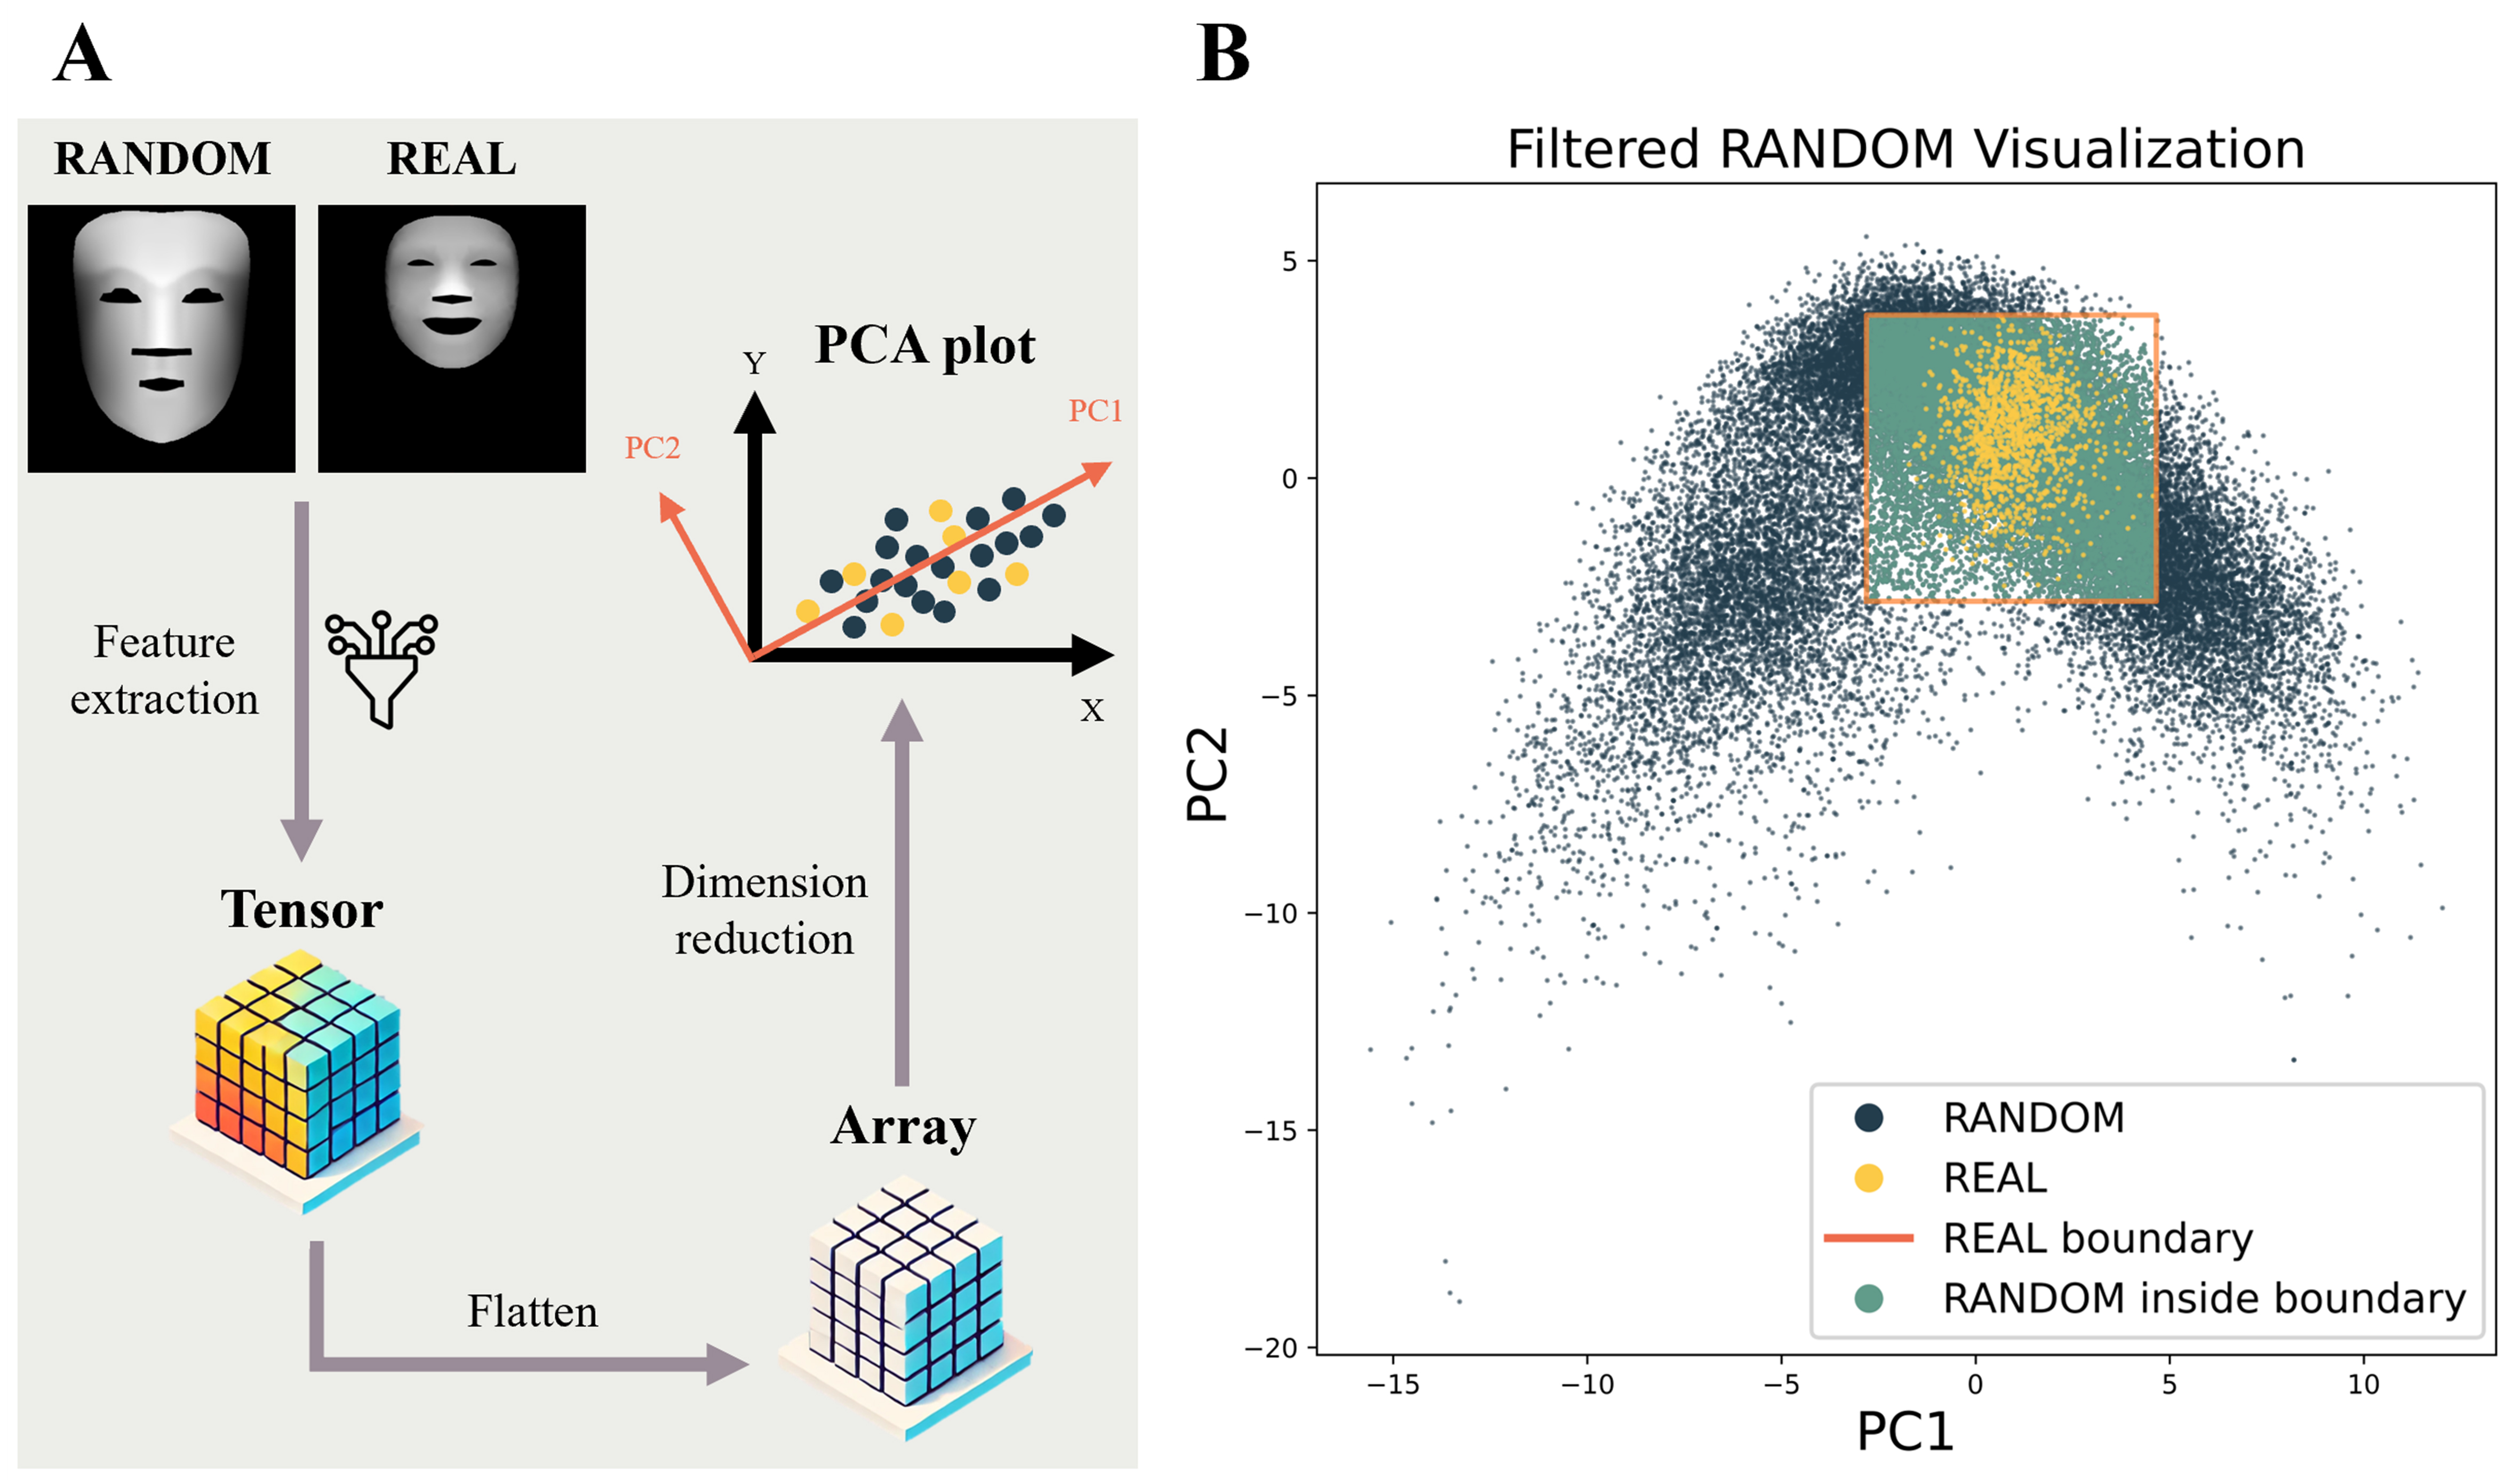
Figure 3. (A) Process of identifying RANDOM samples similar to REAL samples using feature extraction and PCA; (B) RANDOM samples within the boundary of the REAL samples are used as the training set to infer REAL. PCA: Principal component analysis.
The FEI and London Face Research Laboratory databases contain smiling faces with open mouths, while the Chicago Face Database features neutral faces with closed mouths. Additionally, the mouth height of the RANDOM mask varies from one grid unit (0.005 m) to over five units (0.025 m). This led to a difference between mask and neutral expressions [Supplementary Figure 33]. Therefore, REAL images exhibiting smiling expressions were retained as target shapes, defined by a y-direction distance greater than 0.007 meters between face landmark points 14 and 13. Based on this criterion, 195 human faces were selected from a total of 1,270 facial images.
Architectures of FCN
A total of 36,087 mask samples and 13,360 nose samples were split into training, validation, and test sets using a fixed random seed of 42. For both datasets, 10% of the samples were randomly selected as the test set, resulting in 3,609 mask samples and 1,336 nose samples. The remaining data were divided into training and validation sets at a 9:1 ratio, yielding 29,230 training and 3,248 validation samples for masks, and 10,822 training and 1,202 validation samples for noses. The FCN’s feature extractor begins by resizing the input to a shape of 1 × 128 × 64, followed by basic preprocessing operations [Figure 4A]. The first four layers of residential network (ResNet)-18 are then employed as the encoder without using any pretrained weights[62], allowing for effective hierarchical feature extraction. To retain spatial details and prevent the loss of fine-grained information during deep feature extraction, skip connections are incorporated to fuse shallow and deep features. Subsequently, a series of transposed convolution layers are used to progressively upsample the feature maps to the target shape. Building upon this encoder architecture, the study developed three FCNs tailored for specific tasks: line matrix inverse design, forward prediction, and curve matrix inverse design.
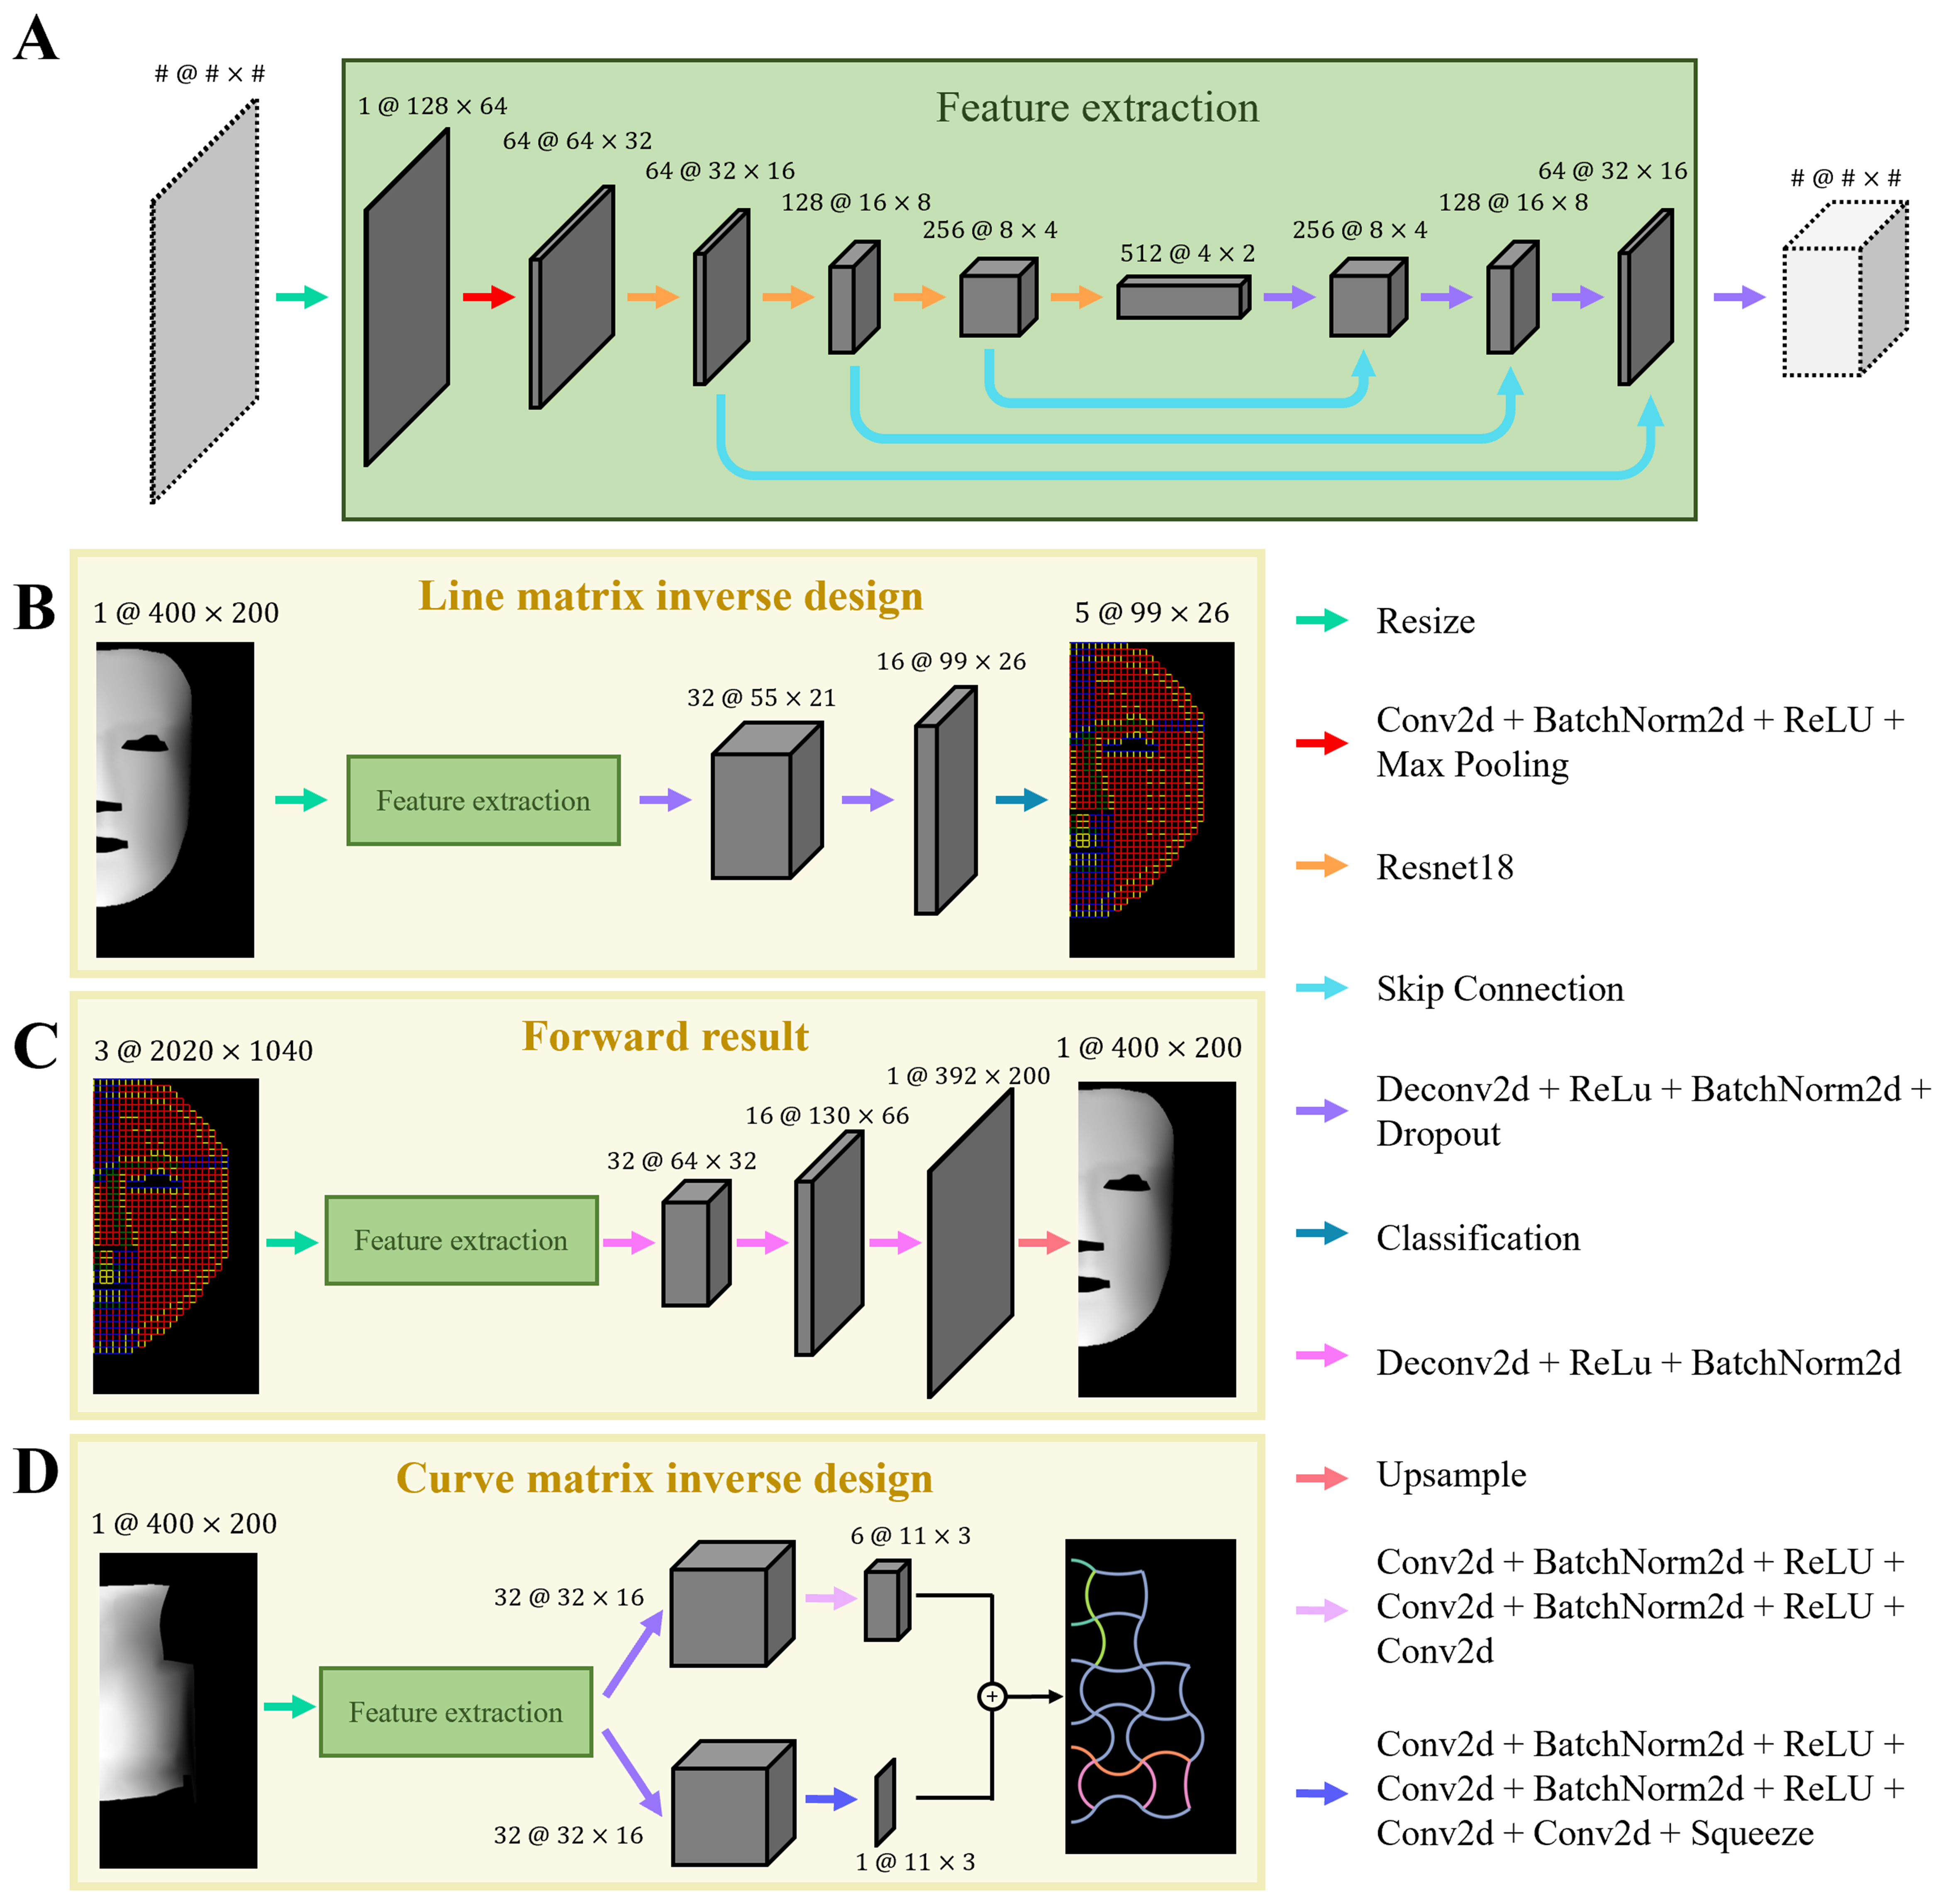
Figure 4. (A) Feature extractor of the FCN used to perform three tasks: (B) line matrix inverse design; (C) forward prediction; and (D) curve matrix inverse design. Operations between feature maps are indicated by arrows with text annotations. FCN: Fully convolutional network.
The task of line matrix inverse design involves deriving the required grid design from the depth image [Figure 4B]. The grid design is formulated as a 2D matrix with dimensions 99 × 26, wherein each element represents an individual grid unit. Due to the structural similarity between the grid matrix and pixel arrangement in images, this task is framed as an image segmentation problem, facilitating pixel-wise classification. The spatial information extracted from the depth image is used to describe the target shape and generate the corresponding grid design, enabling the rapid and environmentally friendly fabrication of thin-shell structures. The input depth image of size 1@400×200 undergoes feature extraction, followed by a series of transposed convolution layers that progressively upsample the feature maps to a size of 16@99×26. Finally, a classification layer outputs a tensor of size 5@99×26, representing the predicted distribution of five types of grid units within the design matrix.
The process of generating a depth image from a given grid design is defined as the forward prediction [Figure 4C]. This task predicts the 3D shell geometry from the grid design image, where each input pixel directly corresponds to a pixel in the output depth image. This FCN is employed to bypass the time-consuming FEA and extensive data processing, thereby enhancing the efficiency and diversity of the simulation database. Unlike conventional image segmentation tasks, this model performs pixel-wise regression to predict continuous depth values for each pixel. The grid design is represented as a color image with a resolution of 3@2,020×1,040, which is processed through feature extraction and progressively upsampled to produce a depth image with an output size of 1@400×200. Each pixel value in the output depth image falls within the range of 0 to 255.
Curve matrix inverse design refers to deriving the required rib design from the depth image [Figure 4D]. The rib design is represented by two 2D matrices of size 11 × 3: one for material design and one for angle design. Due to the convex shape of the curve matrix, which is not rectangular, an additional class is introduced in the material design to represent regions without rib units, and an angle of 0 is added in the angle design. As a result, this task involves not only pixel-wise classification but also pixel-wise regression. Compared to the line matrix, the curve matrix not only retains the advantages previously mentioned for thin-shell structure fabrication but also enables more complex geometric representations. The input depth image of size 1@400×200 is processed through feature extraction, followed by a series of transposed convolution layers, progressively upsampling the feature maps to outputs of size 6@11×3 for material prediction and 1@11×3 for angle prediction. We adopt a shared feature extraction backbone[63], where both angle and material predictions are generated from a common intermediate representation. By sharing convolutional layers and decoder pathways, the model effectively learns joint features for multi-task outputs, promoting parameter efficiency and mutual learning benefits.
Deep learning implementation
During training, various loss functions were utilized depending on the model type. For the line matrix inverse design model, CrossEntropyLoss was employed, while mean squared error (MSE) was used for the forward prediction model. In the case of the curve matrix inverse design model, CrossEntropyLoss was applied for material design, and L1 loss was used for angle design. All three models were optimized using the Adam optimizer. To enhance training stability and avoid missing local optima, the learning rate was automatically reduced by 50% if the validation loss did not improve for three consecutive epochs. The maximum number of training epochs was set to 150; however, early stopping was triggered if the validation loss failed to improve over ten consecutive epochs, in order to reduce the risk of overfitting. The multi-task learning strategy with hard parameter sharing was adopted to simultaneously optimize two objectives: material classification and angle regression. To balance the learning of both tasks, the GradNorm algorithm was employed to dynamically adjust task-specific loss weights by equalizing their gradient magnitudes with respect to shared parameters[63]. This approach prevents any single task from dominating the learning process and promotes more balanced and stable convergence, ultimately enhancing the overall performance of the multi-task model. The selection of learning rates and batch sizes was based on the model’s learning curvature. An excessively high learning rate may lead to unstable convergence, while a very low one would increase the training cost and time. The chosen parameters provided a balanced trade-off, ensuring stable optimization and efficient training performance. The entire deep learning workflow was implemented using the PyTorch framework, with all training and inference conducted on an NVIDIA GeForce RTX 3060 GPU.
In this study, several metrics were used to evaluate the accuracy and similarity between the predictions and the ground truth. The mean Intersection over Union (Mean IoU) and pixel accuracy were used to assess the classification accuracy of material design in the line matrix. For the curve matrix, not all material types appeared in every design instance. Therefore, classification accuracy was employed to evaluate whether the predicted material at each position matched the ground truth. Furthermore, the mean absolute error (MAE) was used to quantify the deviation between predicted and actual angle values. Although these metrics did not directly influence model parameter updates, their trends aligned with the validation loss, indicating that they effectively captured the accuracy of the inferred results compared to the ground truth [Supplementary Figure 34]. We employ the structural similarity index (SSIM)[64] and normalized cross-correlation (NCC)[65] to evaluate the similarity between the depth image and the inferred depth image. SSIM assesses visual similarity by examining brightness, contrast, and structural details. This method effectively evaluates geometric features and captures local structures in images, aligning closely with human perception. On the other hand, NCC measures the correlation of pixel intensities across images, offering a global assessment of image consistency and matching accuracy. Since SSIM emphasizes local structure and NCC assesses overall image similarity, these two complementary metrics facilitate a thorough analysis of depth image quality and accuracy, thereby further validating the effectiveness and robustness of the proposed method.
We attempted a conditional deep convolutional generative adversarial network (cDCGAN)[66] to learn the mapping from depth images to polynomial parameters. In practice, the generator encountered mode collapse, producing parameter sets that were unrecognizable compared to the ground truth designs. We also explored a reinforcement learning (RL)[67-69] framework that allows the agent to adjust polynomial parameters in order to achieve a target shape. However, when the ANSYS Simulation failed to converge, the RL agent’s trajectory would abruptly terminate. This hindered the ability to execute a stable inverse design process as in the FCN.
RESULTS AND DISCUSSION
Deep learning model performances
Under various hyperparameter combinations, the model performance remained relatively consistent without significant differences [Supplementary Figures 35-37]. For result analysis and discussion, the line matrix model was trained with a learning rate of 0.01 and a batch size of 32, while the curve matrix model used a learning rate of 0.0001 with the same batch size.
In line matrix inverse design, we randomly selected five samples to present progression from the grid design to the depth image, to the inferred grid design, and finally to the inferred depth image [Figure 5A]. In addition, these five samples for the simulation and the inferred simulation are presented [Supplementary Figures 38-42]. Due to non-convergence in the simulation and incomplete output from Ansys Workbench, the number of test samples was reduced from 3,609 to 3,470. For the grid design, the Mean IoU is 0.9947, with a median of 1.0 and a standard deviation of 0.0137 [Supplementary Table 4], indicating that nearly all test samples achieved IoU values close to 1 and that the model can predict the grid design corresponding to each depth image with near-perfect accuracy. The Pixel Accuracy attained a mean of 0.9986, a median of 1.0, and a standard deviation of only 0.0049, confirming minimal variability in the classification results and underscoring the model’s high stability. For depth image similarity evaluation, the SSIM has a mean of 0.9799, a median of 0.9862, and a standard deviation of 0.0272, indicating that the inferred depth images are highly consistent with the depth images regarding brightness, contrast, and structural features. The NCC shows a mean of 0.9906, a median of 0.9975, and a standard deviation of 0.0334, confirming the excellent match between the depth images and inferred ones. Although the grid design is identical, subtle differences in the depth images arise from simulation deformation. As a result, there are relatively few samples with perfect matches in both SSIM and NCC, highlighting the high sensitivity of these metrics to variations in depth information. Detailed analysis indicates that in the test set, 1,919 samples achieved a Mean IOU and Pixel Accuracy of 1, signifying that 55.3% of the samples perfectly predicted the grid design corresponding to the depth image. Furthermore, 717 samples achieved perfect SSIM and NCC scores of 1, indicating that the inferred depth images were identical to the original ones.
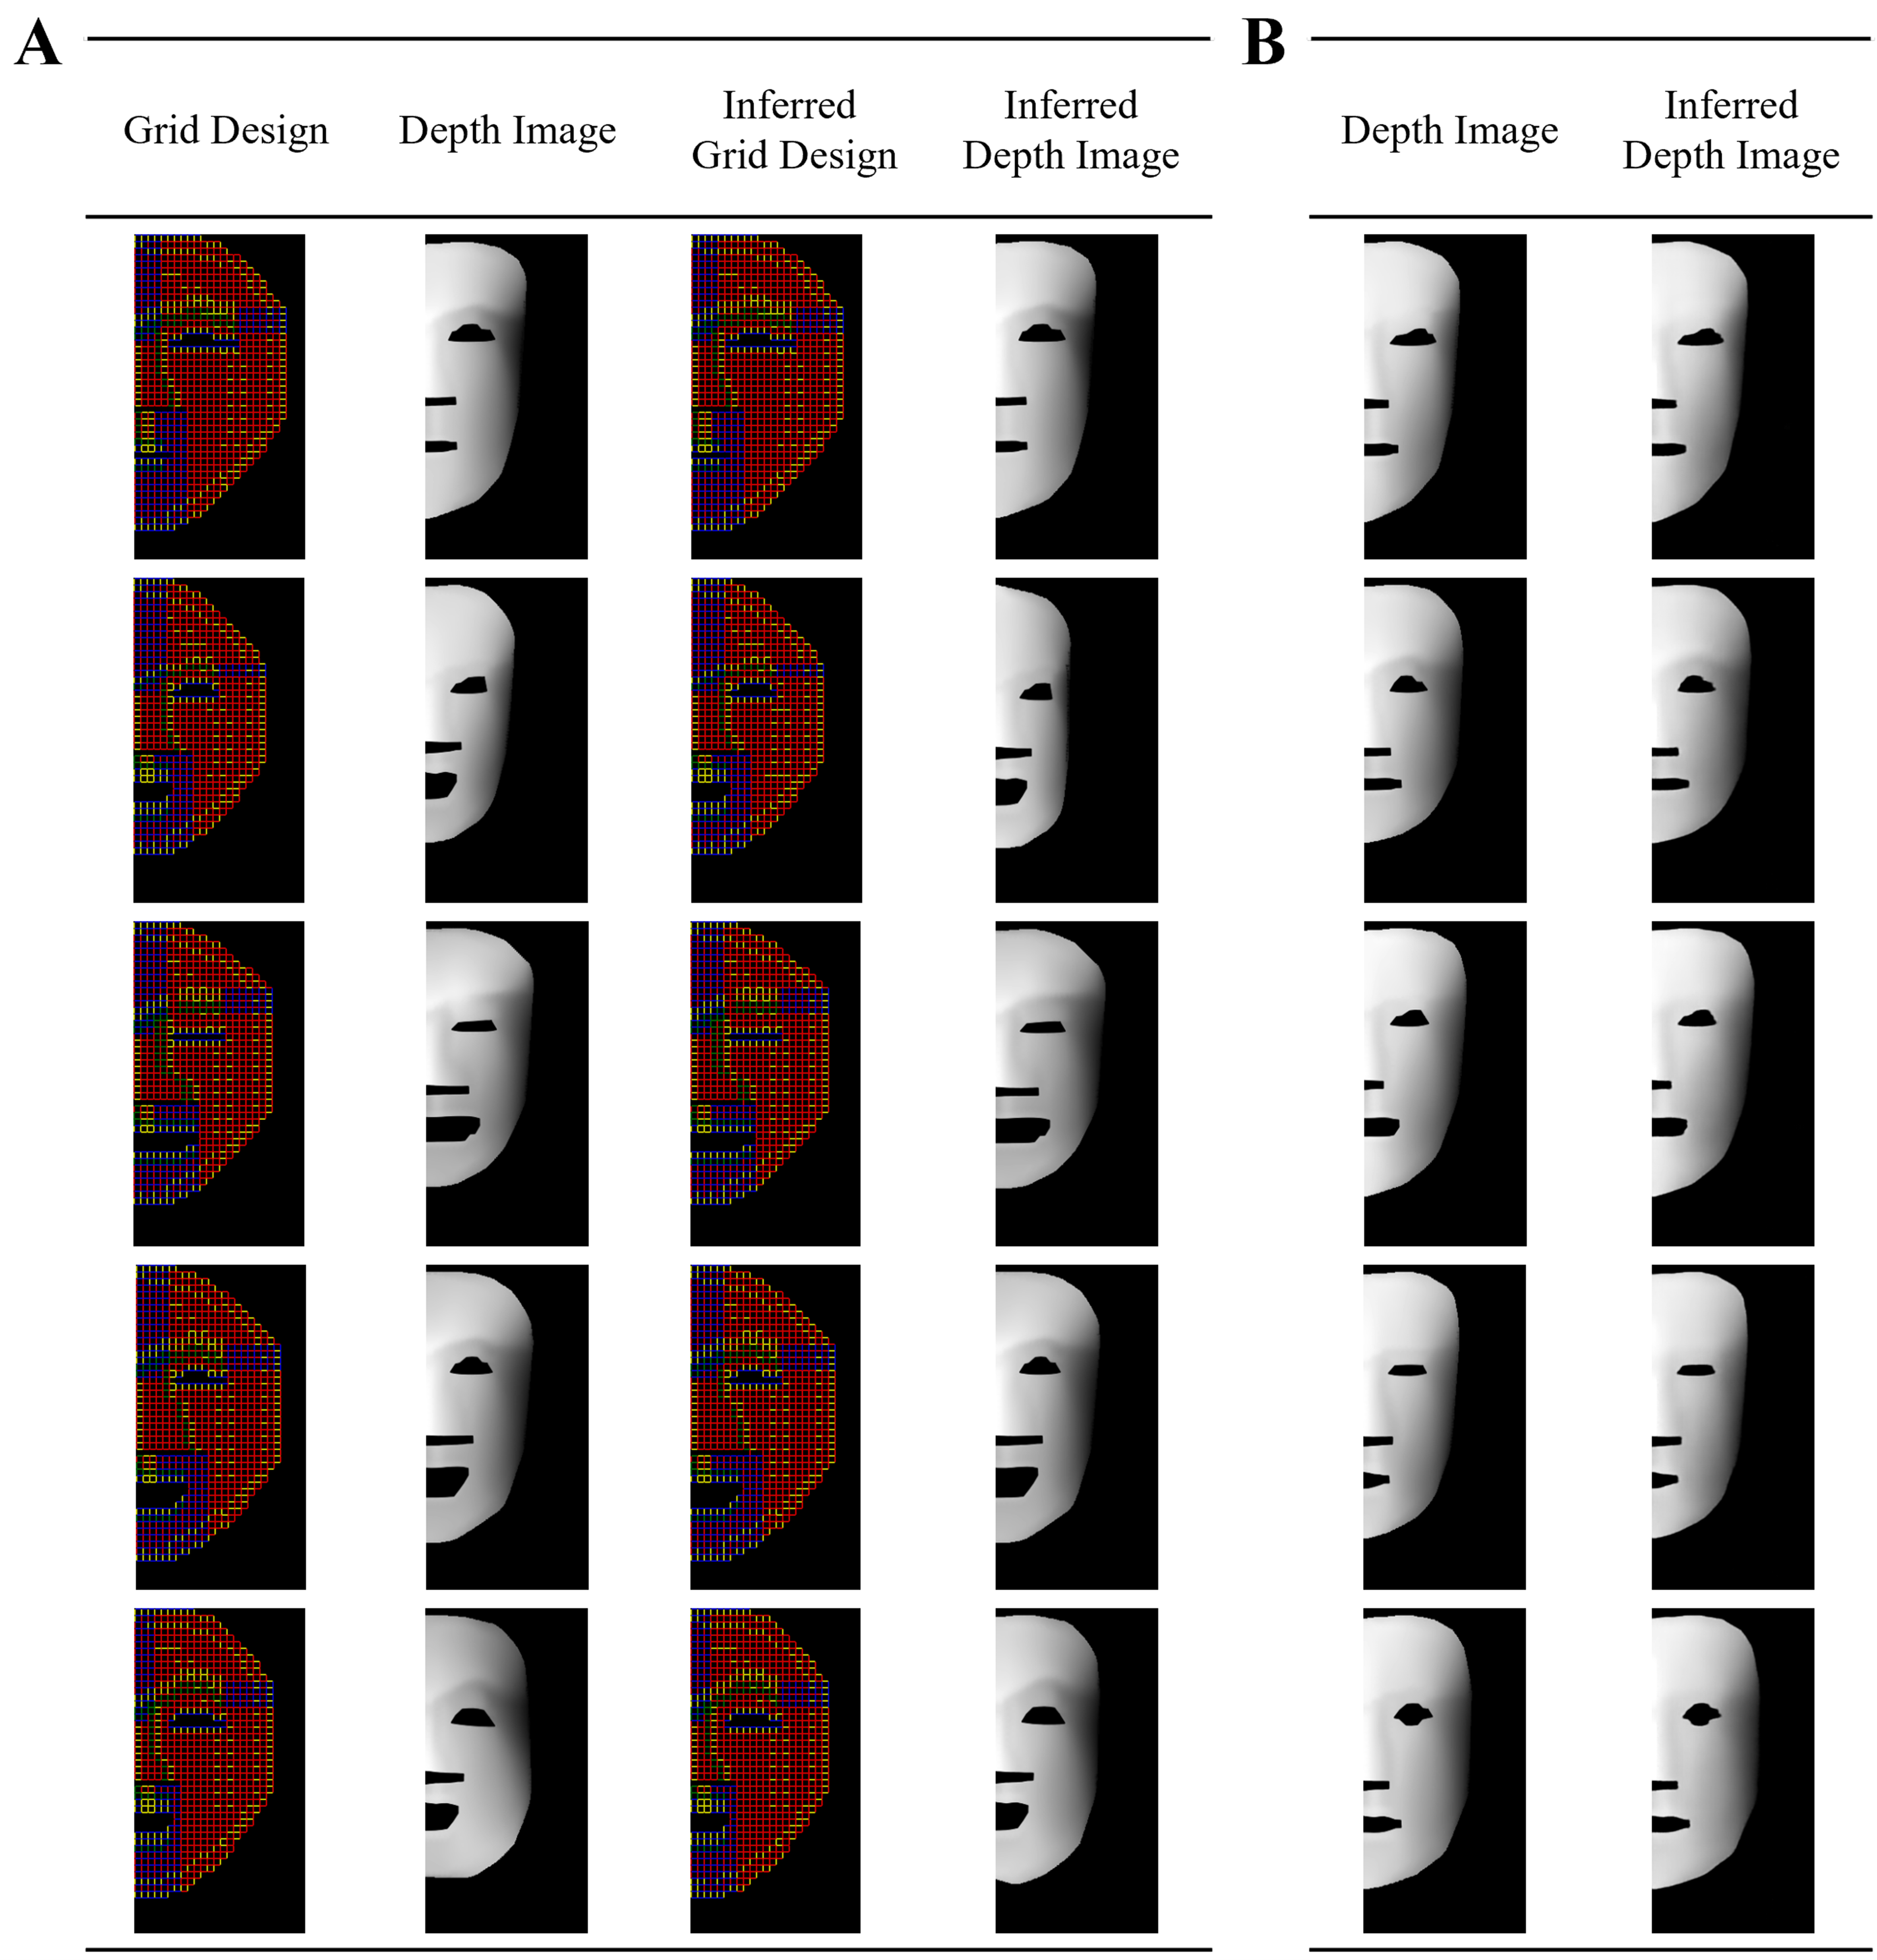
Figure 5. (A) Inverse design: The grid design undergoes FEA and data processing to generate a depth image, which is then input into the model to predict the corresponding grid design. The inferred design is again processed through FEA and data processing to obtain the inferred depth image; (B) Forward prediction: The grid design is converted into image format for convolution operations, allowing the FCN to replace traditional FEA and data processing. FEA: Finite element analysis; FCN: fully convolutional network.
In the forward prediction task, we randomly selected samples to compare the ground truth depth image with the inferred depth image [Figure 5B]. On the test set of 3,609 samples, the FCN performing pixel-wise regression achieved a mean SSIM of 0.9624, a median SSIM of 0.9727, and a standard deviation of 0.0338
In the curve matrix inverse design, we randomly selected samples to demonstrate the progression from the rib design to the depth image, then to the inferred rib design, and finally to the inferred depth image [Figure 6A]. Additionally, we included these five samples for both the simulation and the inferred simulation [Figure 6B]. The number of test samples was decreased from 1,336 to 1,278 due to non-convergence in the simulation and incomplete output from Ansys Workbench. For the rib design, the accuracy has a mean of 0.9732, with a median of 1 and a standard deviation of 0.0424 [Supplementary Table 6]. This indicates that only one of the 33 rib locations was predicted incorrectly, and the incorrect material configuration was only one level away from the correct one. The angular MAE attained a mean of 3.3270, a median of 2.9394, and a standard deviation of only 2.1921, indicating a mean angle design error of approximately 3 degrees across the 33 ribs. For evaluating the similarity of depth images, SSIM has a mean of 0.9839, a median of 0.9909, and a standard deviation of 0.0275. Meanwhile, NCC shows a mean of 0.9861, a median of 0.9979, and a standard deviation of 0.0545. A detailed analysis shows that in the test set, 710 samples have an accuracy of 1, meaning that 53.1% of the samples perfectly predict the material design corresponding to the depth image. Given the complexity of the inverse design process, we found that an FCN coupled with a lightweight ResNet-18 encoder and GradNorm algorithm was sufficient to achieve accurate, stable performance. This demonstrates that FCN-based architectures can effectively handle 4D printing design problems without requiring excessively deep or computationally intensive models.
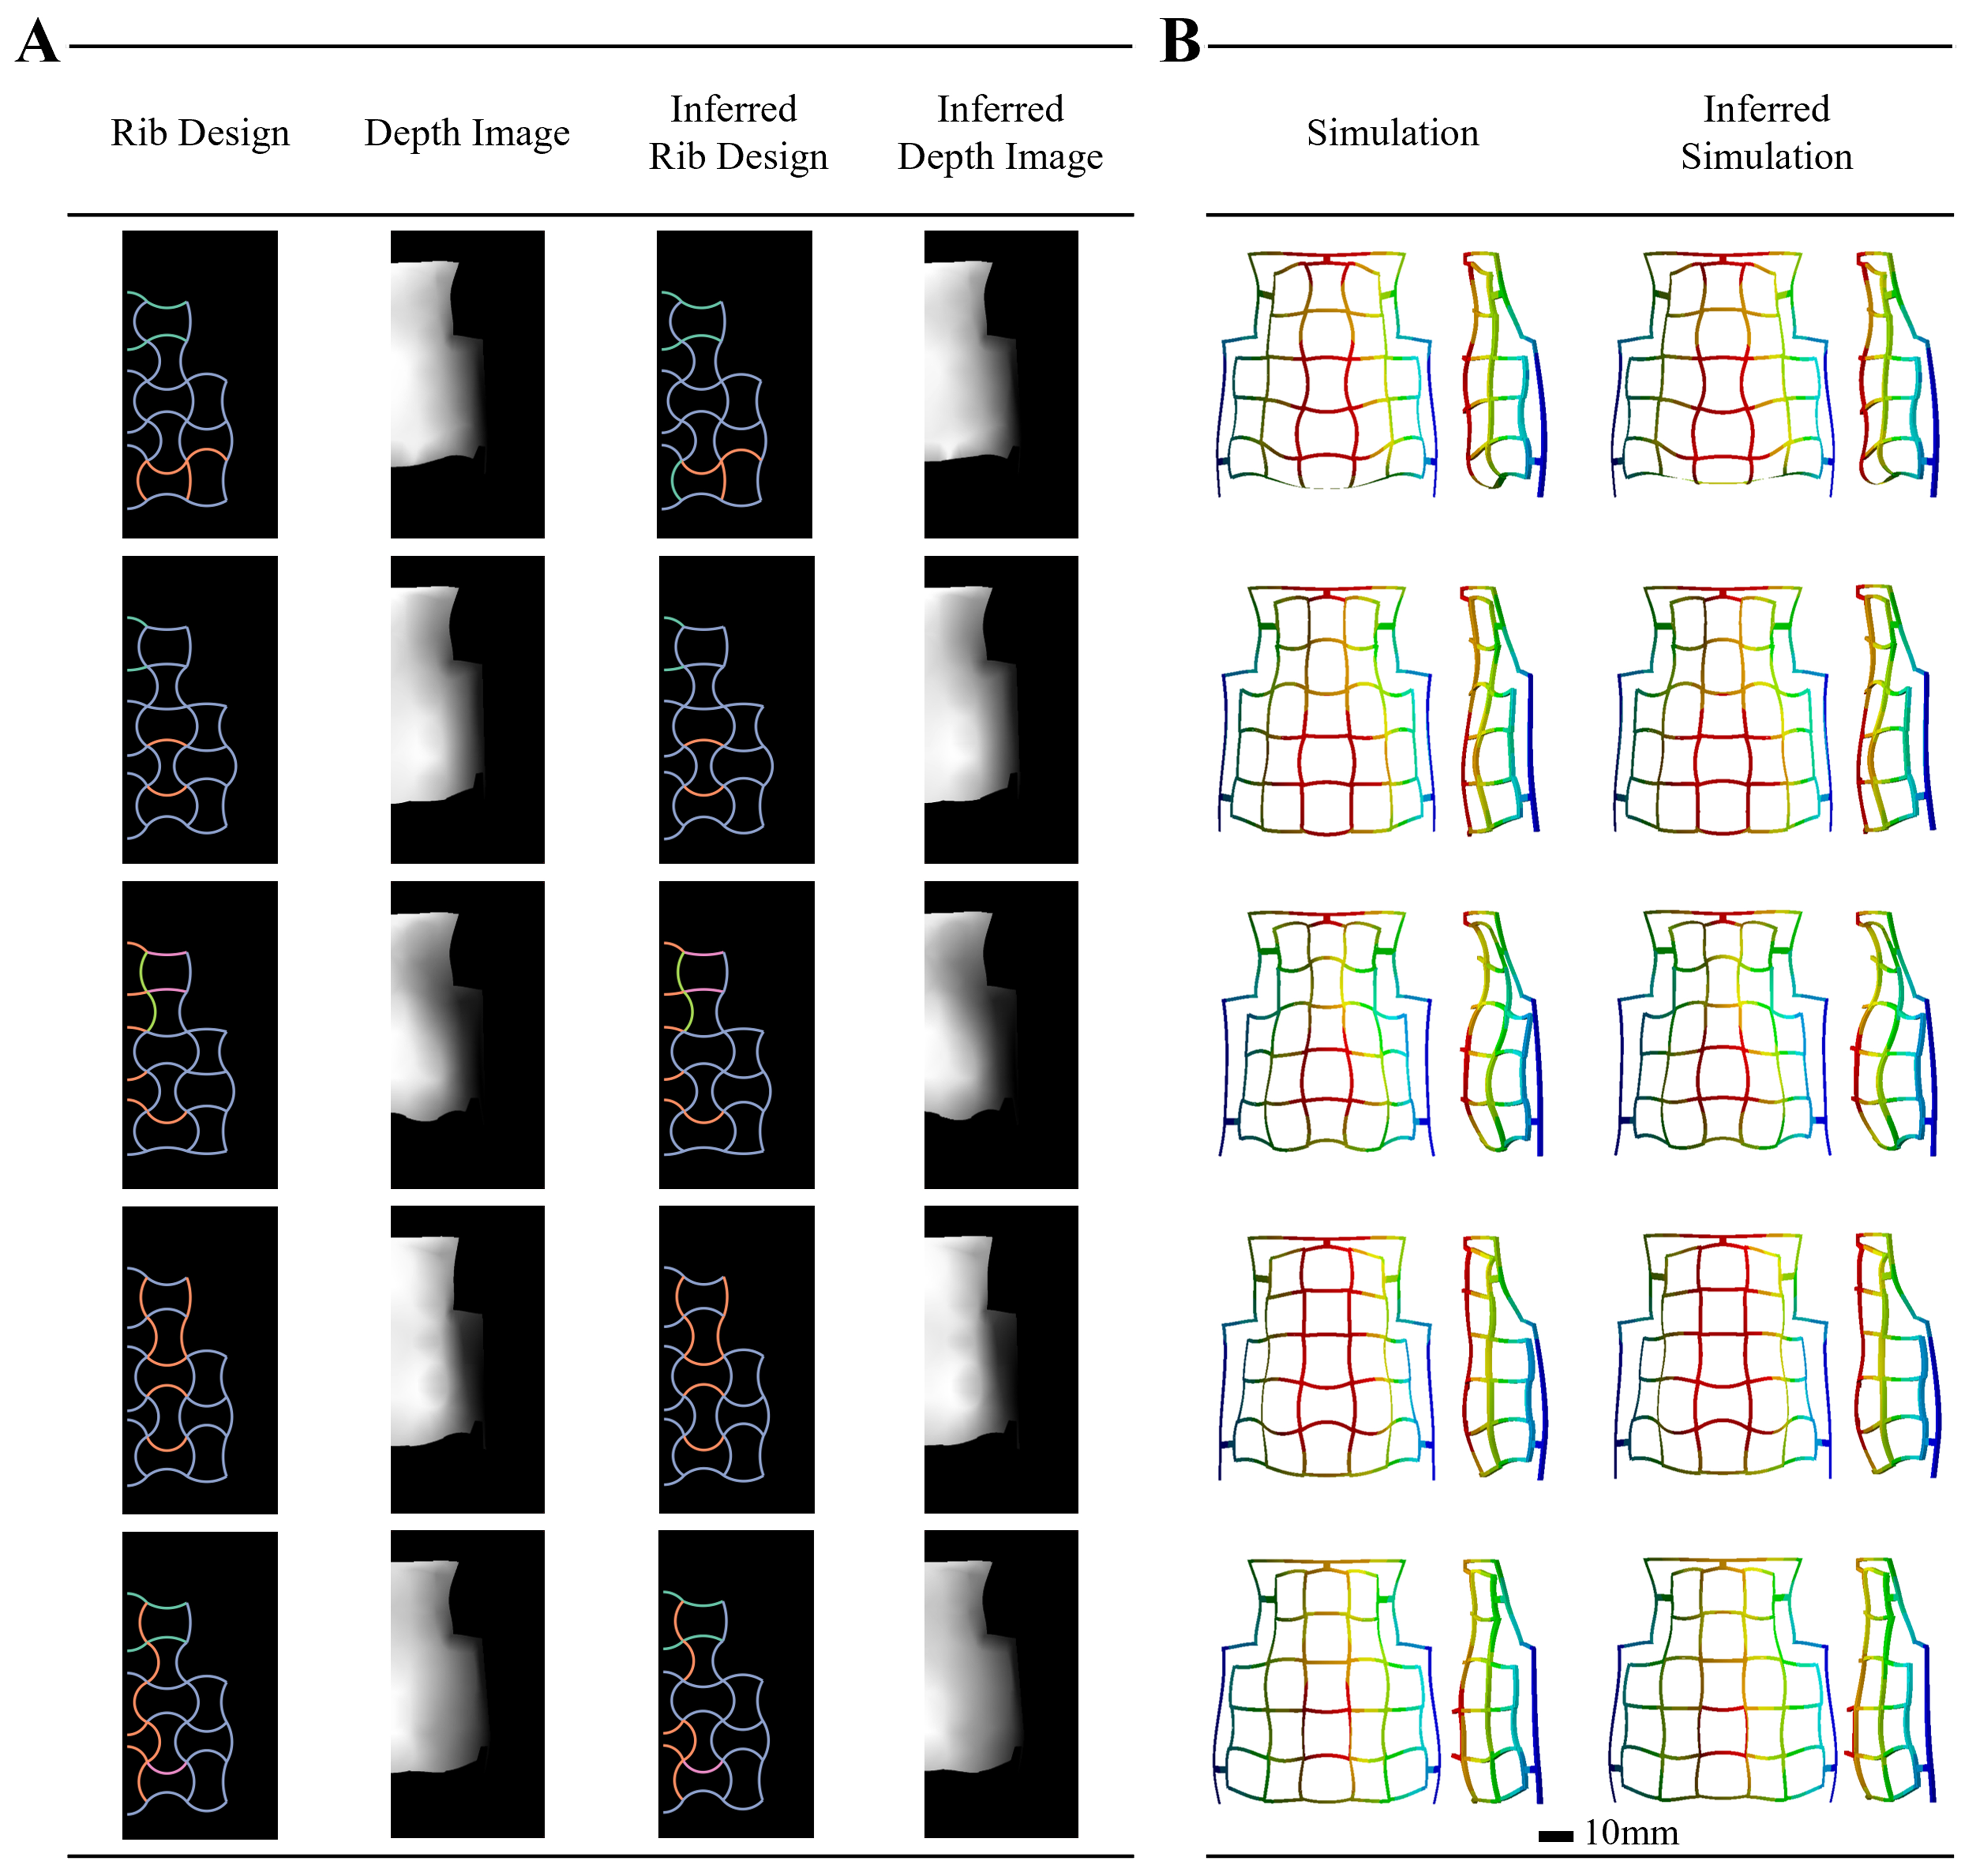
Figure 6. (A) Rib design transformed into a depth image via FEA and data preprocessing, then used to generate the inferred design. The inferred design is processed again to obtain the corresponding inferred depth image; (B) Comparative analysis of ground truth and predicted thin-shell geometries. FEA: Finite element analysis.
Transfer learning on actual facial data
The filtered RANDOM dataset was split into a test set of 2,138 samples, while the remaining data were divided into a training set of 17,311 samples and a validation set of 1,924 samples. Samples were excluded when the simulation process failed to converge, the grid design was non-closed, or ANSYS Workbench provided incomplete node information, as these issues hindered the generation of inferred depth images. We utilize nine models [Supplementary Tables 7-9] created with combinations of three learning rates and three batch sizes to improve the success rate of inferred depth image generation. Although there are some unclosed grids in the inferred grid design, we manually adjust these grid units to form closed grid designs, simulate the manually inferred grid design, and process the node results into an inferred depth image [Figure 7]. We selected the inferred depth image with the highest combined SSIM and NCC values for each target shape, along with its model hyperparameters and simulation results [Supplementary Figure 43], as the final inverse design result for that target shape.
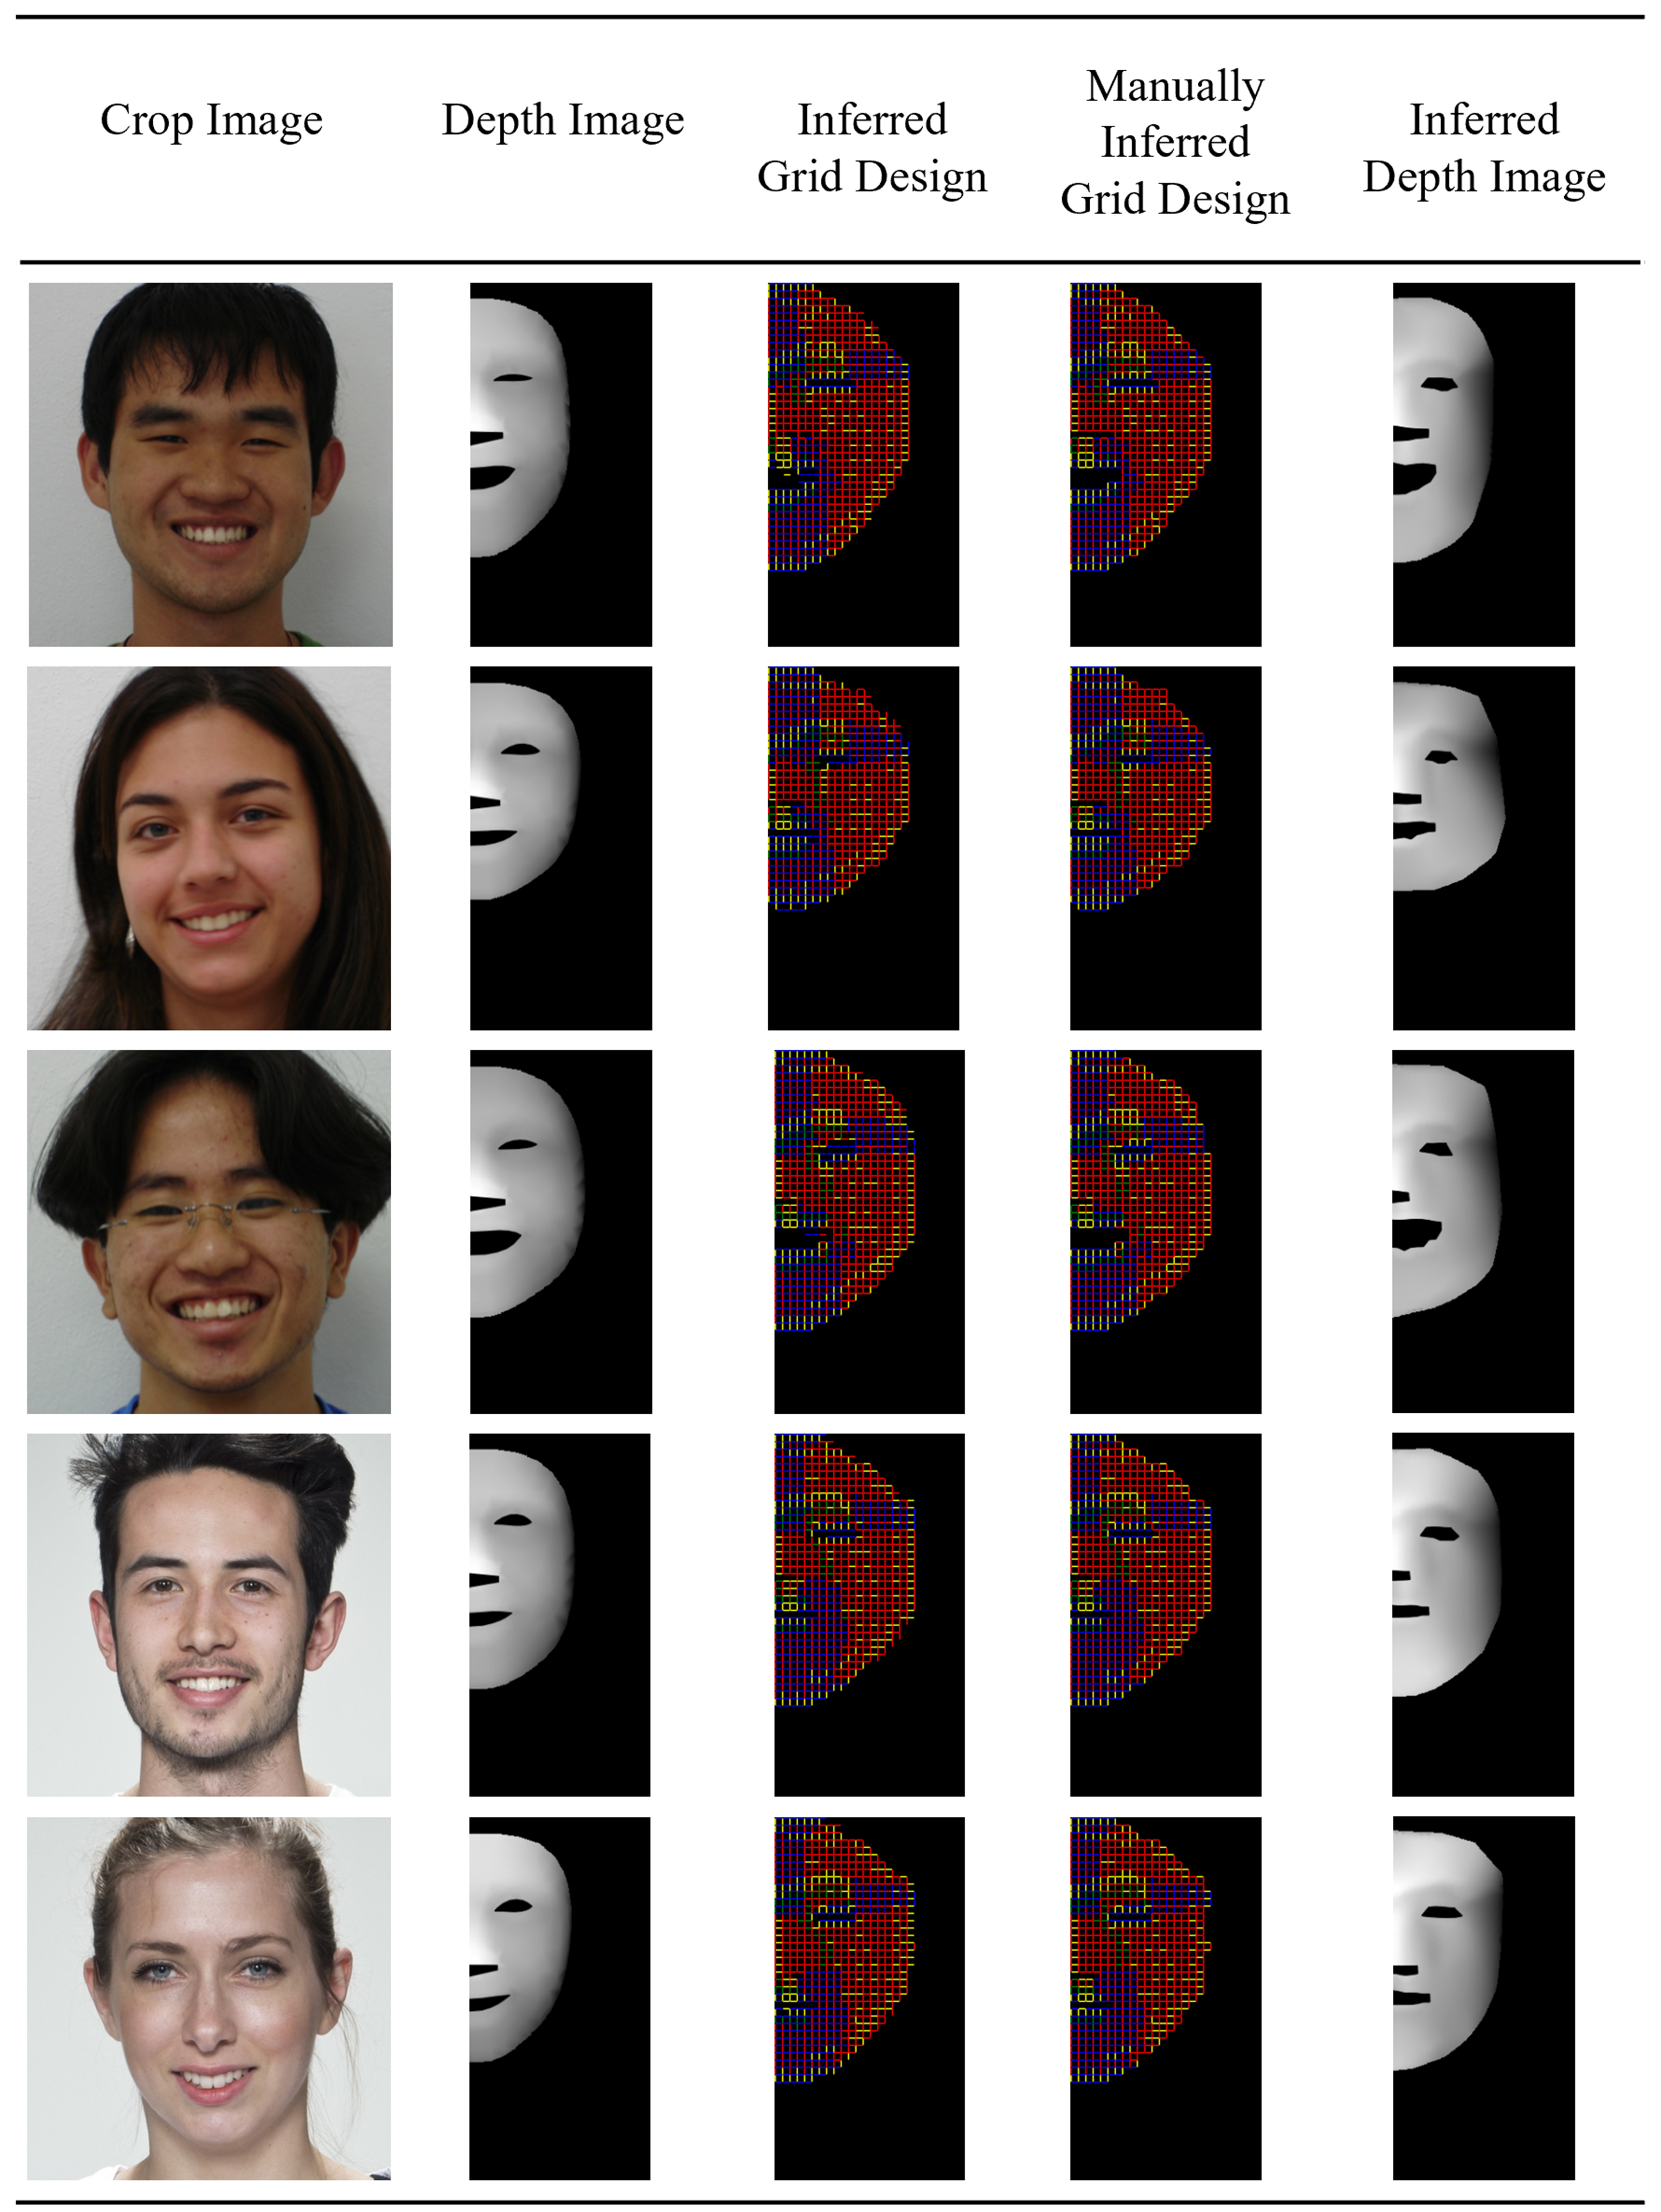
Figure 7. The FCN was trained on the filtered RANDOM dataset and applied transfer learning to actual facial data. The inverse design process proceeds from the RGB image to the depth image, then to the inferred grid design, the manually adjusted grid design, and finally the inferred depth image. FCN: Fully convolutional network; RGB: Red, Green, and Blue.
Out of 195 facial samples, successful results were obtained in 134 cases. The SSIM exhibited a mean of 0.8913, a median of 0.8949, and a standard deviation of 0.0288, indicating a high degree of structural similarity with minimal variation across the images. Most SSIM values fell within the range of 0.8288 to 0.9490, further reflecting the overall consistency and quality of the reconstructed depth images
Statistical analysis of facial features
We analyzed facial feature scales between RANDOM and REAL, including eye height, eye width, nostril width, mouth width, face width, and face length [Supplementary Figure 46]. Although the mean values for most features of the RANDOM are slightly higher than those of REAL, the data range of the RANDOM fully encompasses the variability in REAL. The only notable difference is in face height, with the RANDOM exhibiting a higher mean and broader range than the REAL, clearly reflecting a forehead height difference in the depth images. However, focusing only on the lower face height from the eyes to the chin reveals that the range in RANDOM still includes the variation in REAL. Only the nose, philtrum, mouth, and chin in RANDOM contribute to a slightly higher overall mean face height than in REAL.
Since the model used for inferring REAL was trained on the RANDOM, the length of the inferred grid design is likely to be close to the scale of the RANDOM mask. To mitigate the risk of overfitting, we introduced a dropout hyperparameter to enhance the model’s generalization capability[70] and analyze the effects of various dropout settings on the inferred grid design [Supplementary Figure 47]. Without dropout, the model fails to adequately adjust the nose, philtrum, and mouth regions based on the geometric features in the depth images, leading to inaccurate mask scales and irregular material arrangements. In contrast, the inferred grid design with dropout makes a more regular material configuration, and the scale of the shell is more accurate. Notably, when the dropout is set to 0.3, the number of unclosed grids in the mask opening is significantly reduced, minimizing the need for manual adjustments to achieve a closed grid design.
To validate whether the nose shell created in this study accurately reflects the morphological diversity of human noses, we conducted a comparative analysis against anthropometric measurements of the human nose[71-73]. Measurements of six nasal indicators - namely, nasal height, nasal length, nasal tip protrusion, nasal root width, nasal width, and nasal tip angle - were conducted on 146 curve matrix samples
Depth deviation analysis
To accurately quantify the discrepancy between simulated and experimental shells, we improved the previous 3D deviation analysis[45]. First, the experimental shell was scanned to obtain a 3D point cloud, and the iterative closest point (ICP) algorithm[74,75] was used to align the scanned point cloud with the simulated nodes. After the alignment, the simulated nodes were interpolated to create a continuous surface in the depth image. The K-Dimensional Tree (KD-Tree) was used to find the nearest interpolated point for each scanned point in the XY plane. The vertical deviation is calculated by subtracting the z-value of the interpolated point from that of the scanned point. This analysis presents a detailed evaluation of the vertical error between the simulated and experimental shells, which are visualized as a colormap overlaid on the depth image. Note that a positive deviation indicates that the scanned point lies above the interpolated point, whereas a negative deviation indicates it lies below. In the mask shell [Figure 8A], there is considerable similarity across the three cases, with the larger deviations primarily occurring in the peripheral regions of the face. From top to bottom, the deviation patterns in the first and second samples exhibit general characteristics commonly observed in typical cases. In contrast, the third sample demonstrates significantly greater deformation in the experimental shell compared to the simulation, resulting in obvious curling of the cheek regions and a noticeably narrower overall width. A statistical analysis of three samples, based on 531, 450, and 501 scanned points, revealed mean absolute deviations of 6.52, 3.52, and 6.27 mm [Supplementary Table 12]. For the simulated masks with heights of 80.913, 70.103, and 60.234 mm, the mean deviations were 8%, 5%, and 10% of the total height, respectively.
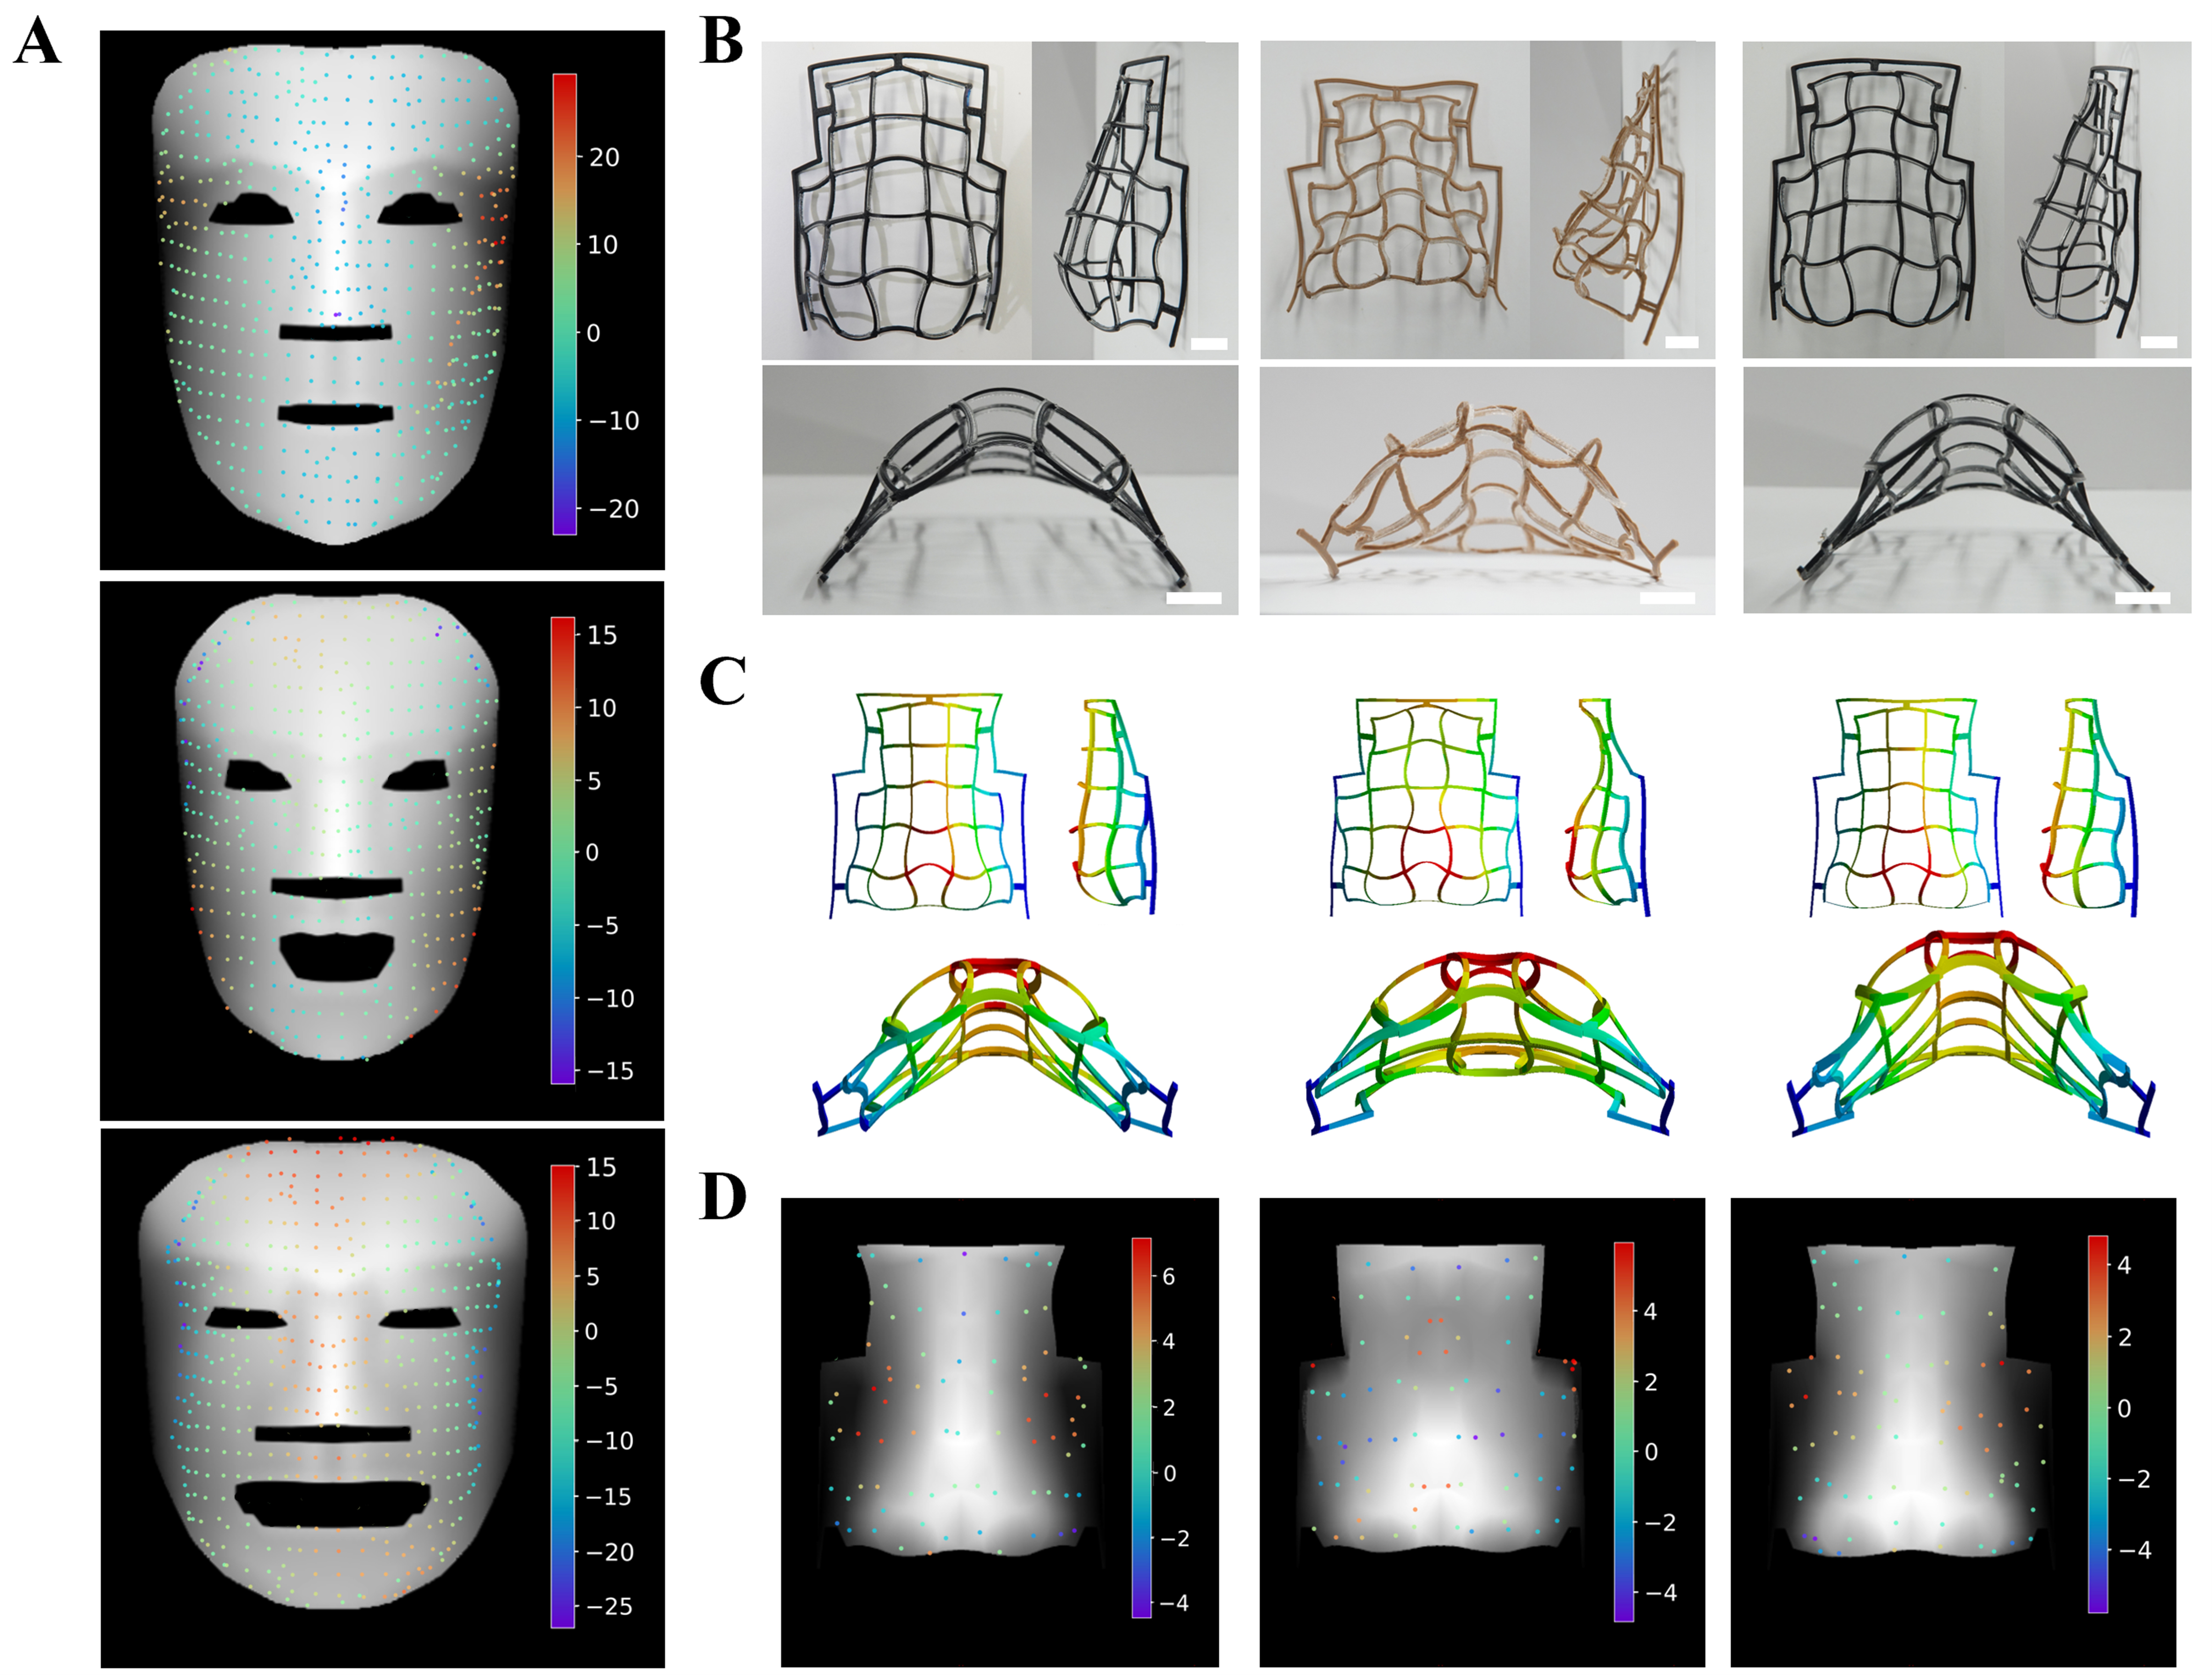
Figure 8. (A) Z-direction deviation between experimental points and simulated nodes in mask shells, with scanned experimental points visualized using a colormap (units: mm); (B) Experimental results presented from multiple viewing angles, with a 10 mm scale bar. The transparent color corresponds to the SMP material, while the black and brown colors represent PLA; (C) Simulated results for the curved matrix shell from front, side, and bottom views, with a 10 mm scale bar; (D) Z-direction deviation between experimental points and simulated nodes in the curve matrix shell, with experimental points visualized using a colormap (units: mm). SMP: Shape memory polymer; PLA: polylactic acid.
We compared the experimental [Figure 8B] and simulated nose shells [Figure 8C] from the front, side, and bottom views. The same z-direction deviation analysis was applied to three samples [Figure 8D]. According to the statistical results, the three samples contained 80, 78, and 75 scanned points, respectively. The mean absolute deviations were 2.62, 2.60, and 1.72 mm [Supplementary Table 13]. For the simulated shells with heights of 27.5, 30.5, and 26.4 mm, these deviations corresponded to 9%, 8%, and 6% of the total height, respectively.
CONCLUSION
The planar curve matrix, constructed from stacked PLA and SMP materials with ribs of varying curvatures, demonstrated reliable shape-morphing performance. Upon thermal activation, the 2D curve matrix consistently transformed into a 3D nasal shell, validating the feasibility of the design strategy. For inverse design, the FCN enabled rapid and precise 3D reconstruction across two design frameworks, allowing for the inverse design of the curve matrix and line matrix using a single depth image. Notably, inverse design in 4D printing allows scalable fabrication of thin-shell structures while minimizing material waste.
The FCN demonstrated its versatility by successfully performing three distinct tasks beyond conventional image segmentation. First, by utilizing single-task learning along with transfer learning on real facial data, it effectively generated the necessary grid configurations. Second, through multi-task learning, the model was able to infer rib configurations for complex geometries. Finally, it provided accurate forward predictions of 3D structures based on the grid designs.
Furthermore, the fabricated mask and nasal thin-shell structures not only matched realistic anthropometric dimensions but also exhibited mean deviations of less than 10% relative to height between simulations and experiments. This highlights both the morphological accuracy of the designs and the consistency of the fabrication process.
DECLARATIONS
Author’s contributions
Conceptualization, methodology, investigation, formal analysis, software, data curation, validation, visualization, writing - original draft, review and editing: Chen, M. C.
Methodology, investigation, formal analysis, software: Li, Y. C.
Investigation, data curation, visualization: Yu, Y. Y.
Conceptualization: Huang, Y. T.
Investigation, formal analysis, software: Chen, Y. H.
Investigation, formal analysis, software: Hou, P. L.
Methodology, investigation: Tai, Y. C.
Conceptualization, funding acquisition, methodology, project administration, resources, supervision, writing - review and editing: Juang, J. Y.
Availability of data and materials
Utilizing 1,270 facial images (hereinafter called REAL) from three publicly available facial databases: 666 images from the Chicago Face Database (https://www.chicagofaces.org/)[47-49], 400 from the FEI Face Database (https://fei.edu.br/~cet/facedatabase.html)[50], and 204 from the London Face Research Laboratory (https://figshare.com/articles/dataset/Face_Research_Lab_London_Set/5047666)[51].
Financial support and sponsorship
This work is supported by the National Science and Technology Council (NSTC) of Taiwan (113-2221-E-002-109-MY3, 113-2813-C-002-202-E) and National Taiwan University (114L895304).
Conflicts of interest
All authors declared that there are no conflicts of interest.
Ethical approval and consent to participate
The facial images presented were obtained from the FEI Face Database, which was collected under the supervision of Dr. Carlos E. Thomaz, Head of the Image Processing Laboratory (IPL), Department of Electrical Engineering, Centro Universitário da FEI, São Bernardo do Campo, Brazil. According to the information provided by the database creators, all participants gave informed consent to participate in the image acquisition process.
Consent for publication
The publication of the images presented was approved by the creators of the FEI Face Database.
Copyright
© The Author(s) 2025.
Supplementary Materials
REFERENCES
1. Bischoff, M.; Bletzinger, K. U.; Wall, W. A.; Ramm, E. Models and finite elements for thin-walled structures. In: Stein E, Borst R, Hughes TJR, editors. Encyclopedia of Computational Mechanics. Wiley; 2004.
2. Loughlan, J. Thin-walled structures: advances in research, design and manufacturing technology. 1st edition. CRC Press; 2018.
3. Chen, D.; Gao, K.; Yang, J.; Zhang, L. Functionally graded porous structures: analyses, performances, and applications - a review. Thin. Walled. Struct. 2023, 191, 111046.
4. Ren, R.; Ma, X.; Yue, H.; Yang, F.; Lu, Y. Stiffness enhancement methods for thin-walled aircraft structures: a review. Thin. Walled. Struct. 2024, 201, 111995.
5. Azanaw, G. M. Thin-walled structures in structural engineering: a comprehensive review of design innovations, stability challenges, and sustainable frontiers. Am. J. Mater. Synth. Process. 2025, 10, 18-26.
6. Wan, X.; Xiao, Z.; Tian, Y.; et al. Recent advances in 4D printing of advanced materials and structures for functional applications. Adv. Mater. 2024, 36, e2312263.
7. Yarali, E.; Mirzaali, M. J.; Ghalayaniesfahani, A.; Accardo, A.; Diaz-Payno, P. J.; Zadpoor, A. A. 4D printing for biomedical applications. Adv. Mater. 2024, 36, e2402301.
8. Kuang, X.; Roach, D. J.; Wu, J.; et al. Advances in 4D printing: materials and applications. Adv. Funct. Mater. 2019, 29, 1805290.
9. Khoo, Z. X.; Teoh, J. E. M.; Liu, Y.; et al. 3D printing of smart materials: a review on recent progresses in 4D printing. Virt. Phys. Prototyping. 2015, 10, 103-22.
10. Jin, B.; Liu, J.; Shi, Y.; Chen, G.; Zhao, Q.; Yang, S. Solvent-assisted 4D programming and reprogramming of liquid crystalline organogels. Adv. Mater. 2022, 34, e2107855.
11. Yang, Y.; Wang, Y.; Lin, M.; Liu, M.; Huang, C. Bio-inspired facile strategy for programmable osmosis-driven shape-morphing elastomer composite structures. Mater. Horiz. 2024, 11, 2180-90.
12. Khalid, M. Y.; Otabil, A.; Mamoun, O. S.; Askar, K.; Bodaghi, M. Transformative 4D printed SMPs into soft electronics and adaptive structures: innovations and practical insights. Adv. Mater. Technol. 2025, 10, e00309.
13. Liu, B.; Li, H.; Meng, F.; et al. 4D printed hydrogel scaffold with swelling-stiffening properties and programmable deformation for minimally invasive implantation. Nat. Commun. 2024, 15, 1587.
14. Zhang, L.; Huang, X.; Cole, T.; et al. 3D-printed liquid metal polymer composites as NIR-responsive 4D printing soft robot. Nat. Commun. 2023, 14, 7815.
15. Soleimanzadeh, H.; Bodaghi, M.; Jamalabadi, M.; Rolfe, B.; Zolfagharian, A. Rotary 4D printing of programmable metamaterials on sustainable 4D mandrel. Adv. Mater. Technol. 2025, e01581.
16. Yan, Z.; Zhang, F.; Wang, J.; et al. Controlled mechanical buckling for origami-inspired construction of 3D microstructures in advanced materials. Adv. Funct. Mater. 2016, 26, 2629-39.
17. Yang, X.; Liu, M.; Zhang, B.; et al. Hierarchical tessellation enables programmable morphing matter. Matter 2024, 7, 603-19.
18. Nojoomi, A.; Arslan, H.; Lee, K.; Yum, K. Bioinspired 3D structures with programmable morphologies and motions. Nat. Commun. 2018, 9, 3705.
19. Arslan, H.; Nojoomi, A.; Jeon, J.; Yum, K. 3D printing of anisotropic hydrogels with bioinspired motion. Adv. Sci. 2019, 6, 1800703.
20. Boley, J. W.; van Ree, W. M.; Lissandrello, C.; et al. Shape-shifting structured lattices via multimaterial 4D printing. Proc. Natl. Acad. Sci. U. S. A. 2019, 116, 20856-62.
21. Sun, X.; Yue, L.; Yu, L.; et al. Machine learning-enabled forward prediction and inverse design of 4D-printed active plates. Nat. Commun. 2024, 15, 5509.
22. Chiu, Y. H.; Liao, Y. H.; Juang, J. Y. Designing bioinspired composite structures via genetic algorithm and conditional variational autoencoder. Polymers 2023, 15, 281.
23. Jin, L.; Yu, S.; Cheng, J.; et al. Machine learning driven forward prediction and inverse design for 4D printed hierarchical architecture with arbitrary shapes. Appl. Mater. Today. 2024, 40, 102373.
24. Sun, X.; Yue, L.; Yu, L.; et al. Machine learning-evolutionary algorithm enabled design for 4D-printed active composite structures. Adv. Funct. Mater. 2022, 32, 2109805.
25. Athinarayanarao, D.; Prod’hon, R.; Chamoret, D.; et al. Computational design for 4D printing of topology optimized multi-material active composites. npj. Comput. Mater. 2023, 9, 962.
26. Bai, Y.; Wang, H.; Xue, Y.; et al. A dynamically reprogrammable surface with self-evolving shape morphing. Nature 2022, 609, 701-8.
27. Yang, X.; Zhou, Y.; Zhao, H.; et al. Morphing matter: from mechanical principles to robotic applications. Soft. Sci. 2023, 3, 38.
28. Ni, X.; Luan, H.; Kim, J. T.; et al. Soft shape-programmable surfaces by fast electromagnetic actuation of liquid metal networks. Nat. Commun. 2022, 13, 5576.
29. Wang, X.; Guo, X.; Ye, J.; et al. Freestanding 3D mesostructures, functional devices, and shape-programmable systems based on mechanically induced assembly with shape memory polymers. Adv. Mater. 2019, 31, e1805615.
30. Tong, D.; Hao, Z.; Liu, M.; Huang, W. Inverse design of snap-actuated jumping robots powered by mechanics-aided machine learning. IEEE. Robot. Autom. Lett. 2025, 10, 1720-7.
31. Bodaghi, M.; Namvar, N.; Yousefi, A.; Teymouri, H.; Demoly, F.; Zolfagharian, A. Metamaterial boat fenders with supreme shape recovery and energy absorption/dissipation via FFF 4D printing. Smart. Mater. Struct. 2023, 32, 095028.
32. Jolaiy, S.; Yousefi, A.; Hosseini, M.; Zolfagharian, A.; Demoly, F.; Bodaghi, M. Limpet-inspired design and 3D/4D printing of sustainable sandwich panels: pioneering supreme resiliency, recoverability and repairability. Appl. Mater. Today. 2024, 38, 102243.
33. Zolfagharian, A.; Jarrah, H. R.; Xavier, M. S.; Rolfe, B.; Bodaghi, M. Multimaterial 4D printing with a tunable bending model. Smart. Mater. Struct. 2023, 32, 065001.
34. Nojoomi, A.; Jeon, J.; Yum, K. 2D material programming for 3D shaping. Nat. Commun. 2021, 12, 603.
35. Ahn, S. J.; Byun, J.; Joo, H. J.; Jeong, J. H.; Lee, D. Y.; Cho, K. J. 4D printing of continuous shape representation. Adv. Mater. Technol. 2021, 6, 2100133.
36. Kansara, H.; Liu, M.; He, Y.; Tan, W. Inverse design and additive manufacturing of shape-morphing structures based on functionally graded composites. J. Mech. Phys. Solids. 2023, 180, 105382.
37. Yun, S.; Ahn, Y.; Kim, S. Tailoring elastomeric meshes with desired 1D tensile behavior using an inverse design algorithm and material extrusion printing. Addit. Manuf. 2022, 60, 103254.
38. Zheng, X.; Zhang, X.; Chen, T. T.; Watanabe, I. Deep learning in mechanical metamaterials: from prediction and generation to inverse design. Adv. Mater. 2023, 35, e2302530.
39. Chen, C. T.; Gu, G. X. Generative deep neural networks for inverse materials design using backpropagation and active learning. Adv. Sci. 2020, 7, 1902607.
40. Chen, C. T.; Gu, G. X. Physics-informed deep-learning for elasticity: forward, inverse, and mixed problems. Adv. Sci. 2023, 10, e2300439.
41. Wang, R.; Peng, X.; Wang, X.; Wu, C.; Liang, X.; Wu, W. DM net: a multiple nonlinear regression net for the inverse design of disordered metamaterials. Addit. Manuf. 2024, 96, 104577.
42. Mohammadi, M.; Kouzani, A. Z.; Bodaghi, M.; et al. Sustainable robotic joints 4D printing with variable stiffness using reinforcement learning. Robotics. Comput. Integr. Manuf. 2024, 85, 102636.
43. Mohammadi, M.; Kouzani, A. Z.; Bodaghi, M.; Zolfagharian, A. Inverse design of adaptive flexible structures using physical-enhanced neural network. Virtual. Phys. Prototyp. 2025, 20, e2530732.
44. Cheng, X.; Fan, Z.; Yao, S.; et al. Programming 3D curved mesosurfaces using microlattice designs. Science 2023, 379, 1225-32.
45. Chiu, Y.; Huang, Y.; Chen, M.; Xu, Y.; Yen, Y.; Juang, J. Inverse design of face-like 3D surfaces via bi-material 4D printing and shape morphing. Virt. Phys. Prototyping. 2025, 20, e2507099.
46. Bodaghi, M.; Damanpack, A. R.; Liao, W. H. Triple shape memory polymers by 4D printing. Smart. Mater. Struct. 2018, 27, 065010.
47. Ma, D. S.; Correll, J.; Wittenbrink, B. The Chicago face database: a free stimulus set of faces and norming data. Behav. Res. Methods. 2015, 47, 1122-35.
48. Ma, D. S.; Kantner, J.; Wittenbrink, B. Chicago face database: multiracial expansion. Behav. Res. Methods. 2021, 53, 1289-300.
49. Lakshmi, A.; Wittenbrink, B.; Correll, J.; Ma, D. S. The India face set: international and cultural boundaries impact face impressions and perceptions of category membership. Front. Psychol. 2021, 12, 627678.
50. Thomaz, C. E.; Giraldi, G. A. A new ranking method for principal components analysis and its application to face image analysis. Image. Vis. Comput. 2010, 28, 902-13.
51. DeBruine, L.; Jones, B. Face research lab london set. 2021. https://figshare.com/articles/dataset/Face_Research_Lab_London_Set/5047666. (accessed 2025-11-11).
53. Ma, L.; Tan, T.; Wang, Y.; Zhang, D. Efficient iris recognition by characterizing key local variations. IEEE. Trans. Image. Process. 2004, 13, 739-50.
54. Bashkatov, A. N.; Koblova, E. V.; Bakutkin, V. V.; Genina, E. A.; Savchenko, E. P.; Tuchin, V. V. Estimation of melanin content in iris of human eye. In Ophthalmic Technologies XV. SPIE; 2005. pp. 302-11.
55. Iyamu, E.; Osuobeni, E. Age, gender, corneal diameter, corneal curvature and central corneal thickness in Nigerians with normal intra ocular pressure. J. Optomm. 2012, 5, 87-97.
57. Mohammed, S.; Budach, L.; Feuerpfeil, M.; et al. The effects of data quality on machine learning performance on tabular data. Inf. Syst. 2025, 132, 102549.
58. Vaswani, A.; Shazeer, N.; Parmar, N.; et al. Attention is all you need. arXiv 2017, arXiv:1706.03762. Available online: https://doi.org/10.48550/arXiv.1706.03762. (accessed 11 Nov 2025).
59. Lin, K.; Zhao, Y.; Zhou, T.; et al. Applying machine learning to fine classify construction and demolition waste based on deep residual network and knowledge transfer. Environ. Dev. Sustain. 2023, 25, 8819-36.
61. Mitteroecker, P.; Gunz, P.; Windhager, S.; Schaefer, K. A brief review of shape, form, and allometry in geometric morphometrics, with applications to human facial morphology. Hystrix 2013, 24, 59-66.
62. He, K.; Zhang, X.; Ren, S.; Sun, J. Deep residual learning for image recognition. In 2016 IEEE Conference on Computer Vision and Pattern Recognition (CVPR), Las Vegas, USA. June 27-30, 2016. IEEE; 2016. pp. 770-8.
63. Chen, Z.; Badrinarayanan, V.; Lee, C. Y.; Rabinovich, A. GradNorm: gradient normalization for adaptive loss balancing in deep multitask networks. arXiv 2017, arXiv:1711.02257. Available online: https://doi.org/10.48550/arXiv.1711.02257. (accessed 11 Nov 2025).
64. Wang, Z.; Bovik, A. C.; Sheikh, H. R.; Simoncelli, E. P. Image quality assessment: from error visibility to structural similarity. IEEE. Trans. Image. Process. 2004, 13, 600-12.
65. Yoo, J.; Han, T. H. Fast normalized cross-correlation. Circuits. Syst. Signal. Process. 2009, 28, 819-43.
66. Radford, A.; Metz, L.; Chintala, S. Unsupervised representation learning with deep convolutional generative adversarial networks. arXiv 2015, arXiv:1511.06434. Available online: https://doi.org/10.48550/arXiv.1511.06434. (accessed 11 Nov 2025).
67. Kaelbling, L. P.; Littman, M. L.; Moore, A. W. Reinforcement learning: a survey. arXiv 1996, arXiv:cs/9605103. Available online: https://doi.org/10.48550/arXiv.cs/9605103. (accessed 11 Nov 2025).
68. Wiering, M.; Otterlo, M. Reinforcement learning: state-of-art. 1st edition. Springer Berlin, 2012.
69. Li, Y. Deep reinforcement learning: an overview. arXiv 2017, arXiv:1701.07274. Available online: https://doi.org/10.48550/arXiv.1701.07274. (accessed 11 Nov 2025).
70. Srivastava, N.; Hinton, G.; Krizhevsky, A.; Sutskever, I.; Salakhutdinov, R. Dropout: a simple way to prevent neural networks from overfitting. J. Mach. Learn. Res. 2014, 15, 1929-58. https://www.jmlr.org/papers/volume15/srivastava14a/srivastava14a.pdf?utm_content=buffer79b4. (accessed 11 Nov 2025).
71. Aung, S. C.; Foo, C. L.; Lee, S. T. Three dimensional laser scan assessment of the Oriental nose with a new classification of Oriental nasal types. Br. J. Plast. Surg. 2000, 53, 109-16.
72. Uzun, A.; Akbas, H.; Bilgic, S.; et al. The average values of the nasal anthropometric measurements in 108 young Turkish males. Auris. Nasus. Larynx. 2006, 33, 31-5.
73. Farkas, L. G.; Katic, M. J.; Forrest, C. R.; et al. International anthropometric study of facial morphology in various ethnic groups/races. J. Craniofac. Surg. 2005, 16, 615-46.
74. Chen, Y.; Medioni, G. Object modelling by registration of multiple range images. Image. Vis. Comput. 1992, 10, 145-55.
Cite This Article
How to Cite
Download Citation
Export Citation File:
Type of Import
Tips on Downloading Citation
Citation Manager File Format
Type of Import
Direct Import: When the Direct Import option is selected (the default state), a dialogue box will give you the option to Save or Open the downloaded citation data. Choosing Open will either launch your citation manager or give you a choice of applications with which to use the metadata. The Save option saves the file locally for later use.
Indirect Import: When the Indirect Import option is selected, the metadata is displayed and may be copied and pasted as needed.
About This Article
Copyright

Data & Comments
Data
0


Comments
Comments must be written in English. Spam, offensive content, impersonation, and private information will not be permitted. If any comment is reported and identified as inappropriate content by OAE staff, the comment will be removed without notice. If you have any queries or need any help, please contact us at [email protected].