


fig8
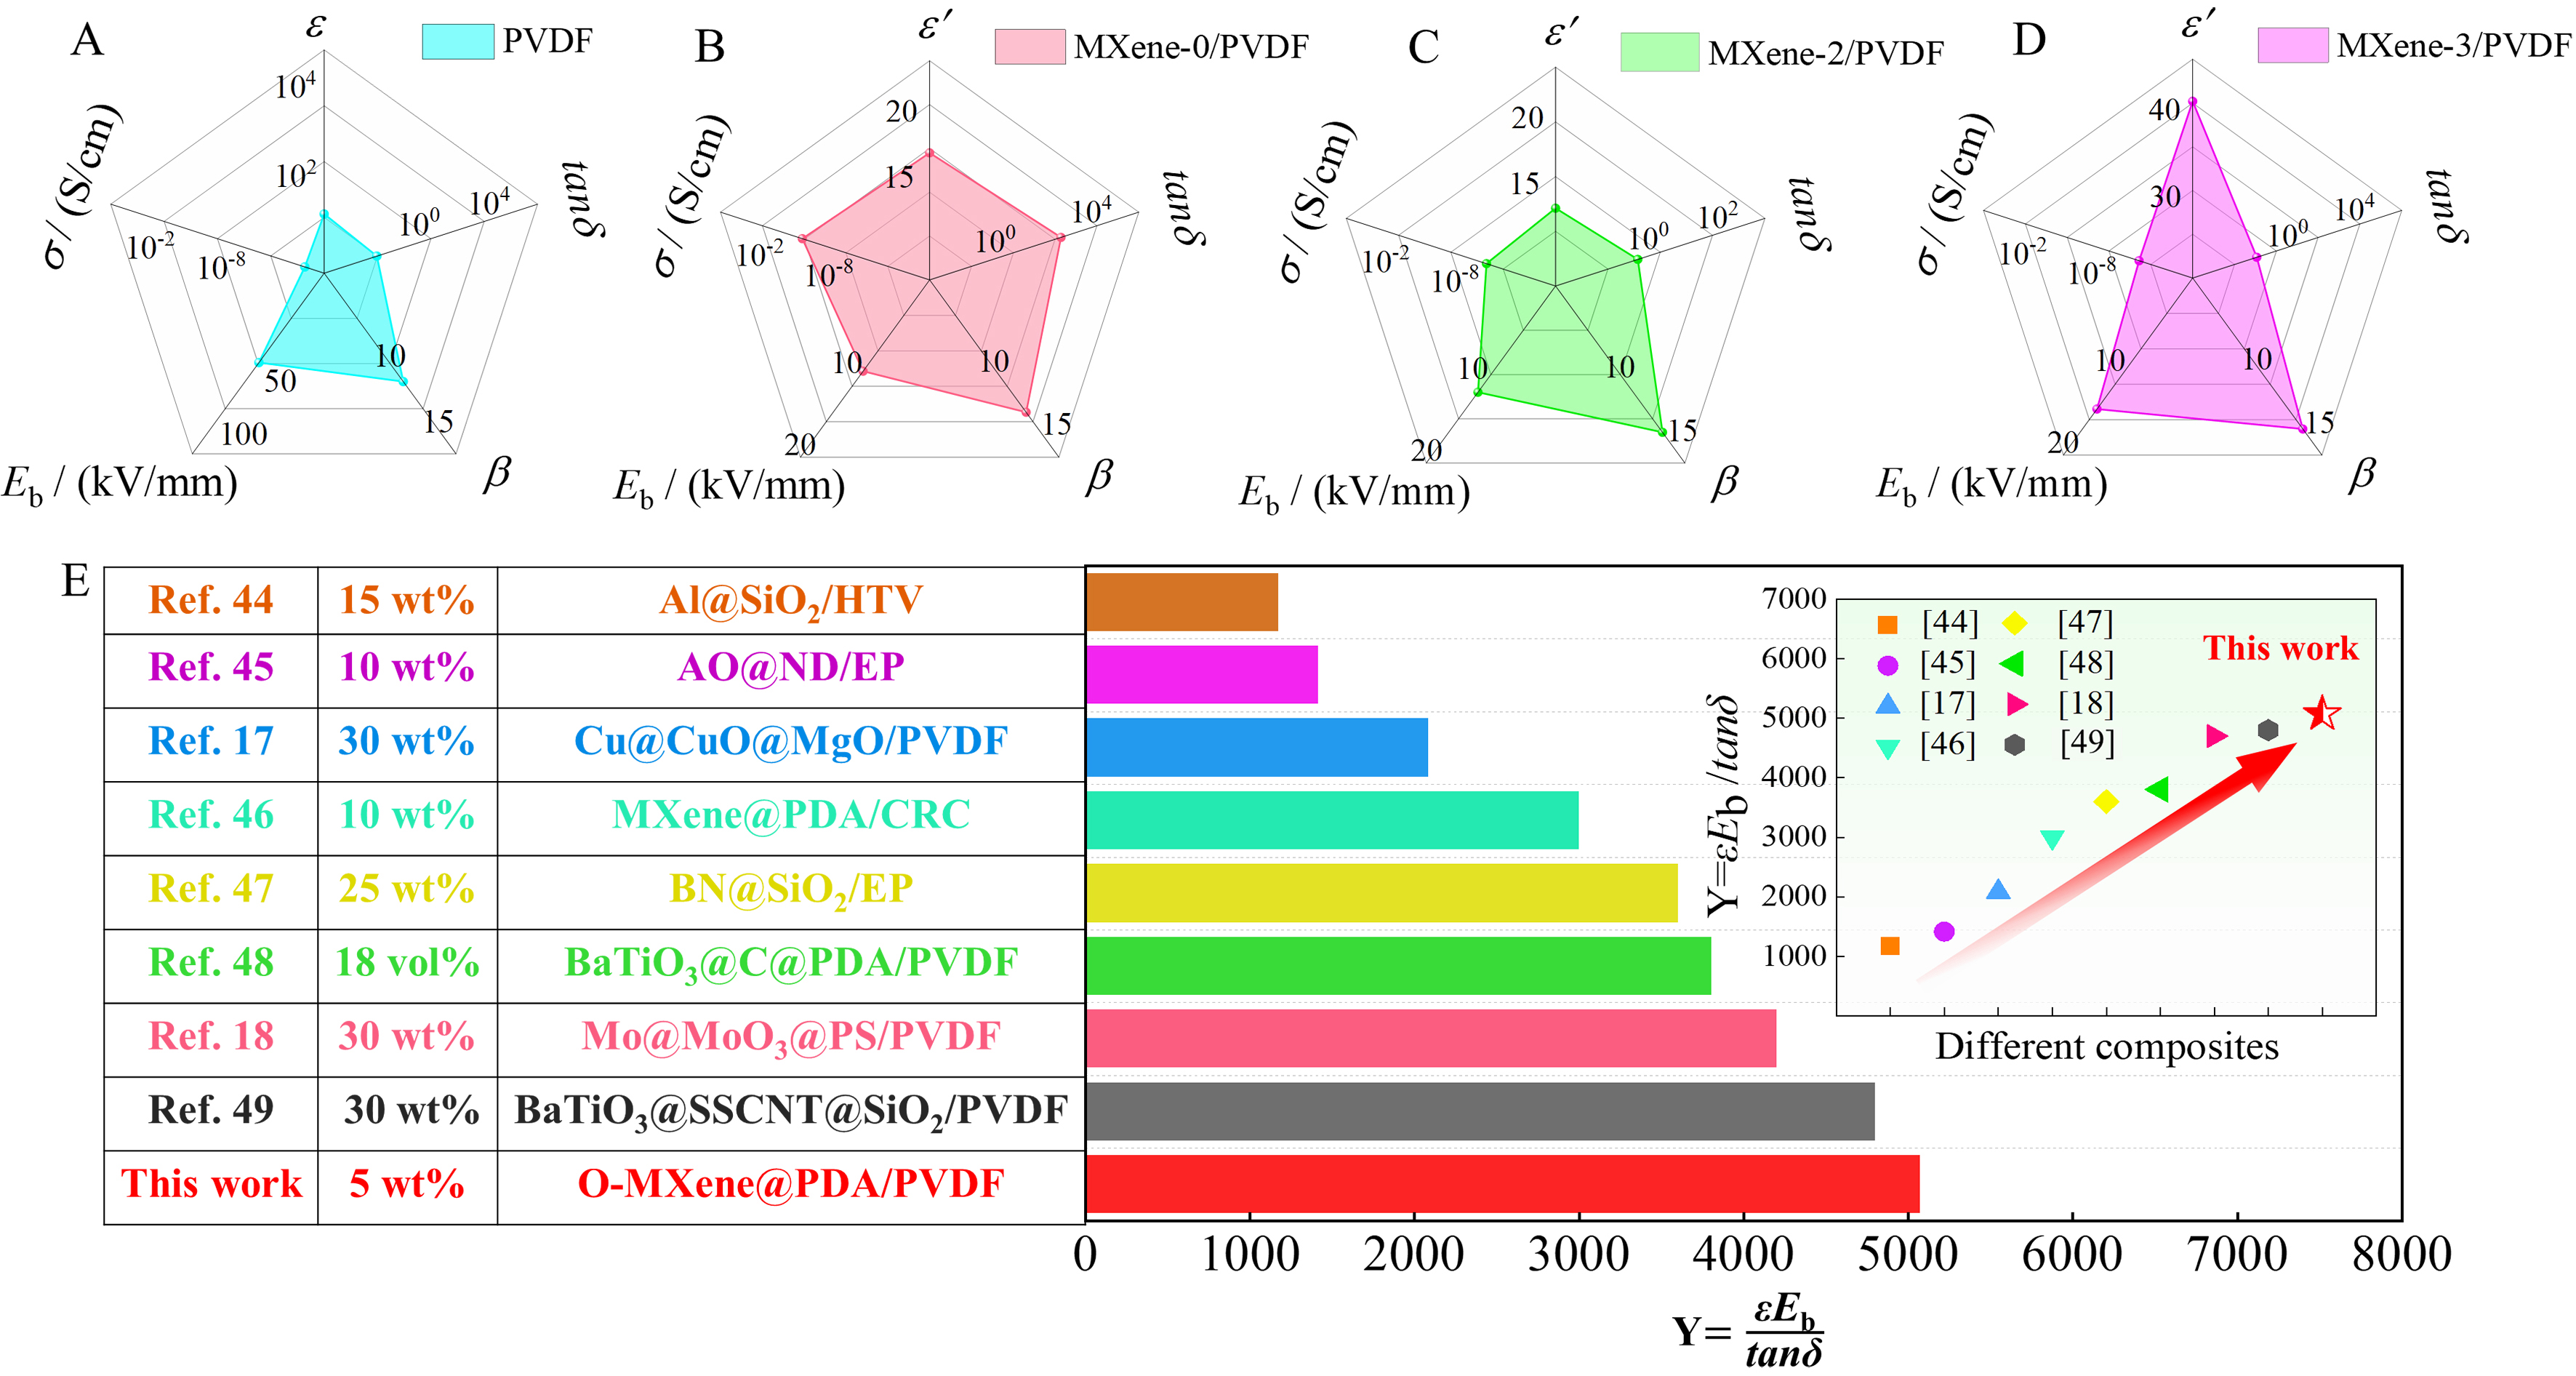
Figure 8. Radar charts shown for (A) pristine PVDF, (B) MXene-0/PVDF, (C) MXene-2/PVDF, (D) MXene-3/PVDF. (E) Contrast of Y (dielectric response and breakdown strength per unit loss,
Figure 8. Radar charts shown for (A) pristine PVDF, (B) MXene-0/PVDF, (C) MXene-2/PVDF, (D) MXene-3/PVDF. (E) Contrast of Y (dielectric response and breakdown strength per unit loss,


All published articles are preserved here permanently:
https://www.portico.org/publishers/oae/


