


fig2
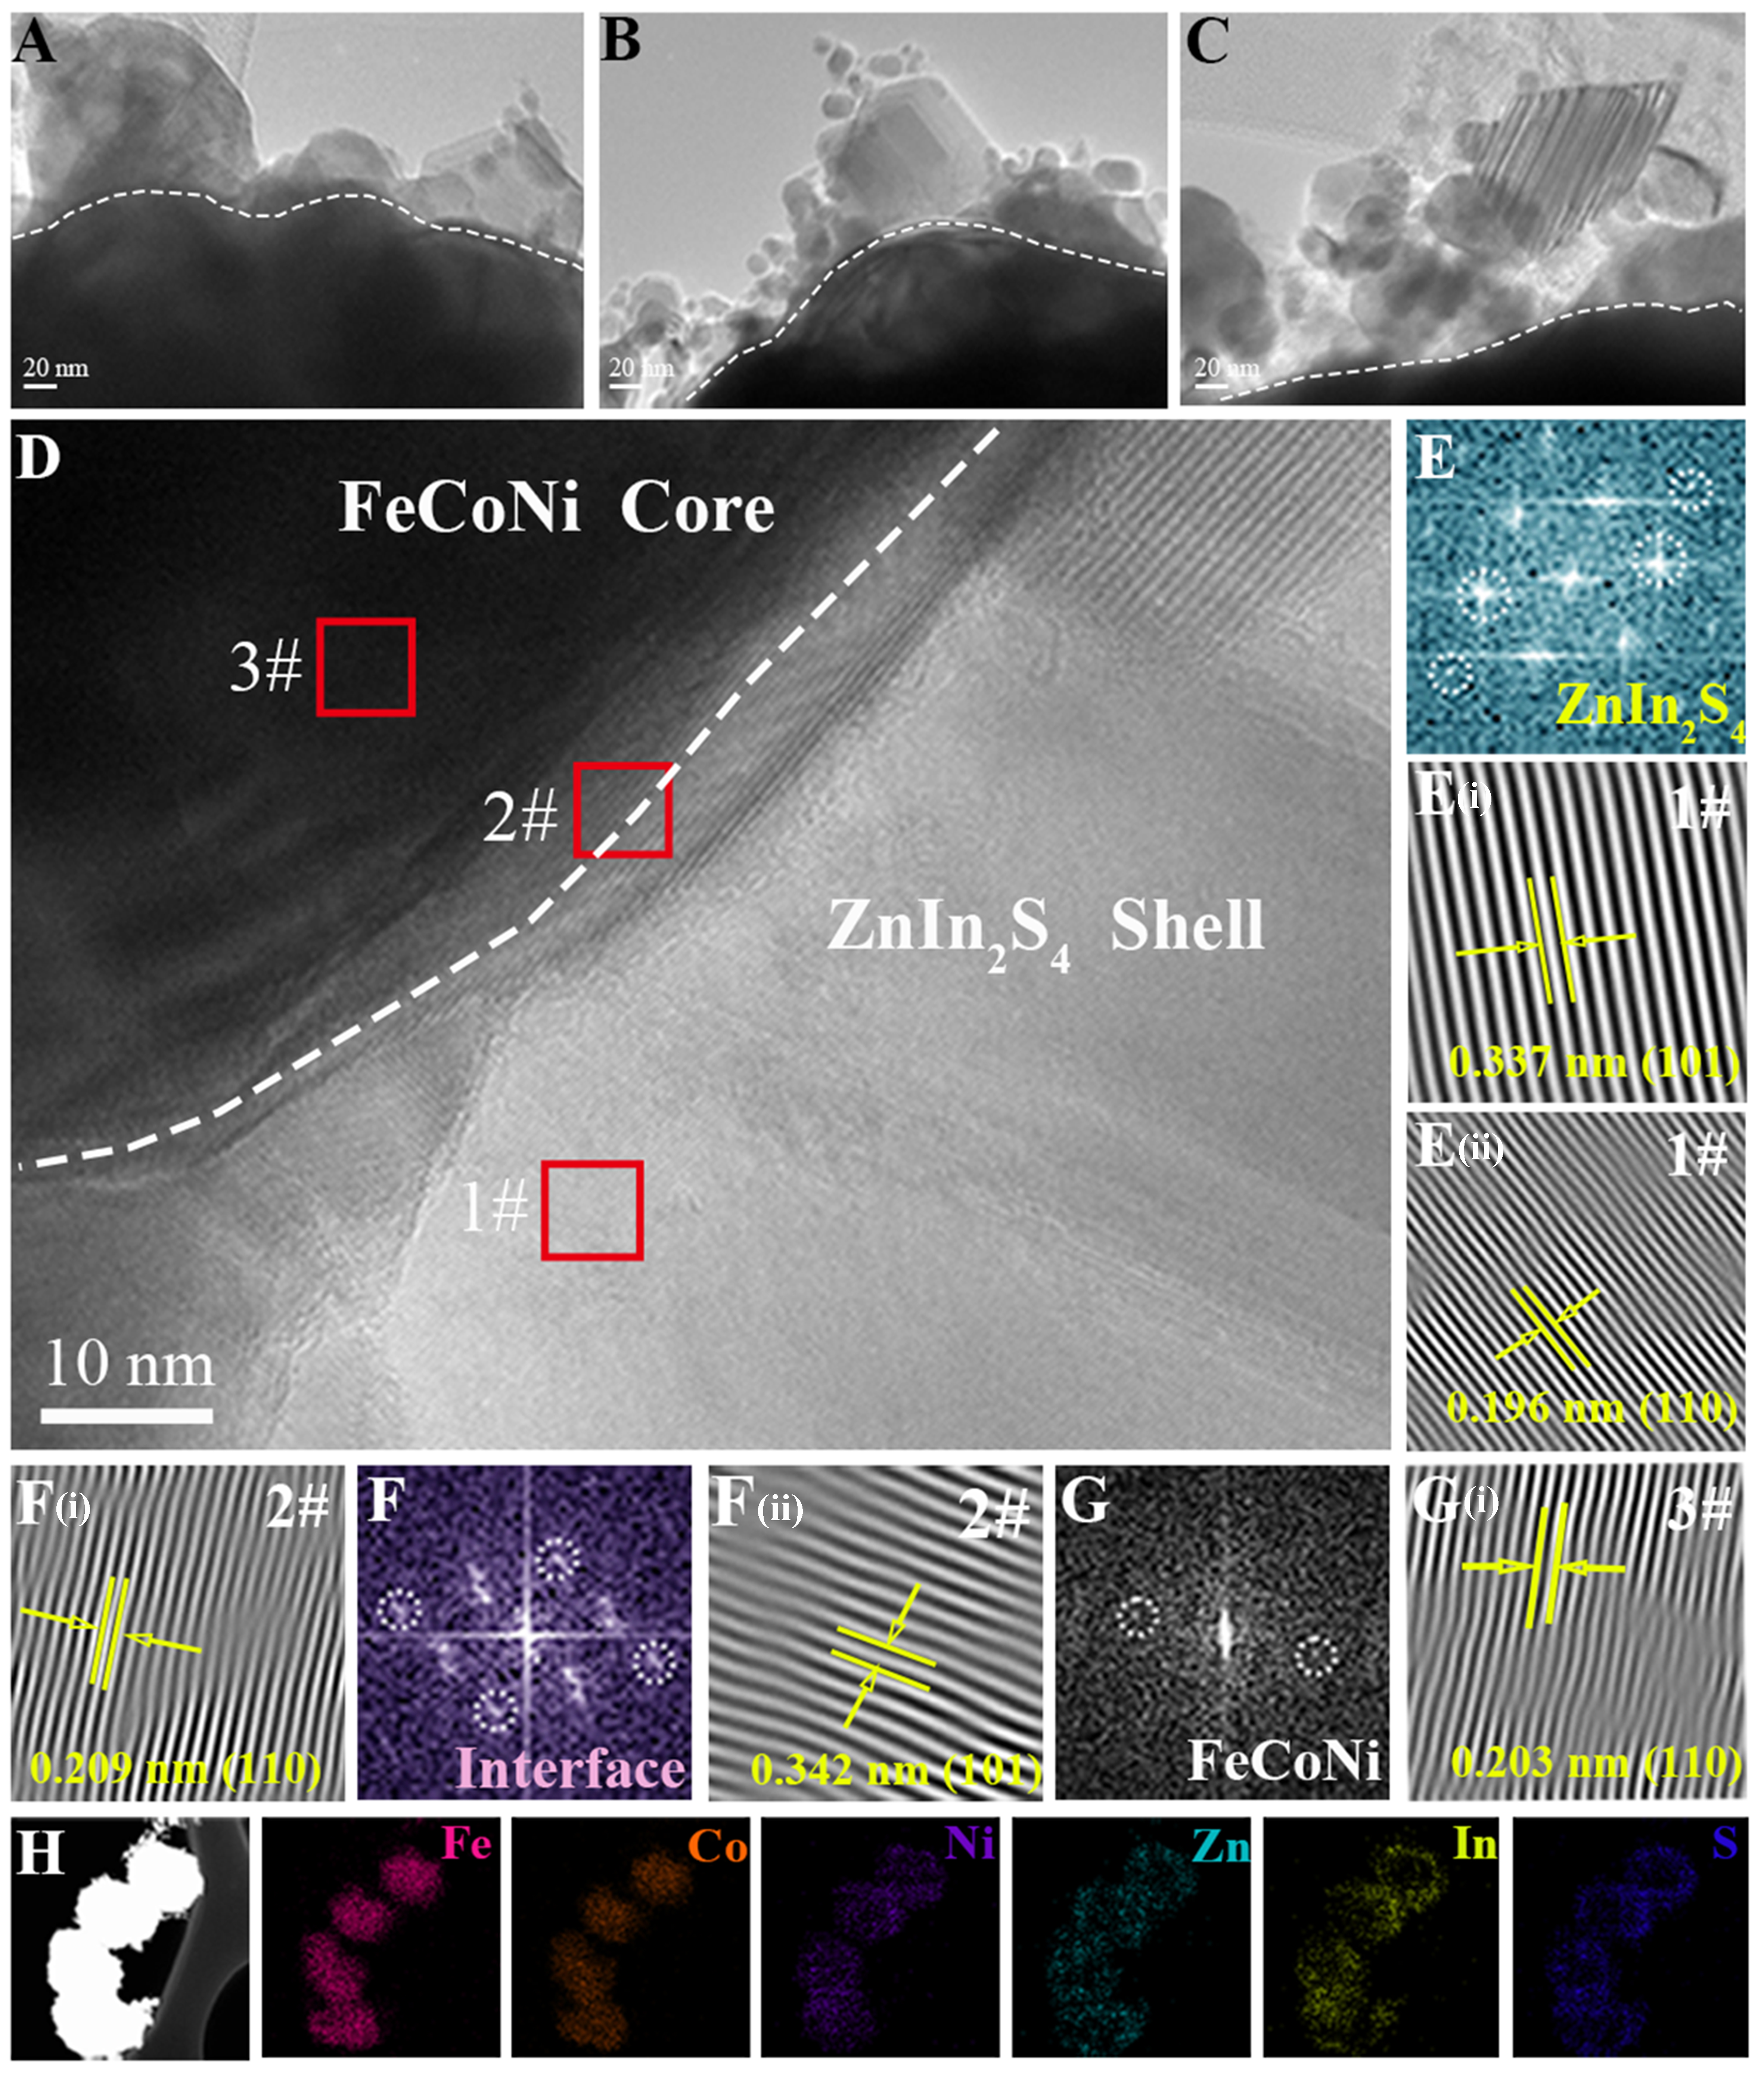
Figure 2. TEM images of (A) FCNZ-500, (B) FCNZ-600 and (C) FCNZ-700; (D) HRTEM image of FCNZ-600; (E-G) FFT patterns corresponding to the red solid frames 1-3; [E(i), E(ii), F(i), F(ii), G(i)] The enlarged image of the region (red solid frame 1-3) in panels (E-G); (H) Element mapping distribution of FCNZ-600. TEM: Transmission electron microscope; HRTEM: high resolution transmission electron microscopy; FFT: fast Fourier transform.


