


fig6
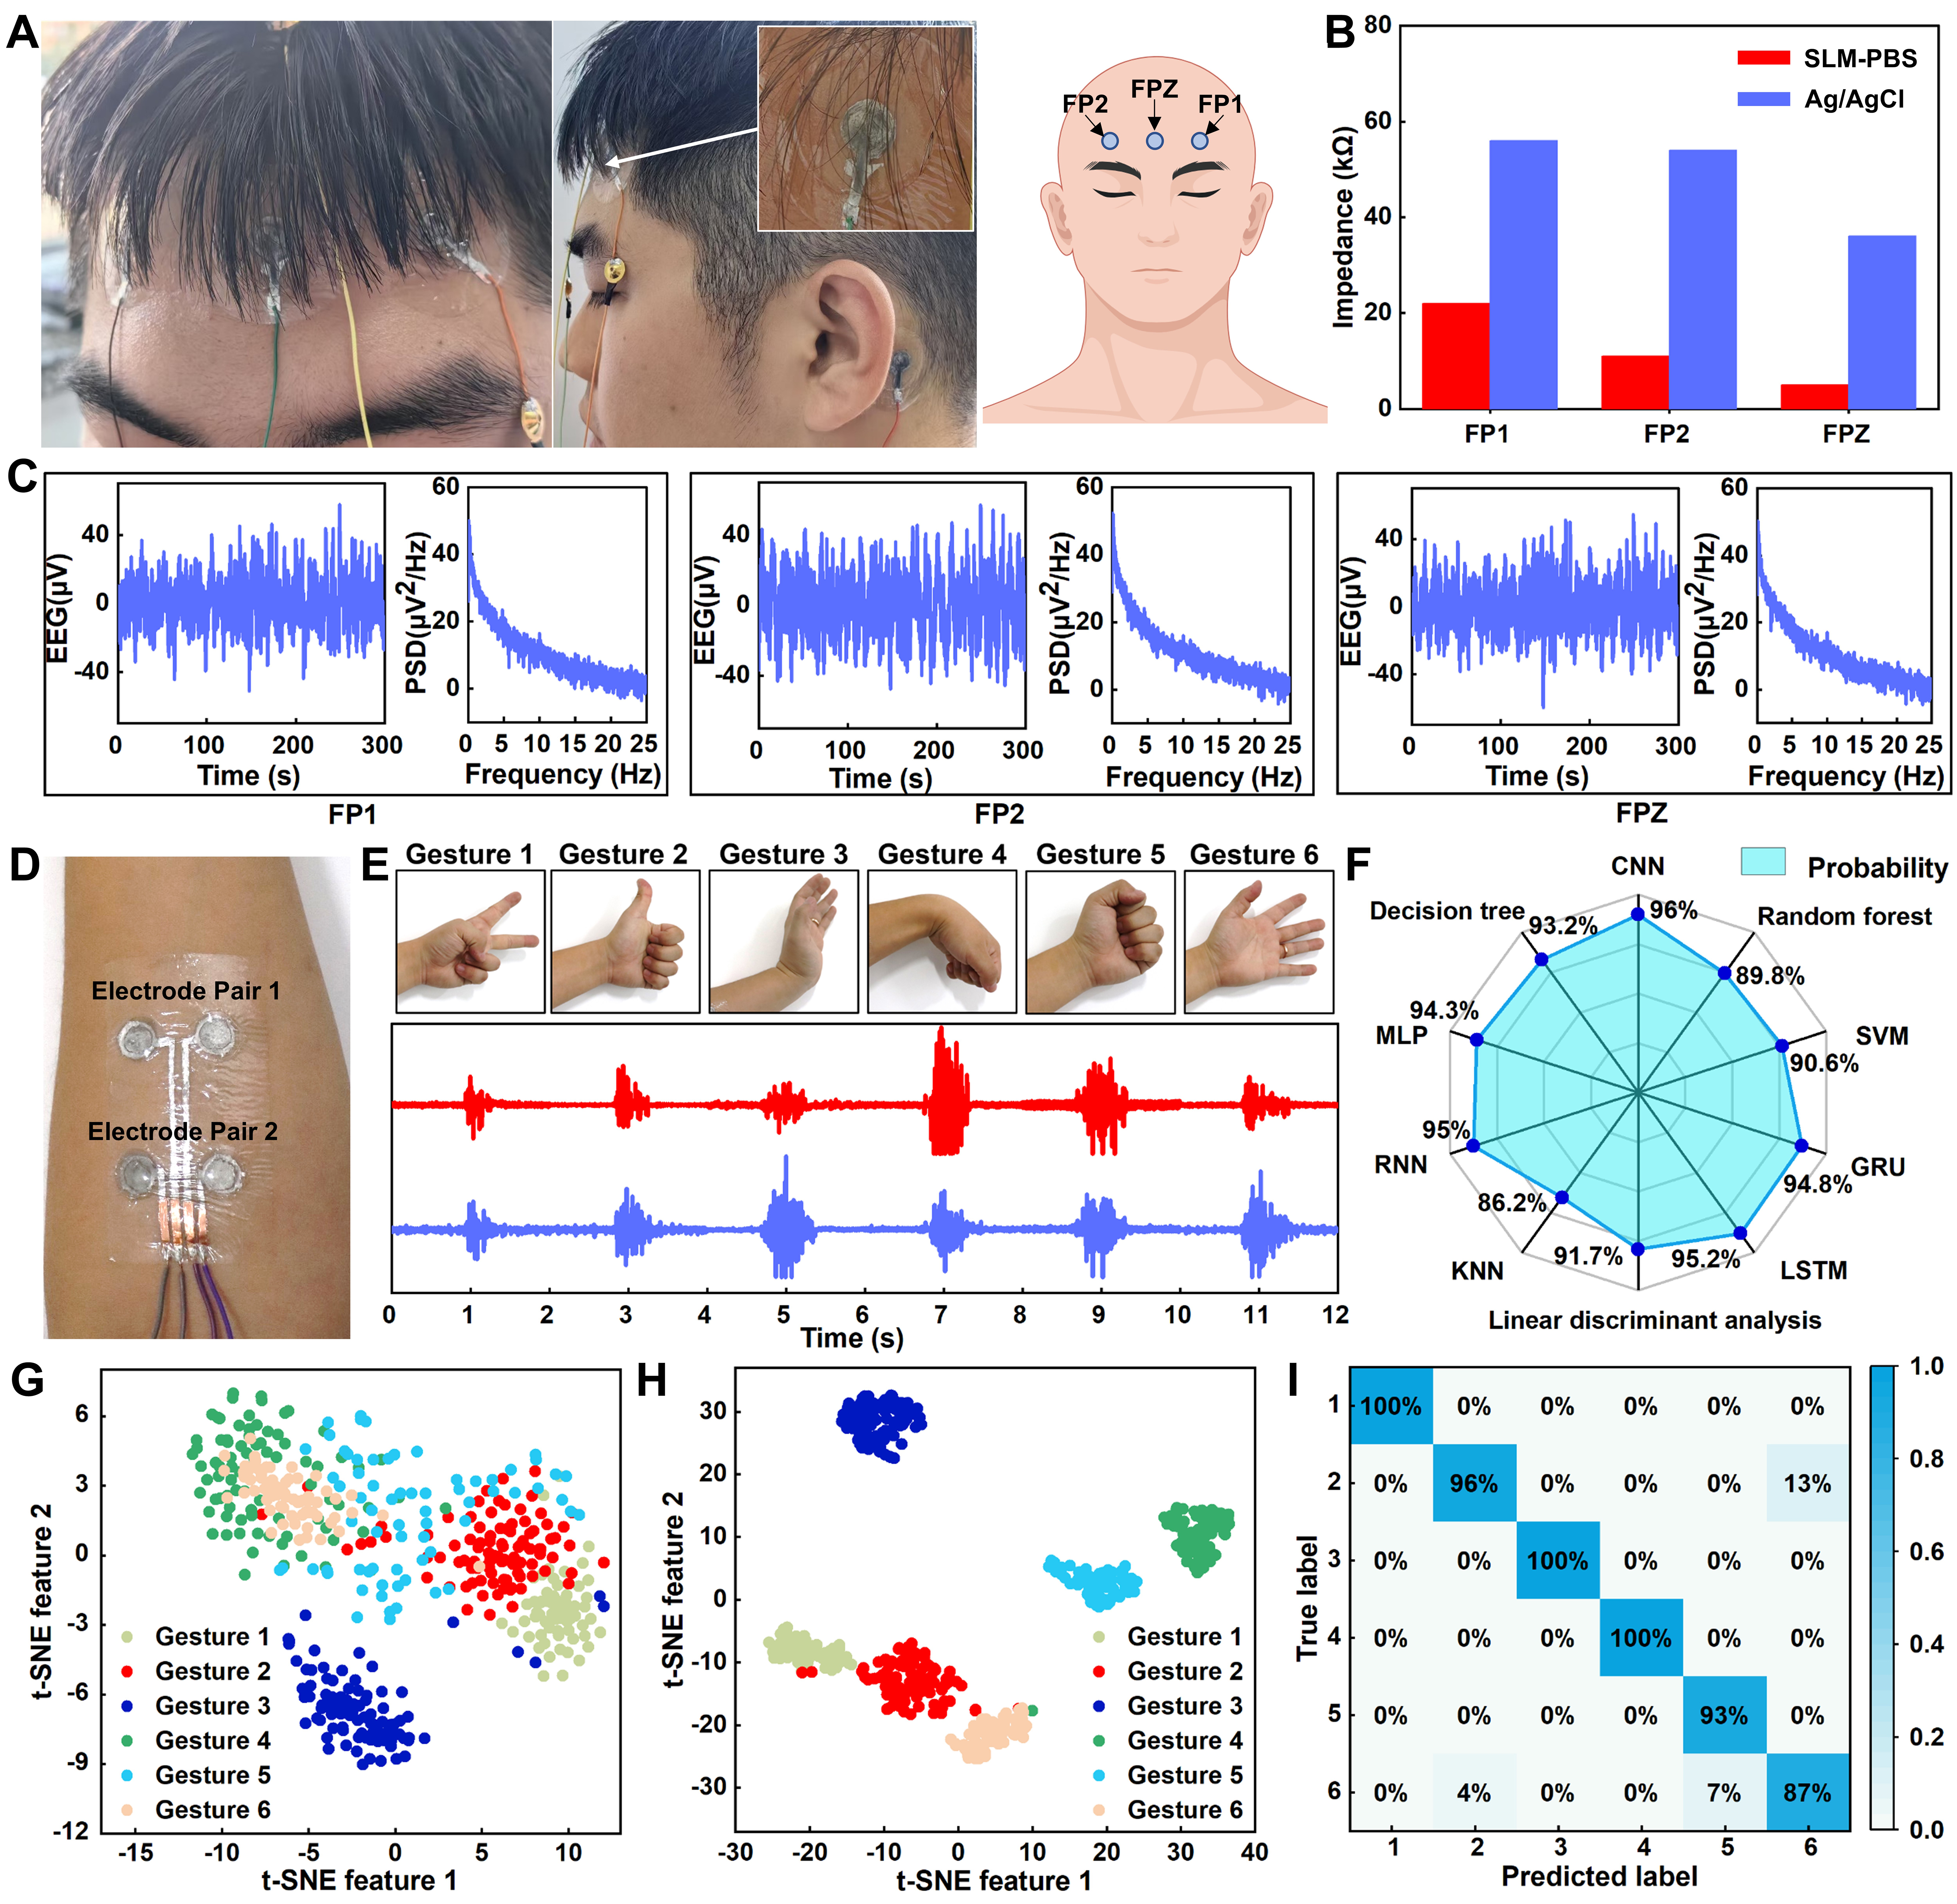
Figure 6. Performance characterization of human EEG and EMG signal monitoring and gesture recognition using SLM-PBS electrodes. (A) Images of SLM-PBS flexible electrodes attached to the scalp for EEG acquisition, close-up view, and the schematic of EEG positions including FP1, FP2, FPZ; (B) Impedance comparison chart between SLM-PBS electrodes and Ag/AgCl electrodes at FP1, FP2, and FPZ positions; (C) EEG time-domain waveforms and corresponding PSD plots at FP1, FP2, and FPZ positions; (D) Image of SLM-PBS electrodes attached to the forearm for EMG acquisition; (E) Schematics of six hand gestures and corresponding EMG time-domain waveforms; (F) Radar chart comparing gesture recognition accuracies of multiple machine learning algorithms; (G and H) The t-SNE dimensionality reduction visualizations of EMG signal features for six hand gestures; (I) Confusion matrix of CNN-based gesture recognition results. EEG: Electroencephalogram; EMG: electromyogram; SLM: semi-liquid metal; PBS: polyborosiloxane; PSD: power spectral density; t-SNE: t-distributed stochastic neighbor embedding; CNN: convolutional neural network.


