


fig3
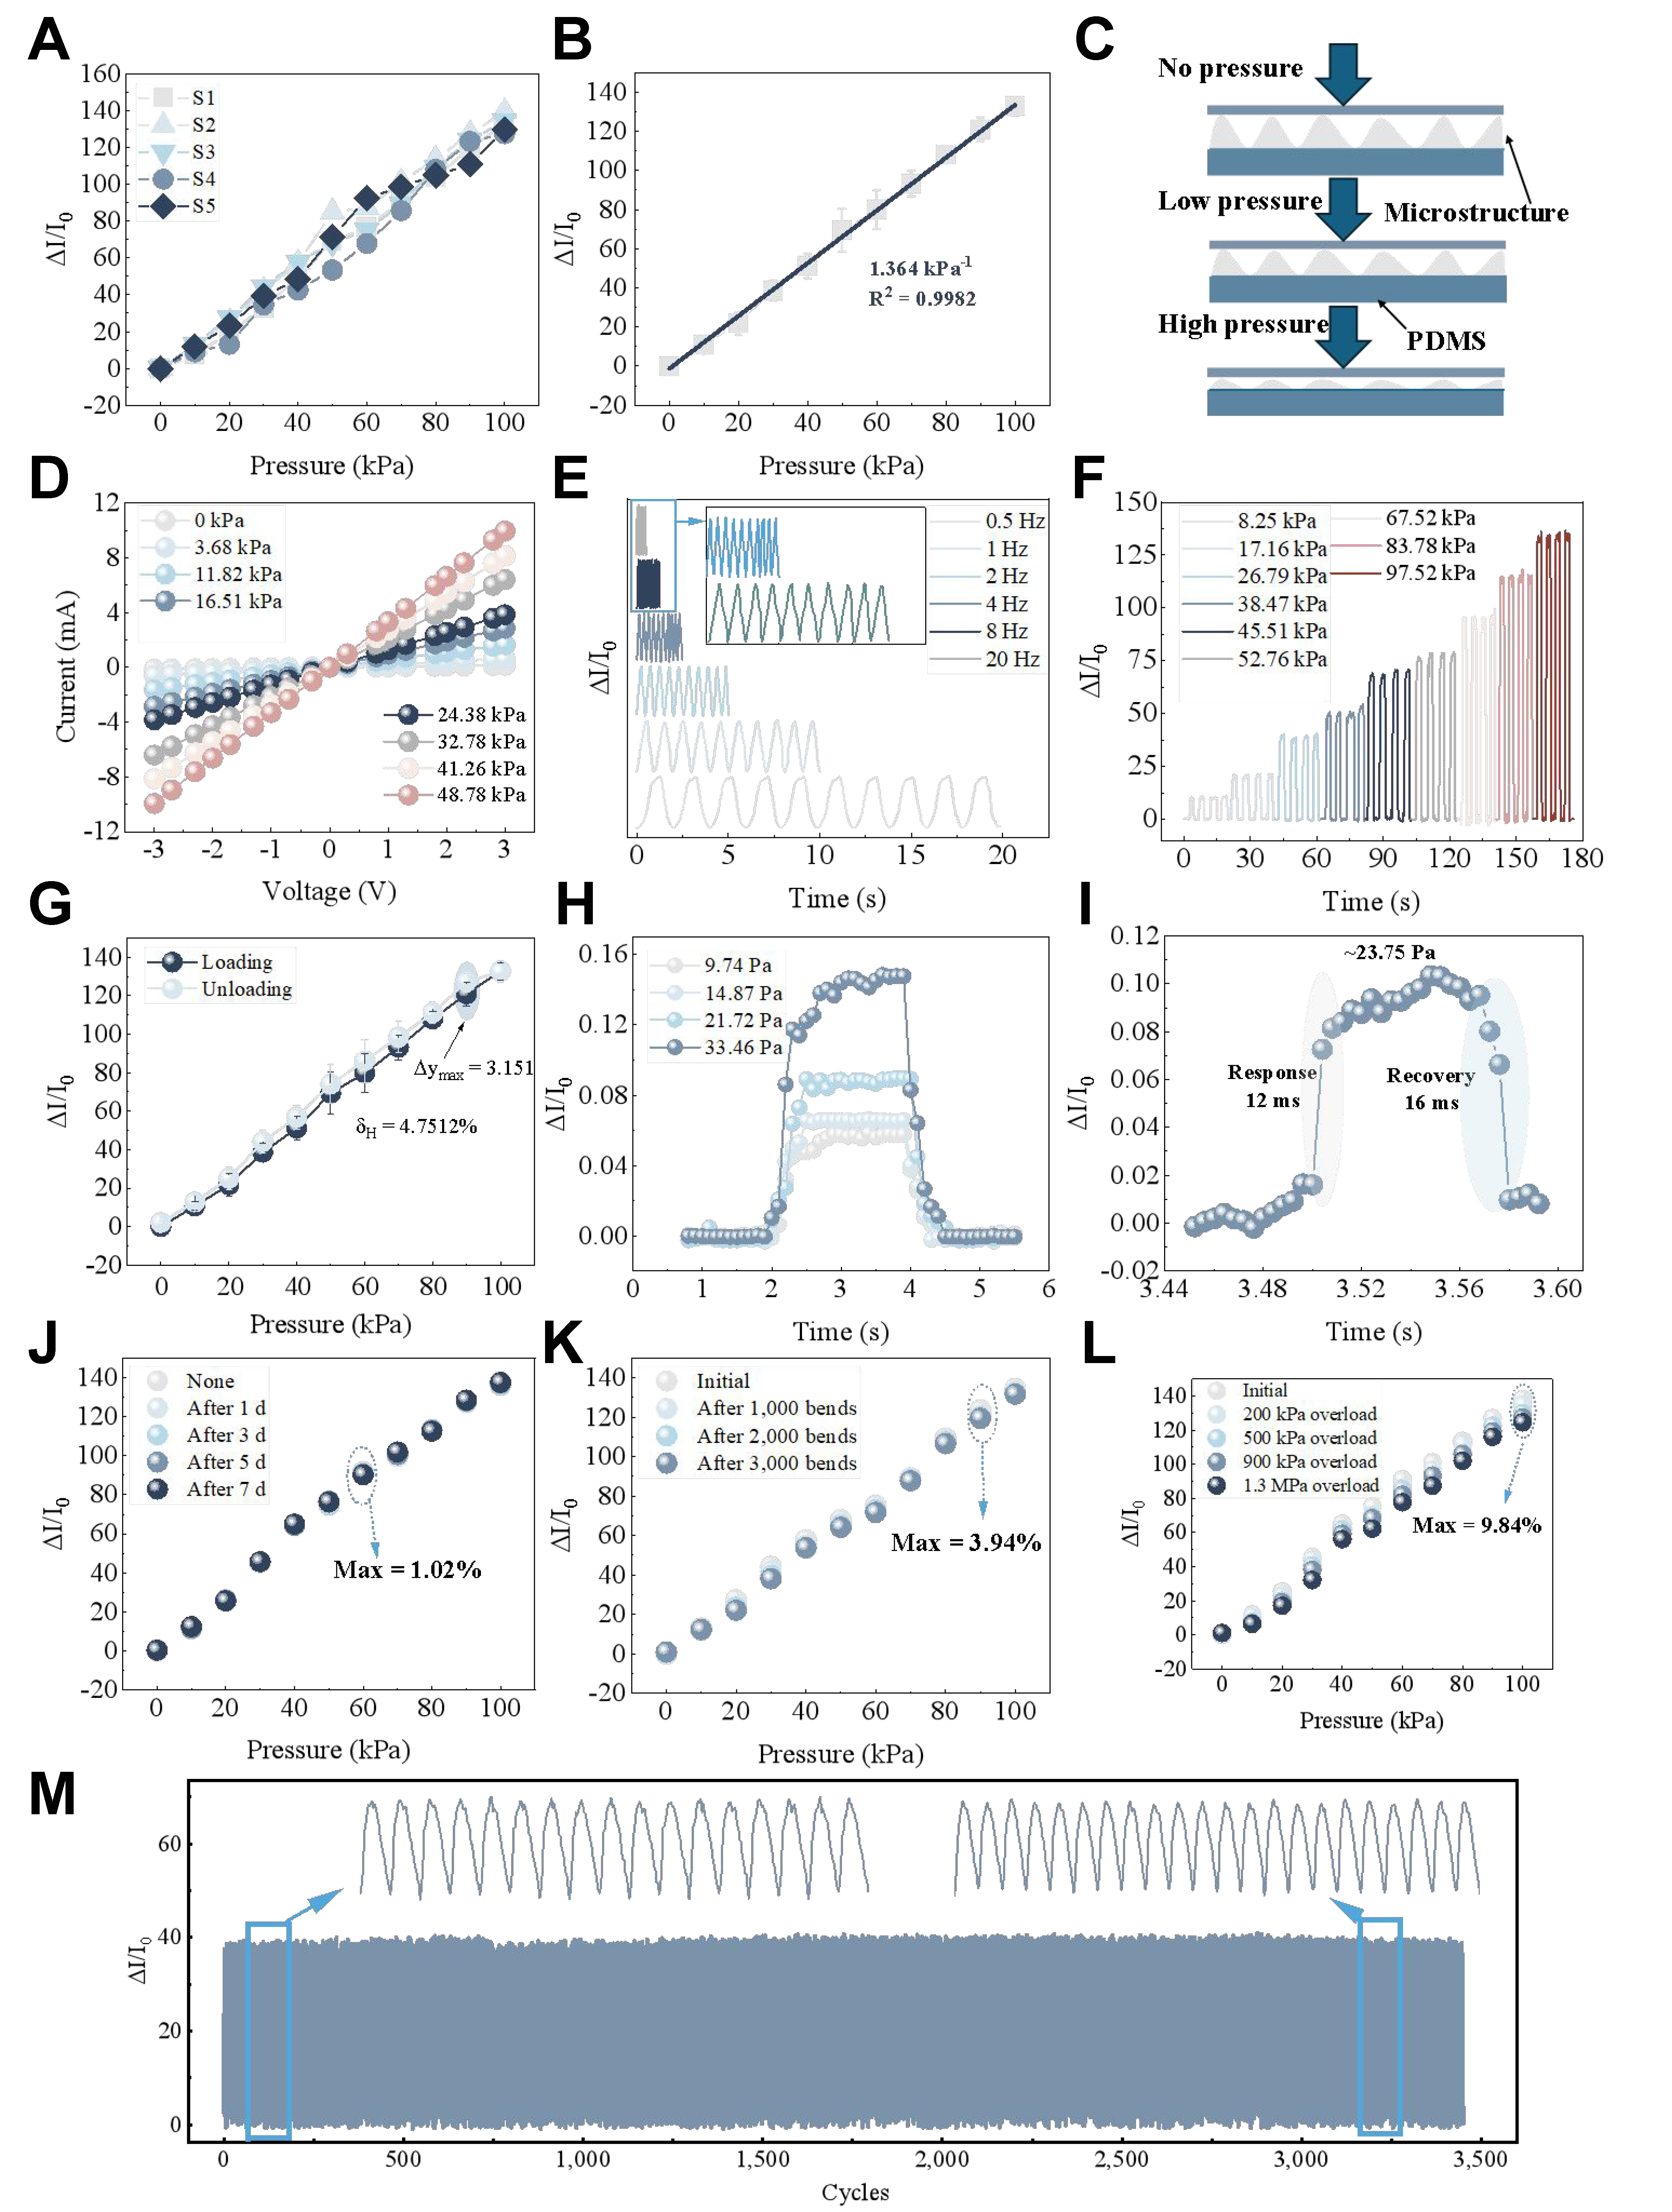
Figure 3. Performance characterization of the flexible sensing unit. (A) Calibration curves of different batches of sensors; (B) Sensitivity characterization. The error bars represent the SD of five batches of sensors; (C) Sensor operation principle; (D) I–V characteristic curves of the sensors; (E) Response curves for different frequencies at 20 kPa; (F) Response curves for four loading cycles at different pressures; (G) Full-scale hysteresis error. The error bars indicate the SDs obtained from repeated tests (n = 5); (H) Minimum resolving power; (I) Response and recovery time; (J) Waterproofing characteristics; (K) Bending resistance characteristics; (L) Overload stability; (M) Durability. SD: Standard deviation; PDMS: polydimethylsiloxane.


