


fig3
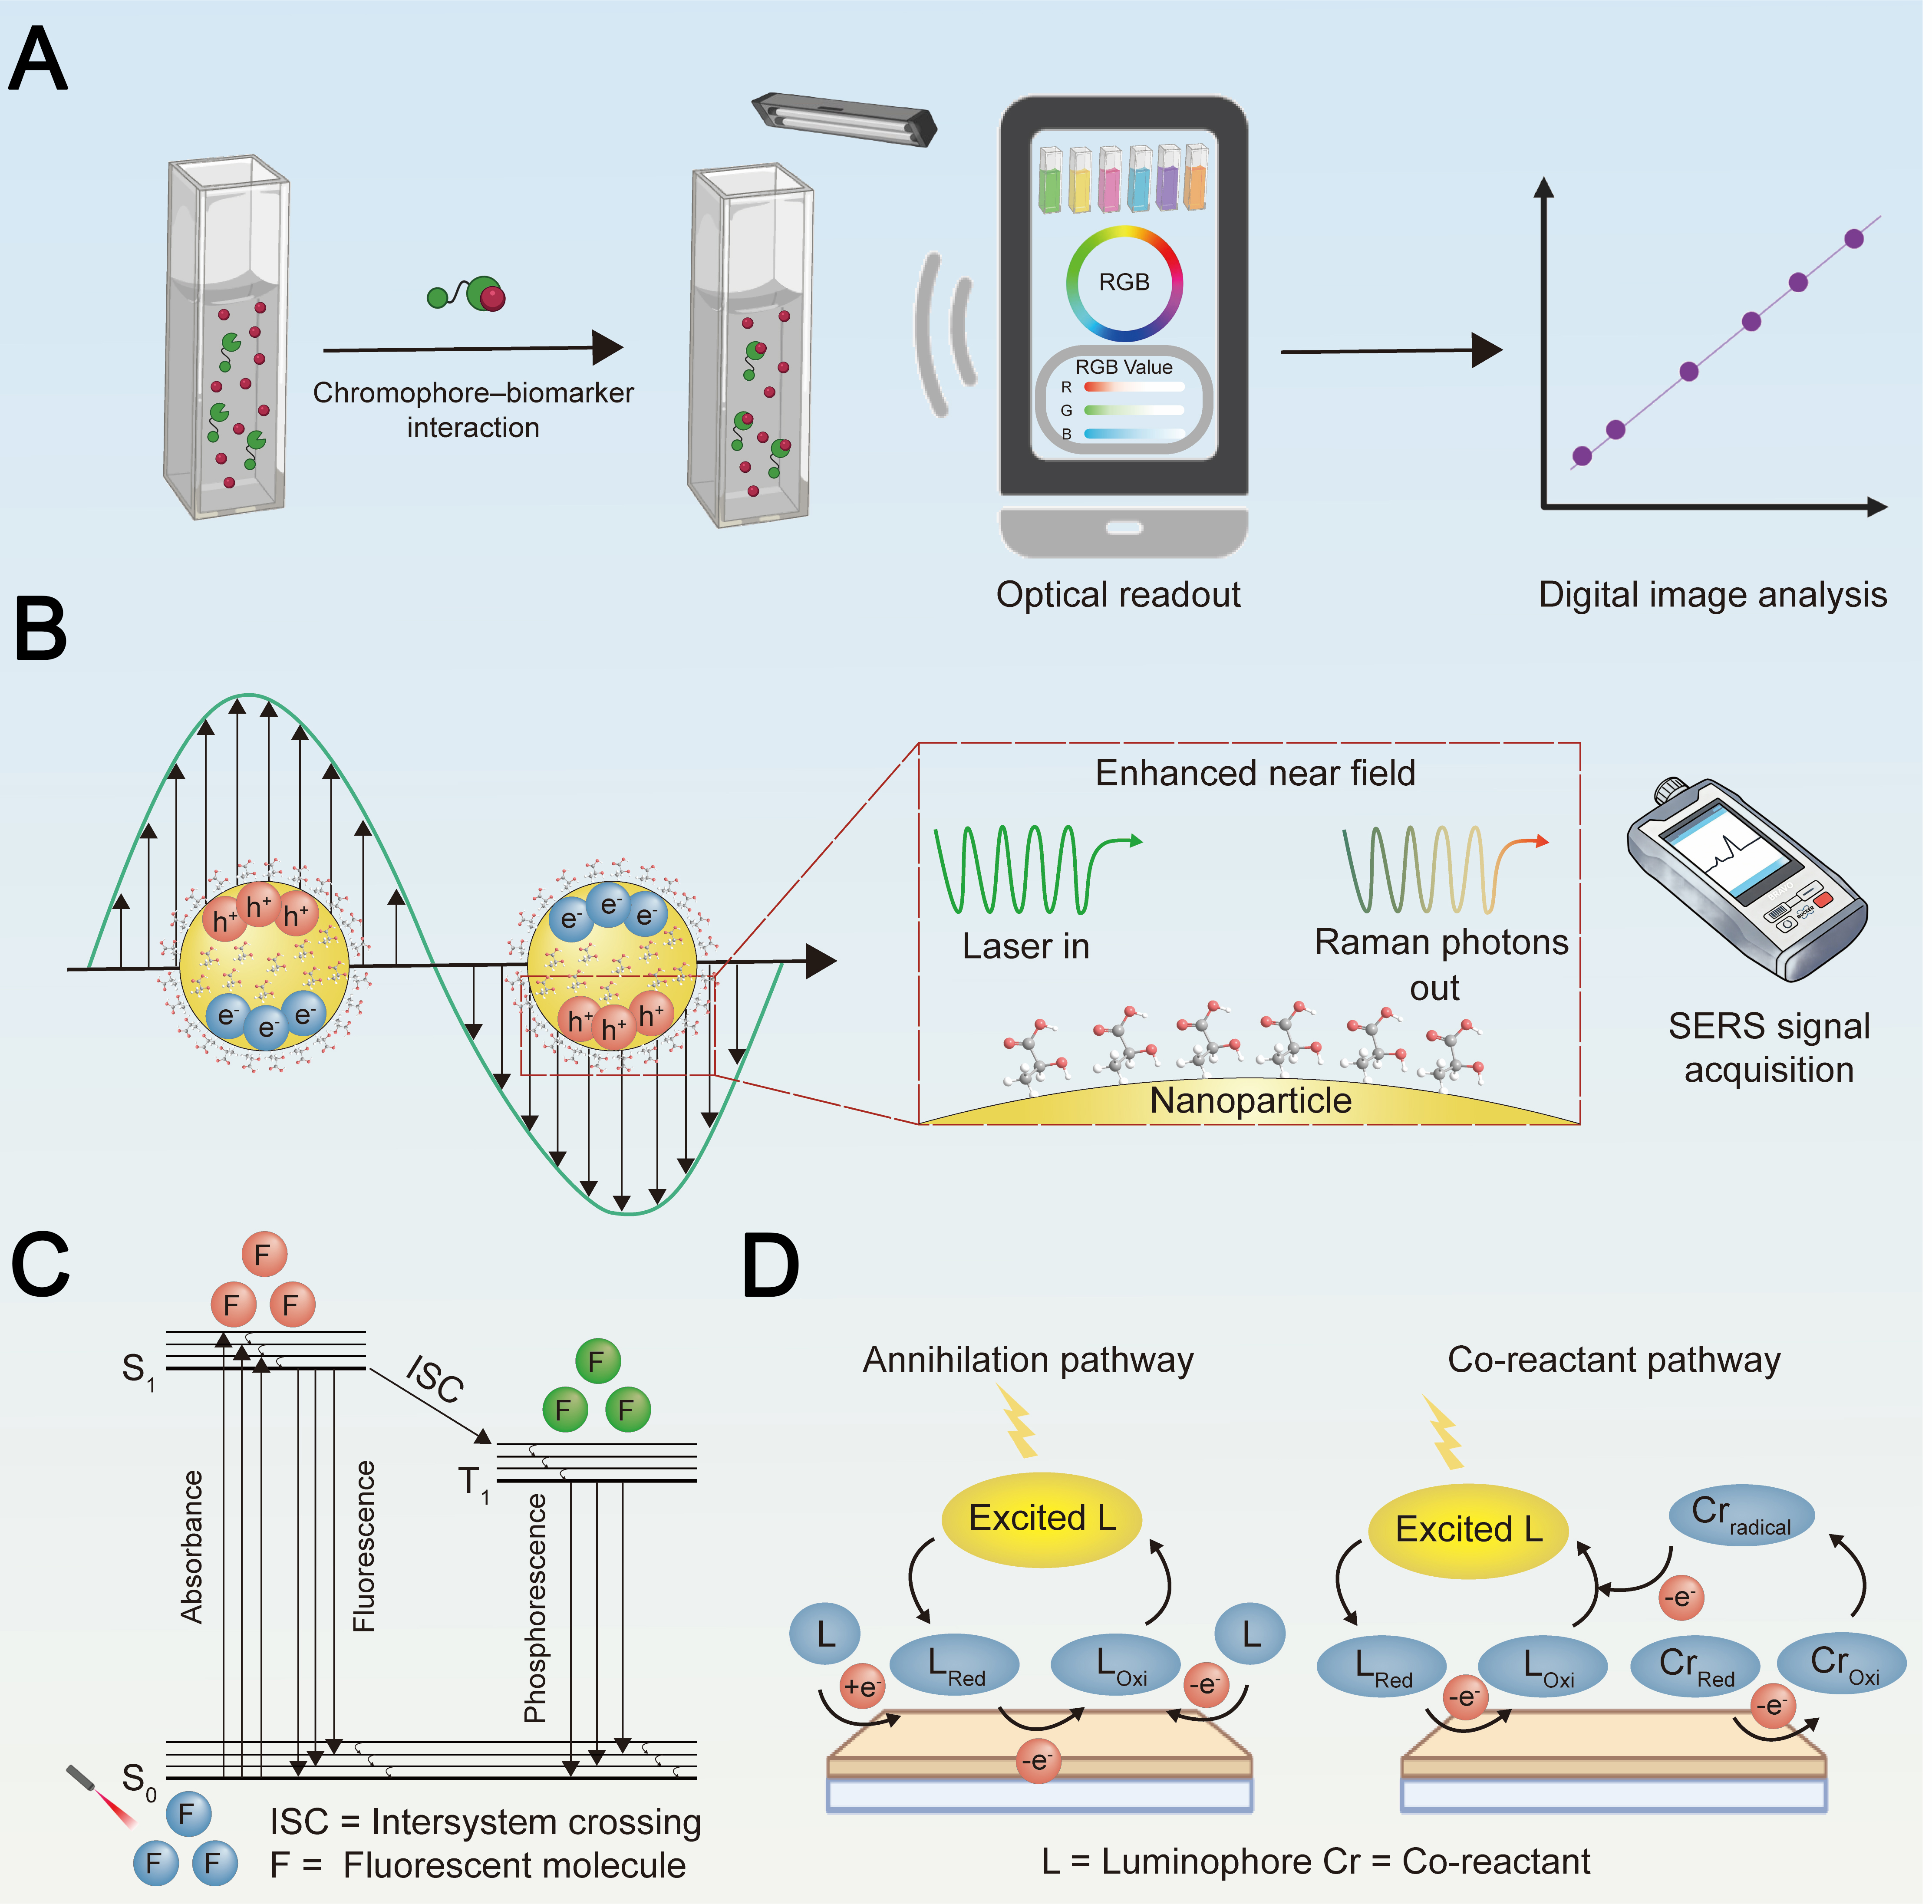
Figure 3. Schematic illustration of optical sensing mechanisms for wearable sweat analysis. (A) Colorimetric detection based on chromophore–biomarker interaction, where the resulting color change is analyzed via optical readout and digital image processing (e.g., RGB analysis); (B) SERS detection, in which laser excitation of plasmonic nanoparticles generates an enhanced near‑field that amplifies Raman scattering from adsorbed analyte molecules, enabling fingerprint‑specific signal acquisition; (C) Fluorescence detection: Target biomarkers interact with fluorescent probes under specific light excitation to modulate emission characteristics, enabling sensitive quantitative readout; (D) ECL detection: An applied potential triggers high-energy electron-transfer reactions at the electrode surface, generating excited-state luminophores that emit light upon relaxation, thereby providing a high-sensitivity signal without the need for external optical excitation[83]. Created in BioRender. Chu Wang. (2026) https://BioRender.com/tfxxgjh, Adobe Illustrator, and Maxon Cinema 4D R21. RGB: Red-green-blue; SERS: surface-enhanced Raman scattering; ECL: electrochemiluminescence.


