



A validated disease severity scoring system predicts risk of fractures in treated adults with type 1 Gaucher disease
 0
0 Abstract
Aim: Gaucher disease type 1 (GD1) is a lysosomal storage disorder associated with heterogeneous systemic and skeletal manifestations. Fragility fractures remain an important source of morbidity, even after initiation of enzyme replacement therapy (ERT). Validated tools to predict fracture risk in treated patients are limited.
Methods: We retrospectively analyzed 133 adult patients with GD1who were enrolled in a previously published Disease Severity Scoring System (DS3) validation study (NCT01136304). 132 ERT-treated patients were included in fracture-free survival analyses from which the one miglustat-treated patient was excluded. Baseline DS3 scores and Gaucher Risk Assessment for Fracture (GRAF) scores were calculated at treatment initiation. Fracture-free survival was assessed using Kaplan-Meier analysis, and predictive performance was evaluated using receiver operating characteristic (ROC) analysis, including combined DS3+GRAF models and Cox proportional hazards regression with age included as a continuous variable.
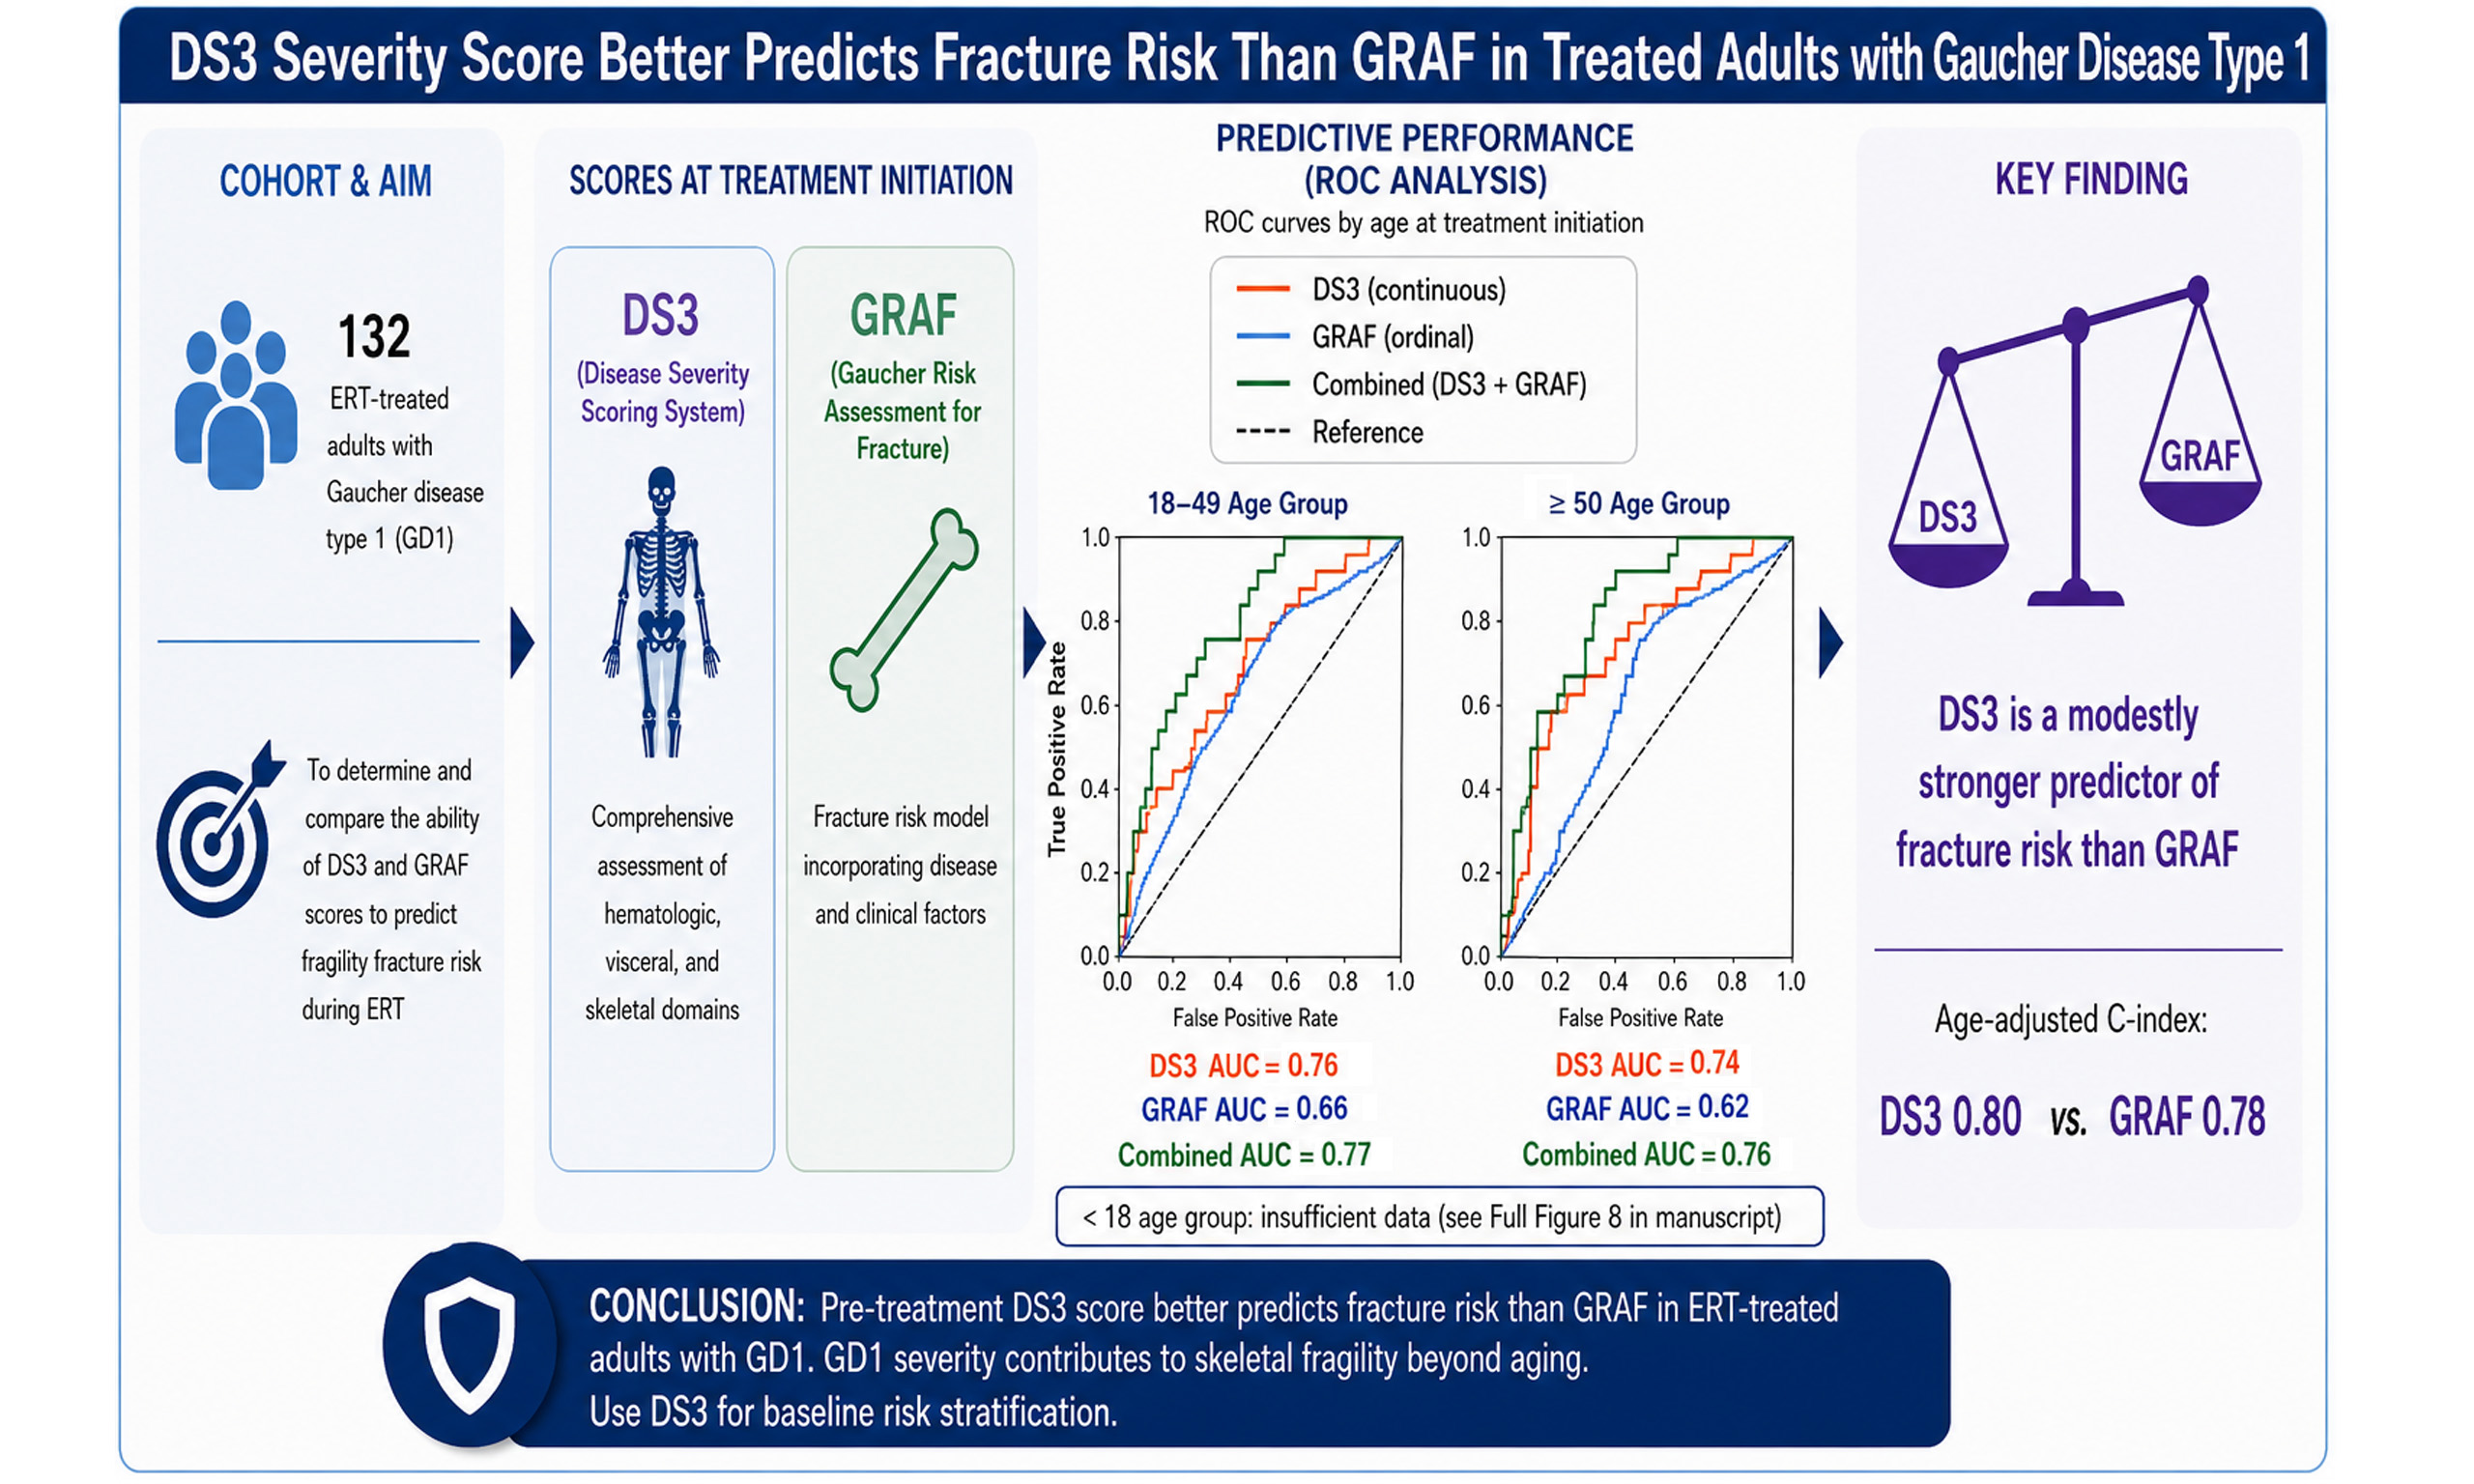
Results: Thirty-three patients (24.8%) experienced at least one fragility fracture during follow-up. Patients with fractures were older at treatment initiation, had longer delays between diagnosis and treatment, higher baseline DS3 and GRAF scores, and were more likely to have undergone splenectomy. For GRAF tertiles, the overall uncorrected log-rank test was significant, but Holm-corrected pairwise comparisons were not. ROC analysis showed that both the baseline DS3 score and the GRAF score moderately predicted fracture risk [area under the curve (AUC) ~0.76, 0.66 respectively]. The combined model modestly enhanced predictive performance, particularly in adults treated before age 50. The age-adjusted DS3 Cox model demonstrated a C-index of 0.80, compared with 0.78 for the age-adjusted GRAF model. Inclusion of both scores together resulted in only minimal improvement in discrimination (C-index 0.80), suggesting limited incremental predictive value of combining the two measures.
Conclusions: Pre-treatment baseline DS3 is a modestly stronger predictor of fracture risk in patients on ERT than GRAF score (Kaplan-Meier), GD1 severity itself contributes to skeletal fragility beyond the effect of aging alone (COX), and inclusion of both scores together resulted in only minimal improvement in discrimination (ROC, C-index comparison).
In clinical practice, DS3 may be preferred for baseline risk stratification, while GRAF may retain value in settings where full DS3 assessment is not feasible. Because many other fracture risk variables are not included either in DS3 or GRAF, both should be interpreted as complementary rather than stand-alone predictive tools. Reliance on dual-energy X-ray absorptiometry (DXA)-derived bone mineral density alone as a surrogate for fracture risk warrants reassessment.
Keywords
INTRODUCTION
Gaucher disease type 1 (GD1; OMIM #230800) is an autosomal recessive lysosomal storage disorder caused by deficient activity of glucocerebrosidase due to pathogenic variants in the GBA gene (GBA1; G/L MIM 606463[1]. GD1 exhibits marked clinical heterogeneity, ranging from asymptomatic disease to progressive involvement of hematologic, visceral, and skeletal systems. Enzyme replacement therapy (ERT) has transformed the natural history of GD1; however, responses - particularly with respect to skeletal outcomes - remain variable[2-4].
The skeletal manifestations of GD1, chronic bone pain, acute bone crisis, osteonecrosis and fragility fractures contribute substantially to morbidity and reduced quality of life[5,6]. Fragility fractures are related to skeletal pathophysiology including abnormalities of the bone marrow and the effects of infiltration with glucocerebroside-engorged macrophages (Gaucher cells); abnormalities of trabecular and cortical bone including modeling and remodeling defects; loss of bone mineral mass with osteopenia/osteoporosis or lytic lesions; vasculopathy and osteonecrosis that adversely affects bone structural and mechanical integrity[2,7,8]. Displacement or suppression of bone marrow adipocytes may also inhibit osteoblastic synthesis of new bone shifting the equilibrium in favor of bone resorption and bone mineral loss[2].
Estimation of fracture prevalence is challenging due to disease and event rarity, heterogeneous reporting, and limitations of GD1 registry data. Validity of comparisons with control groups is challenged by variable geographical norms, and changing demographics including age distributions, racial and ethnic composition, and imbalances in economic and nutritional conditions[9]. Retrospective registry studies are compromised by case under-reporting, cross-sectional rather than longitudinal reporting, incomplete data, and inclusion of fragility and non-fragility fractures[10]. Notwithstanding these caveats, among 706 never treated or pre-ERT patients with GD1 enrolled in the International Collaborative Gaucher Group (ICGG) Gaucher Registry before 1998, 15% had a history of fracture[11]. In a multi-center study in the United Kingdom (UK), 28% reported fragility fractures[12]. Among 105 adult GD1 patients in France, 18% had non-vertebral fractures and 15% had vertebral fractures, and in a more recent study of 239 patients, there were more pathological fractures but fewer vertebral compression fractures {58 [24.3%], 23 [9.6%]} within the first 15 years after starting ERT[13,14]. In comparison, from 2017-2020, in US individuals 50 years or older, the prevalence of fragility fractures (hip, wrist, vertebral) was only 0.8%, 2.2%, 0.4% and non-fragility fractures 0.6%, 1.8%, 0.9%. For individuals younger than 50 years of age, the prevalences for all fractures were 0.7%, 9.8%, 3.0%[15]. This disparity confirms that at all ages, individuals with GD1 have an inordinate number of fractures compared to those non-affected.
Fracture risk assessment in GD1 has relied largely on dual-energy X-ray absorptiometry (DXA), despite the complex skeletal pathology characteristic of this disease[16]. In a case-controlled study in which 319 GD1 patients with a first-time fracture were matched for gender, year of birth, treatment status, and splenectomy status with 1,233 GD1 patients without a fracture history, only lumbar spine Z-scores ≤ -1 were identified as a risk factor for fracture [Objective Response (OR) 5.55][17]. Nevertheless, lumbar spine Z score as a standalone parameter for assessing fracture risk in GD1 is problematic. In children with GD1, DXA bone density measurements may be underestimated due to low bone size and growth retardation. In adults older than 50 years, T scores rather than Z scores are a more accurate indicator of osteopenia/osteoporosis and fracture risk. DXA scores may be falsely elevated in the presence of osteophyte formation, bone sclerosis, disk space narrowing, and spondylolisthesis. Consequently, the Gaucher Risk Assessment for Fracture (GRAF) score was developed to estimate fracture risk in patients starting ERT or Substrate Reduction Therapy (SRT) based on demographic and disease-related factors including sex, age at treatment initiation, time interval between age at diagnosis and age at treatment initiation, splenectomy status, and pre-treatment history of bone crises [Figure 1][18]. GRAF score is used most effectively only in conjunction with DXA and other non-GD-specific risk factors (e.g., smoking, alcohol intake, frailty).
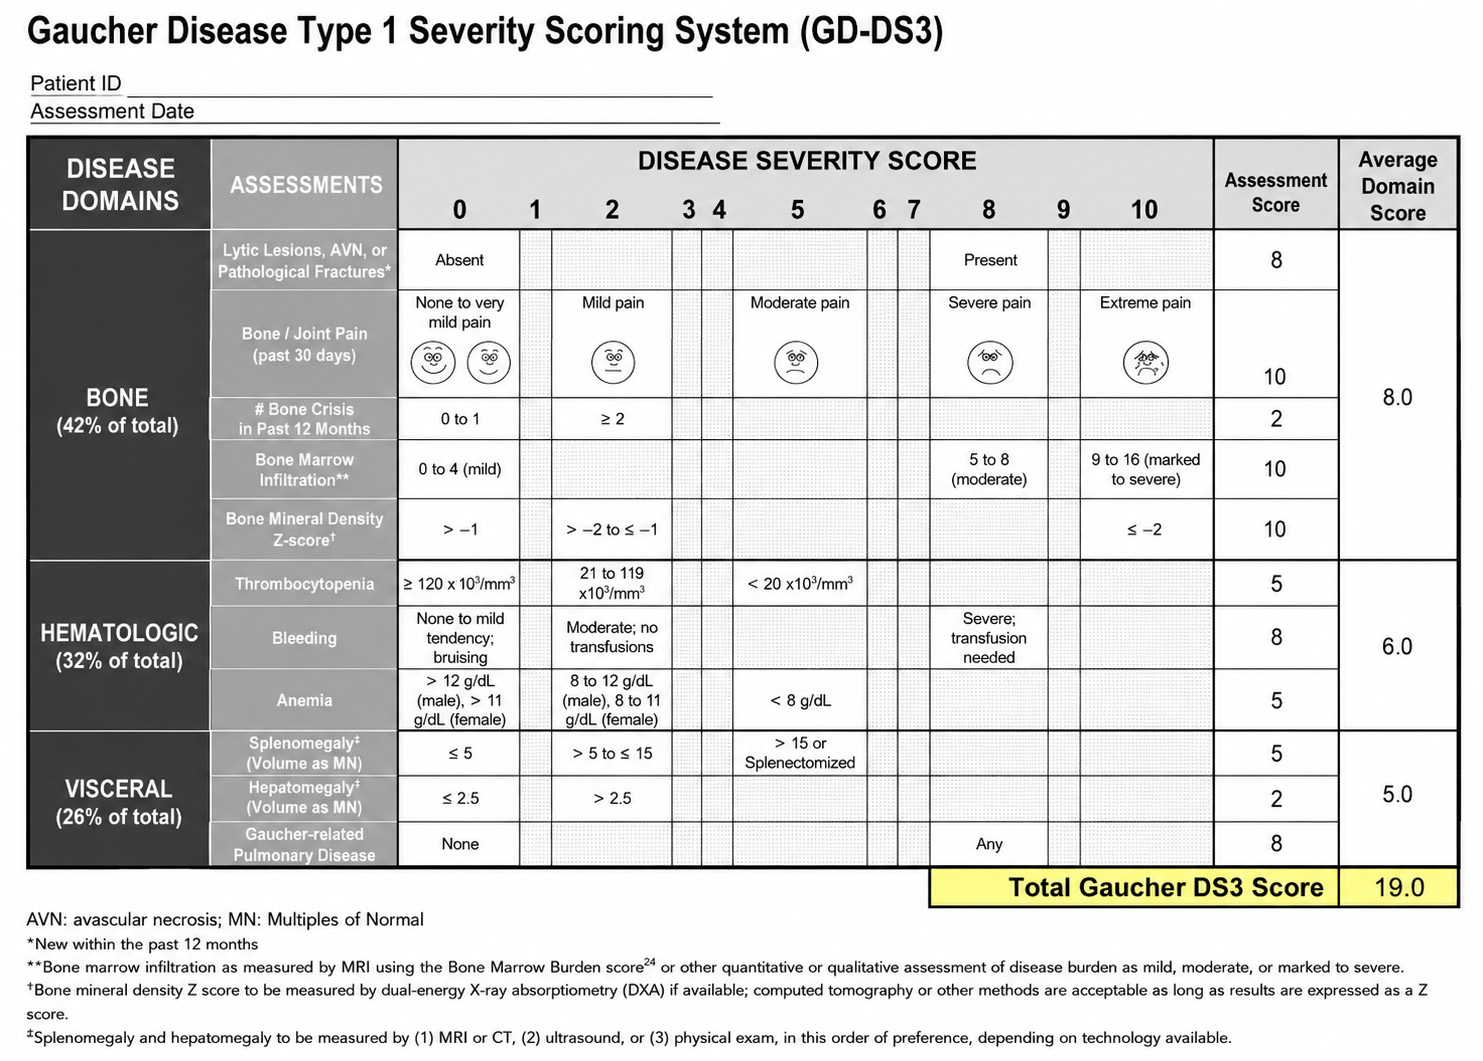
Figure 1. Weighted calculation of DS3 scores for the bone, hematologic, and visceral domains. Note the change in the assessment of bone mineral density as explained in the text. Reproduced from Weinreb et al.[19]. DS3: Disease severity scoring system; MRI: magnetic resonance imaging; DXA: dual-energy X-ray absorptiometry; BMB: bone marrow burden; CT: computed tomography; AVN: avascular necrosis.
Separately, the Disease Severity Scoring System (DS3) integrates multisystem manifestations of GD1, including skeletal involvement and DXA, and has been validated as a measure of overall disease burden and treatment response[18,19]. Whether DS3 predicts fracture risk, and how it compares with or complements GRAF has not been previously examined. Therefore, using retrospective data from the DS3 validation study[19], we investigated whether pre-treatment DS3 scores predict fracture risk in adults with GD1 receiving ERT, whether DS3 outperforms GRAF, and whether combining both measures improves predictive accuracy.
METHODS
This study was performed as part of the research titled “Validation Study of a Severity Score Index (DS3) for Adult Patients with type 1 Gaucher disease” (URFLSD-.2010-01) after review of the protocol (WIRB® Protocol #20100371) and approval of the patient informed consent form dated March 23, 2010 by the Western Institutional Review Board (WIRB®, now WCG IRB Connexus, Seattle, WA, USA). All consent forms were signed by the patients. The signed consent form includes patient permission to publish aggregate anonymized results in scientific journals.
Patient recruitment, eligibility, and calculation of the DS3 scores have been described previously[19]. The DXA and Magnetic Resonance Imaging (MRI) bone marrow infiltration lack of availability was anticipated when the DS3 score was initially formulated and the score, when appropriately modified, was validated even in the absence of these two elements[18]. Patient eligibility was contingent on enrollment in the ICGG Registry between 1991-2009. IRB-approved consent forms allowed future retrospective investigations. The study cohort comprised 133 adult patients with GD1. Demographic characteristics are shown in Table 1. Comparison with other large population ICGG studies[16,20] indicates that the DS3 study population is demographically representative in terms of sex, age at diagnosis, age at first treatment, GBA1 genotype distribution, and percentage of patients with a history of splenectomy [Table 2]. DS3 scores were calculated retrospectively using registry and study-specific data according to published criteria [Figure 1 and Supplementary Table 1][18]. Disease severity was categorized as mild (< 3), moderate (3-5.9), or marked (≥ 6). Fractures are entered in the Registry database based on radiological evidence as reported by the site investigator. A distinction among pathological, fragility, or non-fragility fractures is not included because detailed clinical information about the circumstances is not captured in the case report forms.
Baseline (pre-treatment) characteristics of 133 treated patients with GD1 by investigative site[19]
| Total | South Florida | Toronto | Atlanta | Los Angeles | Pittsburgh | |
| Patients: N | 133 | 61 | 25 | 15 | 24 | 8 |
| Patients with splenectomy: n (%) | 39 (29.3) | 17 (27.9) | 8 (32.0) | 5 (33.3) | 5 (20.8) | 4 (50.0) |
| Women: n (%) | 81 (61) | 36 (59) | 18 (72) | 10 (66.7) | 11 (45.8) | 6 (75) |
| Ethnicity: n (%) | ||||||
| Ashkenazi Jewish | 68 (51.1) | 45 (73.8) | 4 (16.0) | 3 (20.0) | 15 (62.5) | 1 (12.5) |
| Part Ashkenazi | 13 (9.8) | 7 (11.5) | 1 (4.0) | 1 (6.7) | 4 (16.7) | 0 |
| Non-Jewish | 44 (33.1) | 9 (14.8) | 19 (76.0) | 8 (53.3) | 2 (8.3) | 6 (75.0) |
| Unknown | 8 (6.0) | 0 | 1 (4.0) | 3 (20.0) | 3 (12.5) | 1 (12.5) |
| Age at diagnosis (y) | ||||||
| Mean (SD) | 29.7 (18.8) | 34.6 (21.2) | 17.0 (19.2) | 30.7 (14.1) | 32.0 (18.4) | 23.4 (19.1) |
| Age at first treatment (y) | ||||||
| Mean (SD) | 44.5 (18.8) | 52.2 (16.9) | 33.5 (19.3) | 37.3 (17.2) | 43.1 (16.3) | 38.5 (19.0) |
| Years on treatment | ||||||
| Mean (SD) | 13.3 (6.1) | 13.3 (6.0) | 12.0 (5.6) | 14.3 (6.4) | 12.8 (6.8) | 17.0 (4.6) |
| Current age (y) | ||||||
| Mean (SD) | 57.8 (18.4) | 65.5 (15.5) | 45.5 (18.9) | 51.6 (18.8) | 55.9 (16.5) | 55.5 (19.2) |
| Genotype: N (%)* | ||||||
| N370S/N370S | 52 (39.1) | 35 (57.4) | 3 (12.0) | 5 (33.3) | 8 (33.3) | 1 (12.5) |
| N370S/L444P | 24 (18.1) | 8 (13.1) | 7 (28.0) | 5 (33.3) | 2 (8.3) | 2 (25.0) |
| N370S/84GG | 7 (5.3) | 4 (6.6) | 2 (8.0) | 0 | 1 (4.2) | 0 |
| N370S/IVS2+1 | 4 (3.0) | 3 (4.9) | 0 | 0 | 0 | 1 (12.5) |
| N370S/other | 31 (23.3) | 9 (14.8) | 10 (40.0) | 4 (26.7) | 7 (29.2) | 1 (12.5) |
| L444P/other | 3 (2.2) | 1 (1.6) | 1 (4.0) | 0 | 0 | 1 (12.5) |
| L444P/L444P | 1 (0.75) | 0 | 1 (4.0) | 0 | 0 | 0 |
| Other/other | 5 (3.8) | 1 (1.6) | 1 (4.0) | 1 (6.7) | 0 | 2 (25.0) |
| Unknown/missing | 6 (4.5) | 0 | 0 | 0 | 6 (25.0) | 0 |
| Baseline DS3 score | ||||||
| Mean (SD) | 5.6 (2.6) | 5.6 (2.5) | 6.6 (2.9) | 4.4 (2.3) | 4.8 (2.4) | 7.2 (2.0) |
Demographic comparison showing that the DS3 study population is representative of the North American GD population depicted in other studies with larger numbers of patients
GRAF scores were calculated for each of the 133 patients enrolled in the DS3 study with the tool illustrated in Figure 2 and per the instructions in Deegan[16].
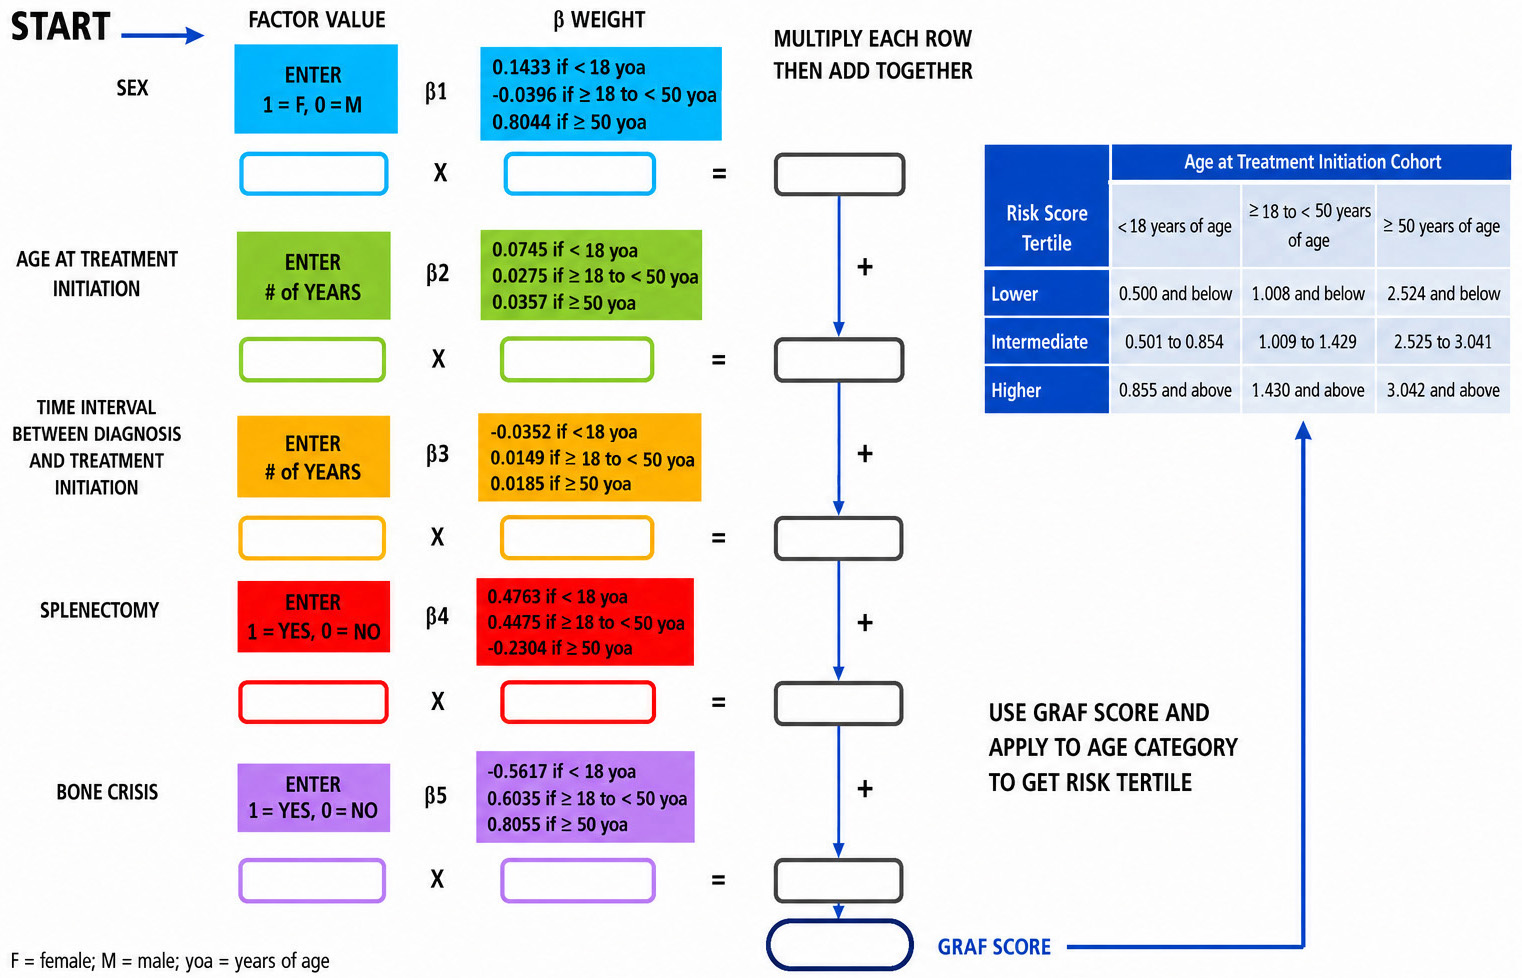
Figure 2. Algorithm for calculation of the Gaucher Risk Assessment for Fracture (GRAF) score. Reproduced with permission from Deegan et al.[16].
Statistical analyses included non-parametric tests, χ2 testing with Holm correction for multiple comparisons, Kaplan-Meier survival analysis, and sensitivity analyses. In fracture-free Kaplan-Meier (KM) survival analyses, statistical significance was defined as a two-sided P value < 0.05 after Holm correction.
Receiver Operating Characteristic (ROC) analysis was used to assess the ability of baseline disease severity indices to predict fractures occurring during ERT in our GD1 patient population. Three predictors were evaluated: (1) the continuous DS3 score, (2) the ordinal GRAF score (1 = mild, 2 = moderate, 3 = severe), and (3) a combined model incorporating both measures via multivariate logistic regression.
ROC curves were constructed for each predictor and stratified by age at treatment initiation (< 18, 18-49, and ≥ 50 years). The area under the ROC curve [area under the curve (AUC)] was used as a summary measure of discriminative performance. The optimal threshold for classification was determined using Youden’s index (J = sensitivity + specificity - 1). To assess statistical uncertainty, 95% confidence intervals (CIs) for AUC values were derived using nonparametric bootstrapping (2,000 resamples). For comparison between predictors, a bootstrap-based approximation of the DeLong test was used to estimate differences in AUC (ΔAUC) between the combined model and each single predictor, with one-sided p-values indicating the likelihood that the observed improvement occurred by chance. AUCs ≥ 0.70 were interpreted as moderate discrimination, while AUCs ≥ 0.85 were considered strong discrimination.
Time to first fracture was also analyzed using Cox proportional hazards regression, with follow-up calculated from baseline assessment to first fracture or last follow-up. Age was entered as a continuous variable because of its established association with fracture risk in the general population. Separate multivariable models were constructed to evaluate baseline DS3 and GRAF in relation to fracture risk after adjustment for age. An exploratory model including age, DS3, and GRAF simultaneously was also examined. Hazard ratios (HRs) and 95%CIs were estimated. Additional sensitivity analyses further adjusted for sex, prior fracture history, and splenectomy status.
All analyses were conducted in Python (v3.11).
RESULTS
One hundred thirty-three treated patients were enrolled. 132 were treated with alglucerase or imiglucerase ERT and 1 with miglustat. The miglustat-treated patient was included in the demographic analyses but was excluded from the fracture-free survival analyses which were restricted to patients treated with ERT. When patients were started on treatment, neither velaglucerase alfa, taliglucerase alfa, nor eliglustat were commercially available although some were switched to velaglucerase alfa between 2009 and 2012.
Of the 133 evaluable patients, 33 (24.8%) experienced at least one fracture during follow-up. Patients with fractures were significantly older at ERT initiation, had longer delays between diagnosis and treatment, and had higher baseline age-adjusted Charlson co-morbidity scores[21,22] and higher DS3 and GRAF scores than those without fractures [Table 3]. Women and patients with prior splenectomy were overrepresented in the fracture cohort. However, there were no inter-group differences regarding GBA1 genotype distributions or baseline weight or body mass index (BMI).
Comparison between cohorts of patients with (N = 33) and without (N = 100) fractures following start of ERT
| Category | Fracture (N = 33) | No fracture (N = 100) | P value at 0.05 | |
| Female sex | 25 (75.8%) | 54 (54.0%) | 0.0239 | Z-test |
| Current age | 71.0 (10.7) | 53.5 (18.2) | < 0.00001 | t-test |
| Age at diagnosis | 28.3 (18.3) | 30.0 (20.8) | NS | t-test |
| Age at 1st ERT | 54.7 (12.1) | 41.0 (19.3) | 0.0002 | t-test |
| Years from Dx to Rx | 25.9 (16.6) | 11.0 (12.8) | < 0.00001 | t-test |
| Years of follow-up | 17.7 (7.61) | 14.4 (6.8) | 0.02222 | t-test |
| Baseline weight (kg) | 66.2 (13.2) | 69.3 (16.4) | NS | t-test |
| Baseline BMI | 24.5 (3.69) | 24.7 (5.10) | NS | t-test |
| Age adj comorbidity | 2.21 (1.61) | 1.14 (1.59) | 0.0012 | t-test |
| Baseline DS3 | 6.94 (2.20) | 5.14 (2.54) | 0.0004 | t-test |
| Baseline GRAF | 2.33 (0.72) | 1.92 (0.80) | 0.0104 | t-test |
| N370S/N370S | 14 (42.4%) | 40 (40.0%) | NS | χ 2 |
| N370S/other | 14 (42.4%) | 52 (52.0%) | ||
| other/other | 4 (12.1%) | 4 (4.0%) | ||
| Missing | 1 (3.0%) | 4 (4.0%) | ||
| Splenectomy | 16 (48.5%) | 21 (21.0%) | 0.0018 | Z-test |
Two-thirds of the fractures involved the spine, hip, or femur [Table 4]. Twelve patients experienced subsequent fractures, typically at older ages (half ≥ 67 years old). Fracture distribution was similar to that reported in larger registry cohorts[16].
Sites of on-treatment initial fractures and subsequent fractures compared to data in Deegan et al.[16]
| Sites of initial fractures after start of ERT | N (n = 33) | % | Adults (≥ 18 y)* (n = 239) | Subsequent fractures |
| Spine | 12 | 36.4 | 98 (41.0) | 3 |
| Hip and femur | 10 | 30.3 | 49 (20.5) | 5 |
| Shoulder and humerus | 4 | 12.1 | 1 | |
| Elbow and wrist | 4 | 12.1 | 1 | |
| Distal lower extremity | 2 | 6.1 | 4 | |
| Clavicle, ribs | 1 | 3.0 | 3 | |
| All others except spine, hip, femur | 11 | 33.3 | 86 (36.0) | |
| Total | 33 | 239 | 17 |
Baseline DXA data were incomplete in a substantial proportion of patients, most of whom enrolled in the ICGG Registry between 1991-2000 when DXA often was unavailable. This prevented any assessment of the value of pre-treatment lumbar spine Bone Mineral Density (BMD) for predicting overall fracture risk in our patient cohort[17]. Follow-up DXA measurements (osteopenia-osteoporosis combined per Khan et al.[17]) did not differ significantly between fracture cohorts (~ one year prior to a fracture event) and non-fracture cohorts (last follow-up date) (P = 0.85), indicating that as recently shown by Kahwati et al.[23], low Aerial Bone Mineral Density (aBMD) alone was insufficient to explain fracture occurrence [Table 5].
Osteopenia/osteoporosis (DXA) at baseline and at time of fracture [in fracture cohort (N = 33) and at baseline and at latest follow-up for the non-fracture cohort (N=100)]*,#
| Fracture cohort (N = 33) | No fracture cohort (N = 100) | P value | |||
| Normal BMD (DXA) at baseline | 6 | 18.2% | 44 | 44.0% | *0.03 |
| Osteopenia/osteoporosis (baseline) | 8 | 24.2% | 26 | 26.0% | |
| No data at baseline | 19 | 57.6% | 30 | 30.0% | |
| Normal BMD (DXA) at 1st Fx or last F/U | 18 | 54.5% | 60 | 60.0% | 0.85 |
| Osteopenia/porosis at 1st Fx or last F/U | 11 | 33.3% | 30 | 30.0% | |
| No data at 1st Fx or last F/U | 4 | 12.1% | 10 | 10.0% | |
Furthermore, after institution of ERT, improvement in DS3 from pre-treatment scores was disassociated from fracture occurrence [Figure 3]. 23 of 33 fracture patients (69.7%) had pre-treatment DS3 scores in the severe range (DS3 ≥ 6). Five of these had fractures during the first year of treatment. Of the 28 patients whose fractures occurred more than one year after starting ERT, 13 (46.4%) had minimal clinically important improvement in DS3 score as defined in Weinreb[19], before suffering a fracture. Among 10 patients with DS3 < 6, one (baseline DS3 3.25) had a fracture during the first year of ERT (DS3 0.8). Thus, as with DXA, a clinically significant improvement in DS3 did not prevent fracture events in nearly half of the patients who started treatment with DS3 scores indicative of high severity GD1. However, the pre-treatment DS3 score is strongly predictive of continued risk for fractures even after commencement and continued ERT.
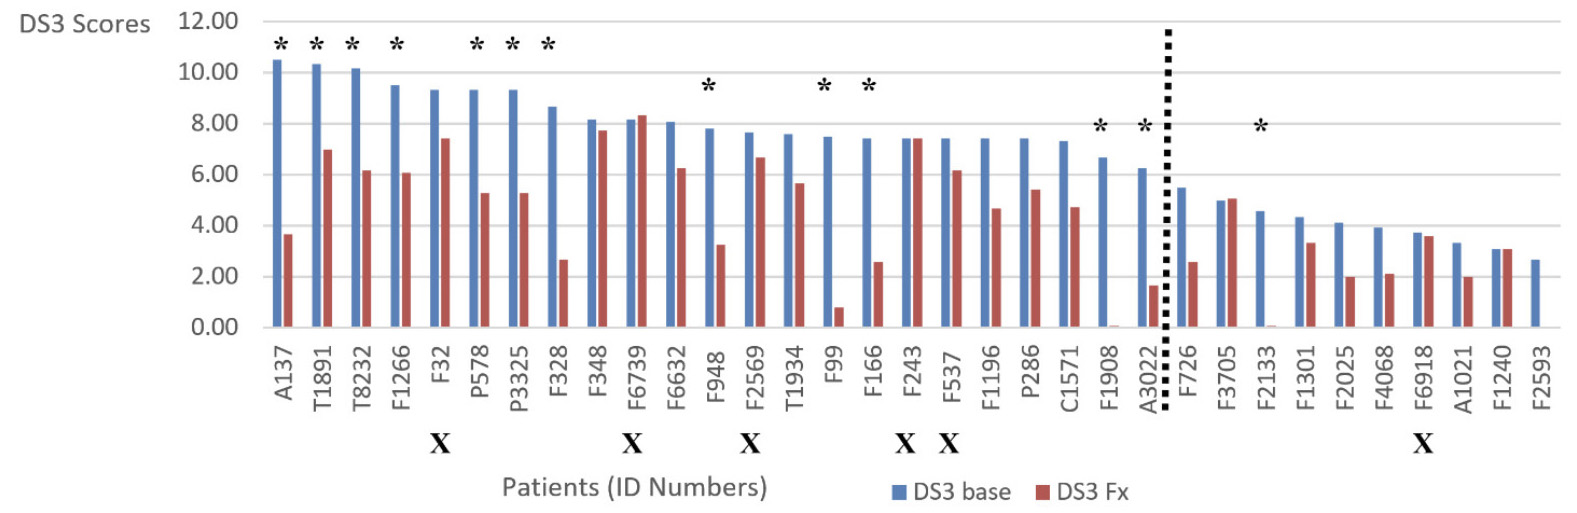
Figure 3. Changes in DS3 scores from pre-treatment (baseline) to one year prior to fracture occurrence. The sub-population in this figure comprises the 33 patients from the total study population of 133 patients who had a fracture after initiation of treatment for GD1. The baseline DS3 scores are shown in blue. DS3 scores recorded approximately one year before a fracture occurred are shown in red. Five patients (designated with an “X” below the patient number) had a fracture during the first year of treatment and were excluded from the subsequent analysis of change in DS3 score. Of the 28 remaining patients, 13 (46.4%) had a decrease in DS3 ≥ 3.15, indicating a minimal clinically important improvement as defined in the literaturex, despite which they nonetheless suffered a fracture. These thirteen patients are designated with asterisks. The vertical green line separates the 23 patients with a baseline DS3 ≥ 6.00 (severe severity) from the 10 patients with a lower baseline score. Of these, one patient had DS3 < 3.00. The other nine had baseline DS3 3.00-5.99 (moderate severity). DS3: Disease severity scoring system.
Fracture-free survival differed significantly across DS3 severity category [Figure 4 and Supplementary Figure 1], with higher fracture risk among patients with DS3 ≥ 6. This result supports our hypothesis that DS3 that includes bone variables such as DXA, chronic bone pain and crises, osteonecrosis, lytic lesions, and qualitative severity of bone marrow infiltration with Gaucher cells, might outperform GRAF for predicting future fracture risk in treated patients with GD1. However, inclusion of history of pre-treatment fractures could cause confounding due to predictive circularity. Thus, we performed a Kaplan-Meier sensitivity analysis in which fracture-free survival in all patients with a history of pre-treatment fractures (N = 32) was compared to all those with no history of fracture (N = 100). There was no difference between the groups (log rank P = 0.9; Figure 5A). Furthermore, a similar analysis restricted to 58 patients with a baseline DS3 ≥ 6 in whom the on-ERT fracture risk at 10 years was 30% [Figure 4], also showed no difference between those who had a history of pre-ERT fracture and those who did not [Figure 5B]. Thus, it is unlikely that history of prior fracture invalidates DS3 as a predictor of future fracture risk. Furthermore, in exploratory sensitivity analyses associated with the multivariable Cox model that adjusted for sex, prior fracture, and splenectomy status, DS3 remained associated with fracture risk.
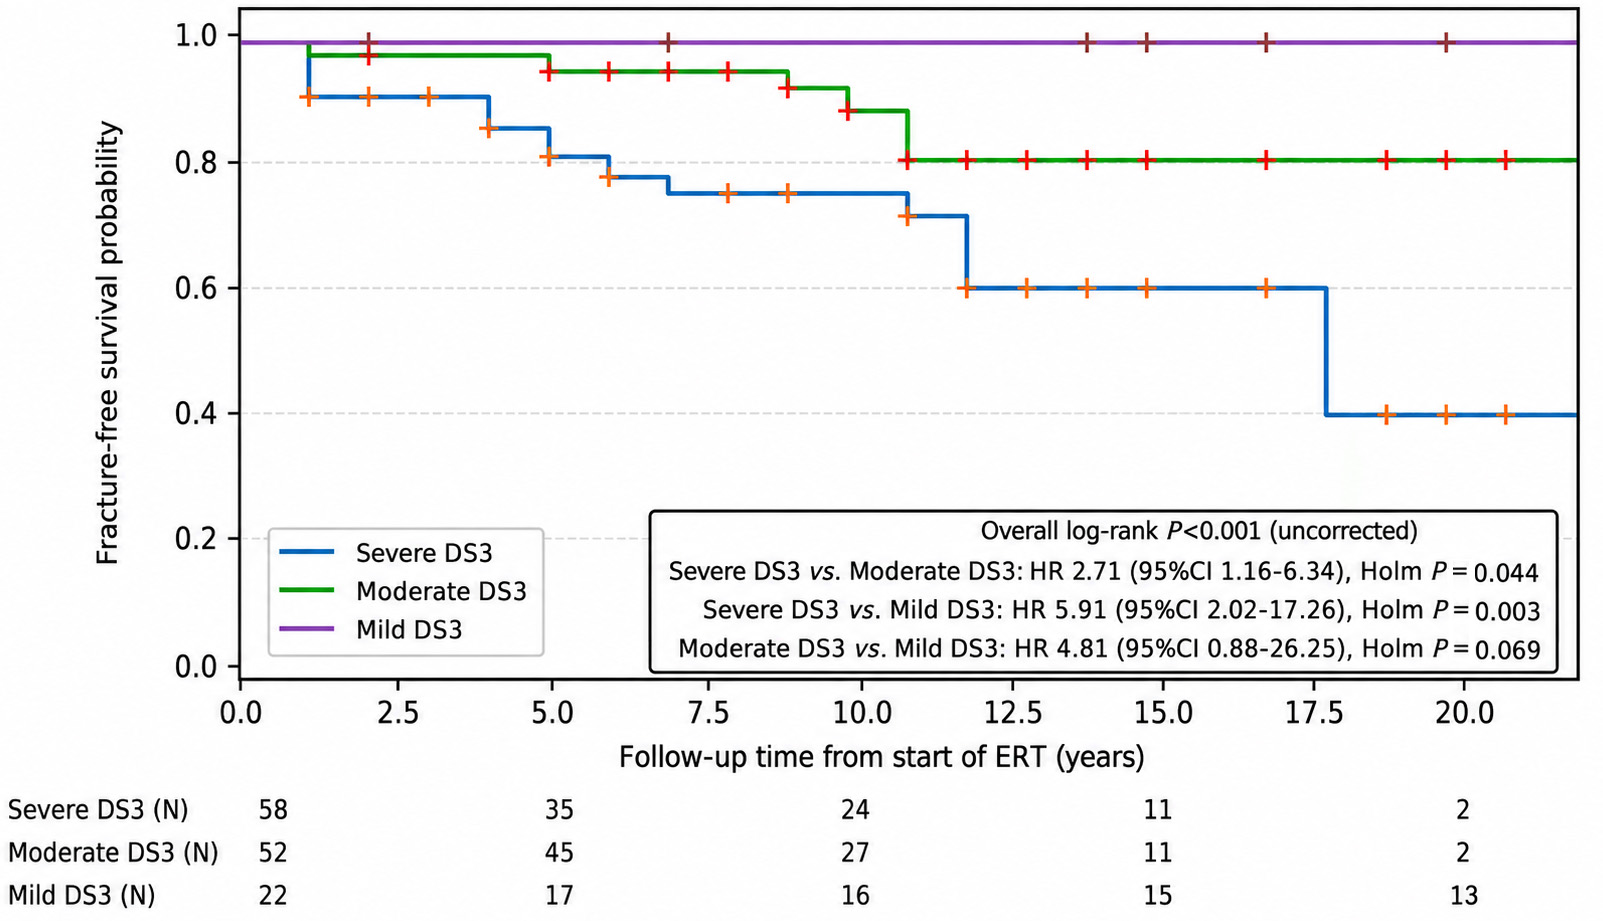
Figure 4. Kaplan-Meier plot of fracture-free survival stratified by DS3 score category. DS3 < 3 (mild); DS3 3- < 6 (moderate); DS3 ≥ 6 (severe). The number of patients at risk at the start of study and after 5, 10, 15, 20 years is shown above the X-axis. P values were calculated by Holm-corrected log rank-χ2 tests with results including the hazard ratios, 95% confidence intervals, and the Holm P values shown in the figure. Based on the Holm P values, the fracture-free survival for the tertile with the highest DS3 scores is significantly less than for the moderate and mild DS3 severity tertiles. The difference in fracture-free survival between the moderate and mild DS3 severity tertiles is borderline, but not statistically significant (Holm P = 0.069). DS3: Disease severity scoring system; ERT: enzyme replacement therapy; CI: confidence interval; HR: hazard ratio.
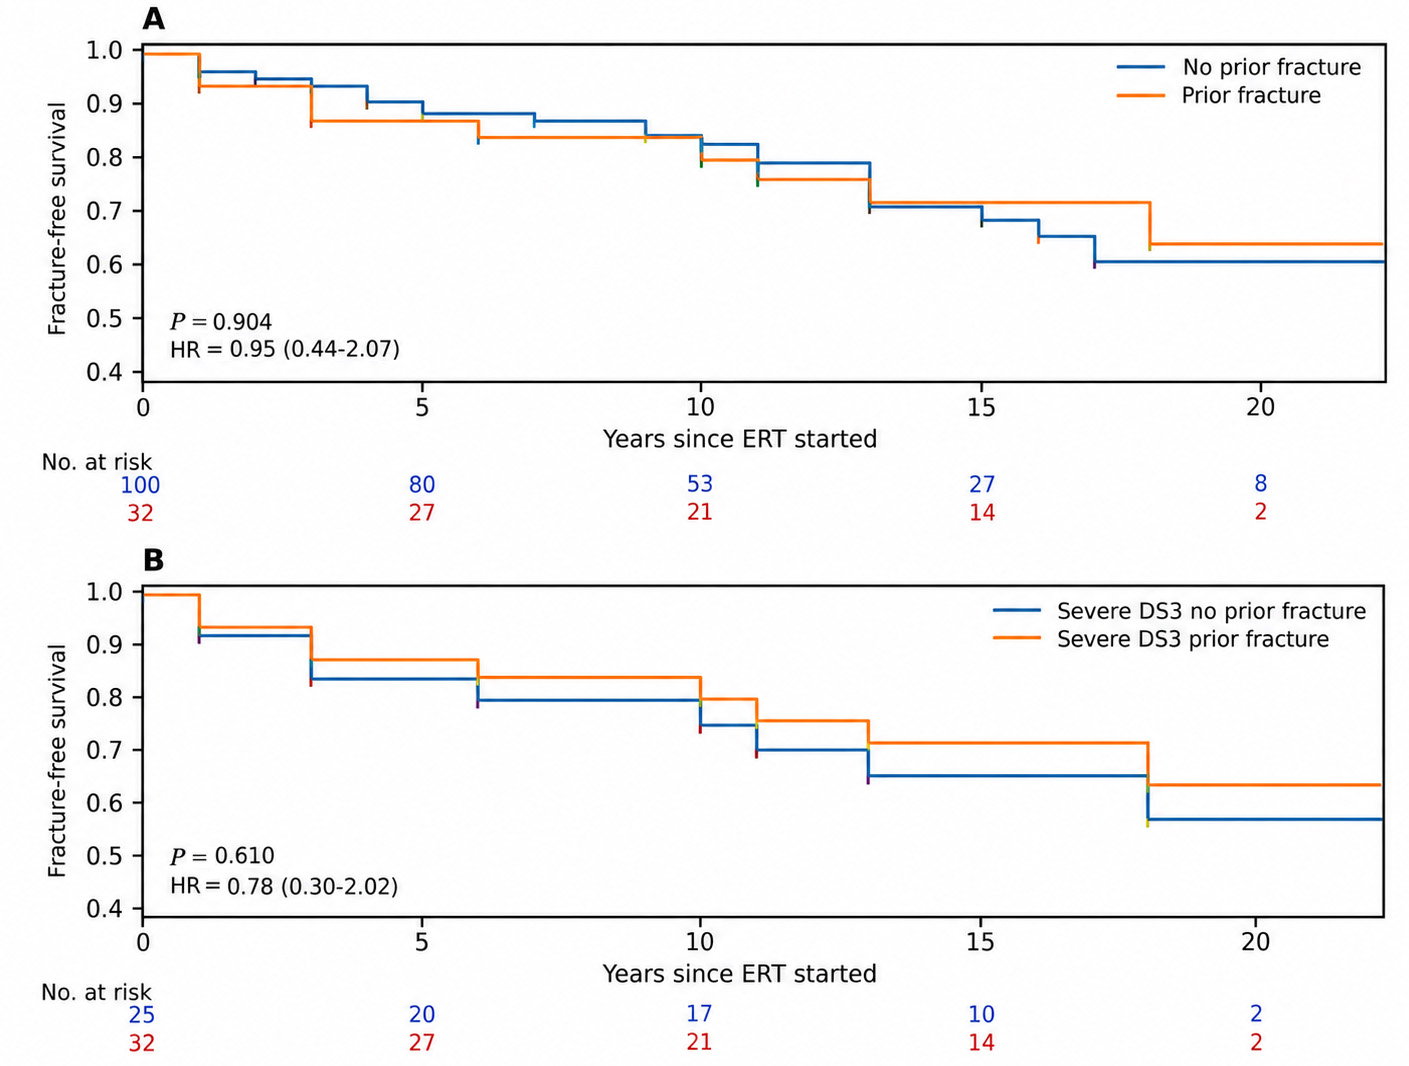
Figure 5. Sensitivity analysis. (A) Kaplan-Meier fracture-free survival plots for 32 patients who had a history of fracture before starting treatment with 100 patients who had no history of pre-treatment fracture. The number of patients at risk at the start of study and after 5, 10, 15, 20 years are shown above the X-axis. P values were calculated by Holm-corrected log rank-χ2 tests; (B: post-treatment fracture-free survival in 25 patients with a history of pre-ERT fractures and 32 with no such history. This analysis was restricted to patients with baseline DS3 ≥ 6 (i.e. severe disease). DS3: Disease severity scoring system; ERT: enzyme replacement therapy; HR: hazard ratio.
In the GRAF score Kaplan-Meier fracture-free survival analysis [Figure 6], although the overall log-rank test was significant, pairwise comparisons among GRAF tertiles were not statistically significant after Holm correction. Although the fracture-free survival curves suggest that DS3 outperforms GRAF for fracture risk assessment, the fracture risks at 5, 10 and 15 years are not that discrepant [Table 6]. The differences in the fracture-free survival curves may partly be a function of patient population differences between the DS3 and GRAF sub-groups as each GRAF tertile had an admixture of patients with variable DS3 scores and vice versa [Figure 7]. More importantly, the GRAF score calculation is age dependent and, unlike DS3, patients are assigned a different risk category according to the age at which treatment for GD is initiated (< 18 years; 18-50 years; > 50 years)[16]. This accords with accepted knowledge that, increasing chronological age, especially after age 50-60 years, is an important fracture risk factor, although it is a complex surrogate biomarker comprising menopausal status in women, prevalence of falling, nutritional status, frailty, level of physical activity, and concurrent illnesses and medications [24].
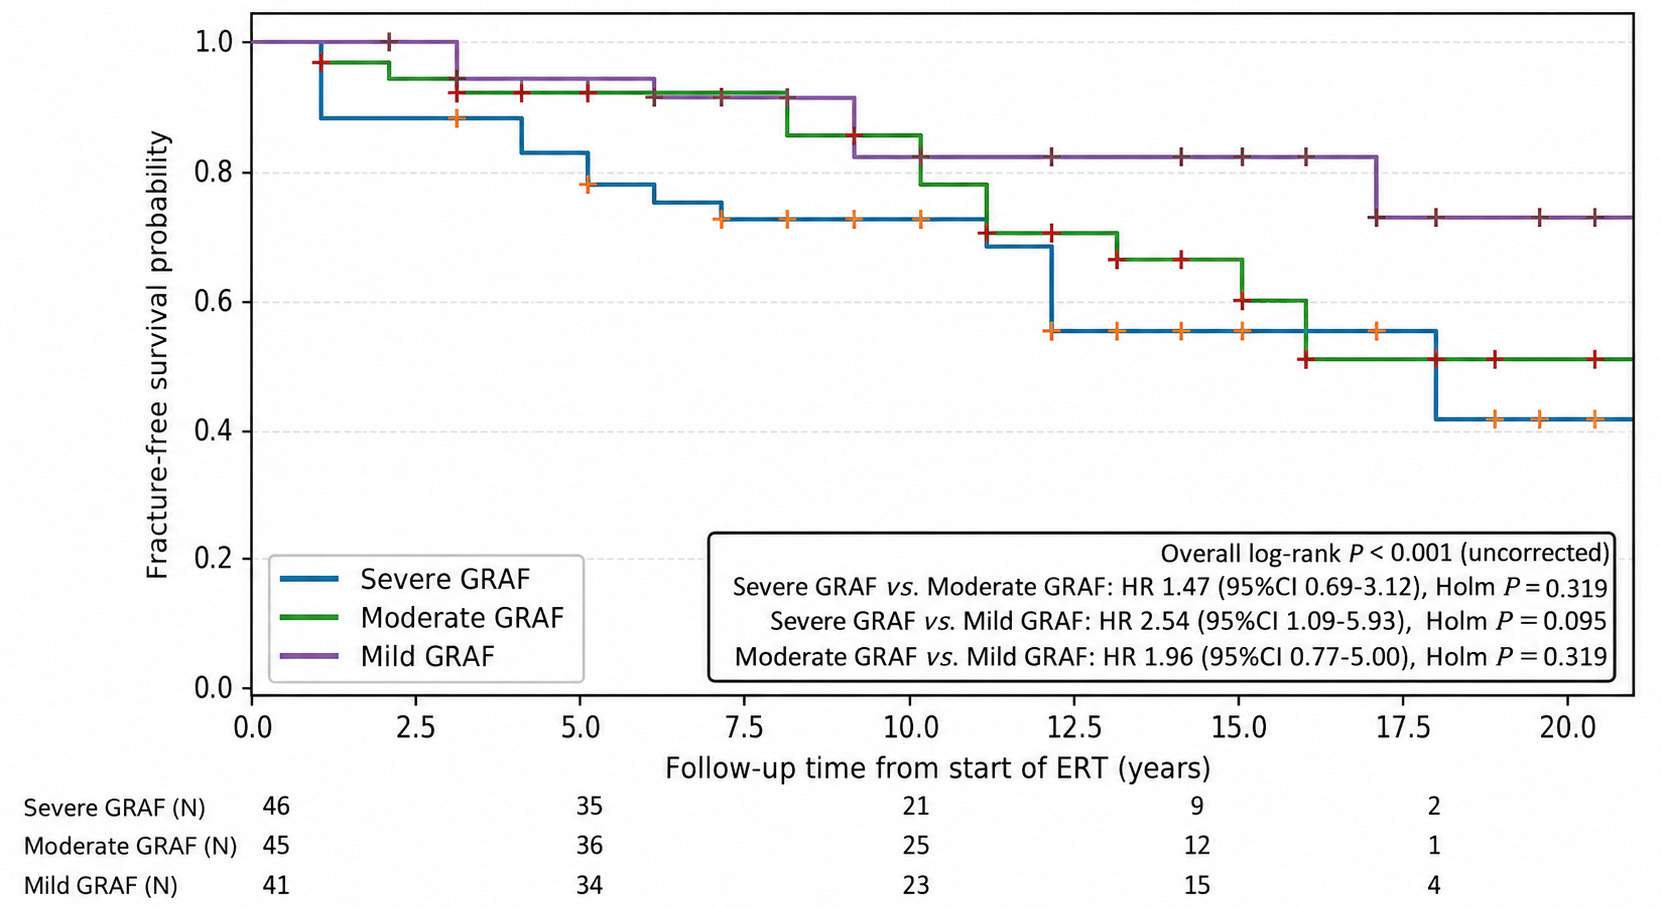
Figure 6. Kaplan-Meier plot of fracture-free survival stratified by GRAF score risk category. 3 = marked; 2 = moderate; 1 = mild. The number of patients at risk at the start of study and after 5, 10, 15, 20 years is shown beneath the X-axis. P values were calculated by log rank-χ2 tests as explained in the legend to Figure 4. P values for pairwise comparisons are Holm-corrected; although the overall log-rank test is significant, pairwise differences between groups were not statistically significant after correction. GRAF: Gaucher risk assessment for fracture; ERT: enzyme replacement therapy; CI: confidence interval; HR: hazard ratio.
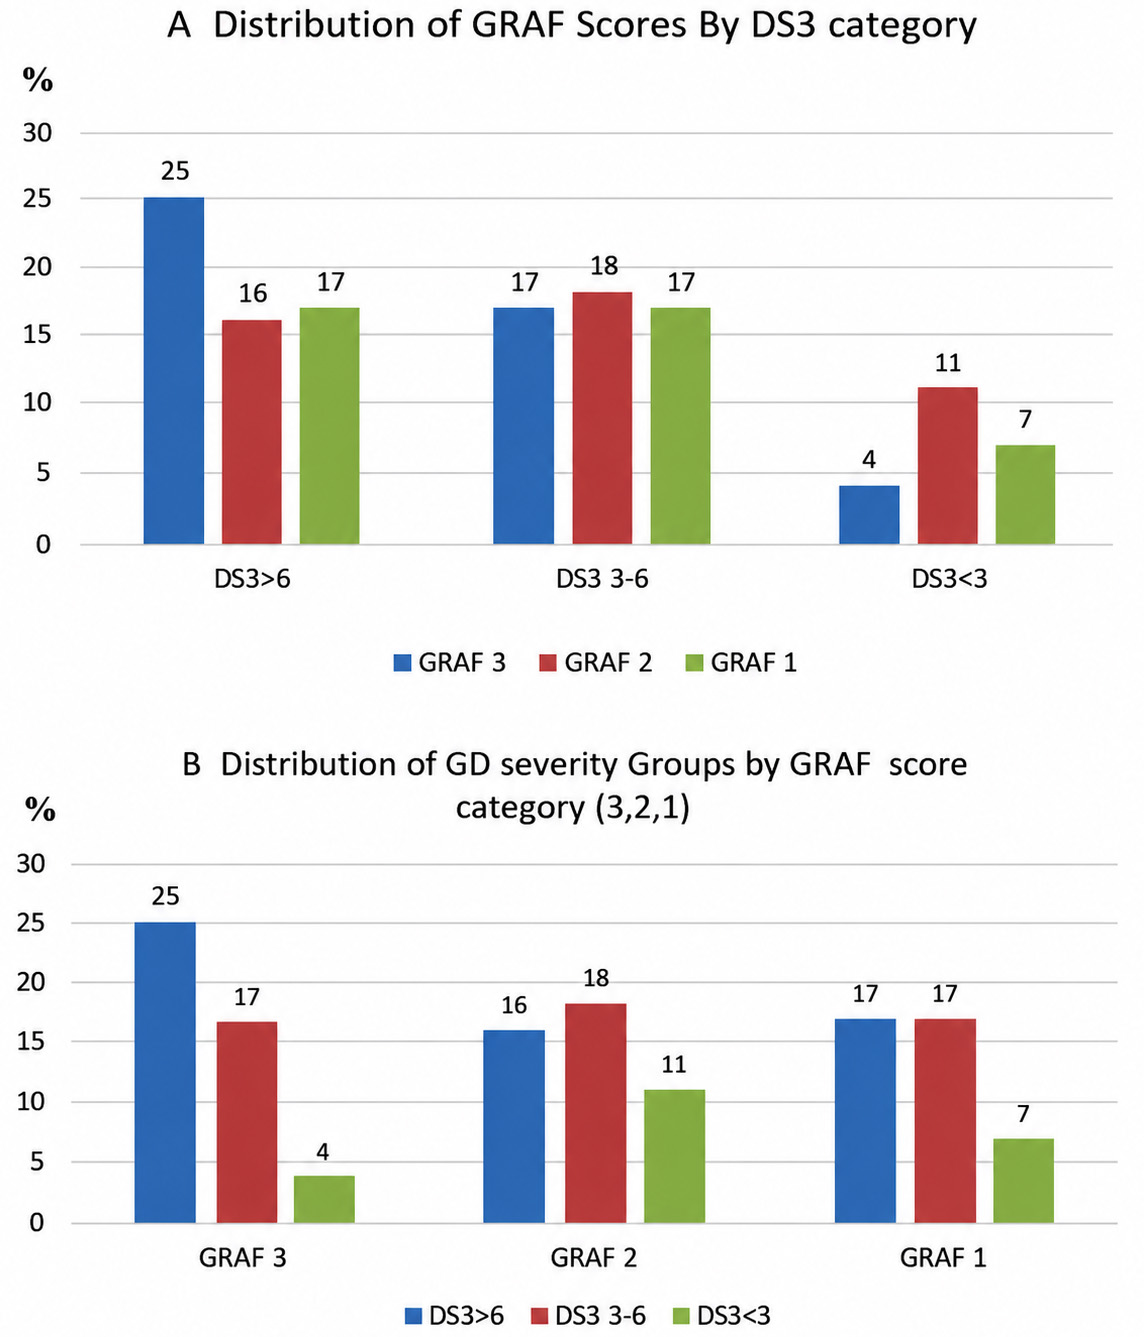
Figure 7. (A) Distribution of GRAF scores by DS3 category (3,2,1); (B) Distribution of DS3 severity groups by GRAF score risk category (3,2,1). For GRAF risk categories, 3 = high; 2 = intermediate; 1 = low. For DS3 severity categories, 3 = marked; 2 = moderate; 1 = mild. GRAF: Gaucher risk assessment for fracture; DS3: disease severity scoring system; GD: Gaucher disease.
Fracture risk predicted by either GRAF or DS3 after initiation of ERT (%)
| Pts at risk (N) | High risk category % | Intermediate risk category % | Low risk category % | |||||
| Year | DS3 | GRAF | DS3 ≥ 6 | GRAF3 | DS3 3-6 | GRAF2 | DS3 < 3 | GRAF1 |
| 5 | 107 | 105 | 20.5 | 20.5 | 9.6 | 9.8 | 0.0 | 5.6 |
| 10 | 79 | 69 | 28.7 | 25.5 | 15.7 | 22.7 | 0.0 | 15.0 |
| 15 | 37 | 41 | 44.0 | 42.0 | 29.5 | 35.3 | 0.0 | 19.8 |
| 20 | 8 | 18 | 58.6 | 42.0 | 29.5 | 44.6 | 20.0 | 28.7 |
We therefore separated each DS3 severity group (severe, moderate, mild) and assessed the risk of fracture 10 years after start of ERT depending on whether treatment was initiated < 18 years, between 18-49 years, or ≥ 50 years [Table 7]. The only patients at risk for fracture were those older than 50 years with baseline DS3 scores indicative of moderate or high severity and younger adults with baseline DS3 scores ≥ 6. Forty-nine percent of the patients with high severity scores who started treatment when older than 50 years, suffered a fracture within 10 years, a result consistent with that recently reported by Stiles[25]. None of the 12 patients who started ERT during childhood or adolescence suffered a fracture during the 10 years from baseline. Additionally, regardless of the age at which treatment was begun, no patient with a low severity score had a fracture 10 years from baseline (although one patient in the > 50 age group did have a fracture event 16 years after starting ERT).
Chance of having a fracture 10 years after starting GD treatment (DS3 severity groups stratified by age groupings)
| DS3 group N = 132 | Start Rx < 18 y/o N = 12 | Start Rx 18-49 y/o N = 61 | Start Rx ≥ 50 y/o N = 59 |
| Low severity N = 22 | 0% n = 1 | 0% n = 13 | 0%* n = 8 |
| Moderate severity N = 52 | 0% n = 4 | 6% n = 21 | 26% n = 27 |
| High severity N = 58 | 0% n = 7 | 16% n = 27 | 49% n = 23 |
ROC analysis showed that both the baseline DS3 score and the GRAF score moderately predicted fracture risk (AUC ~0.76, 0.66 respectively) [Figure 8, Supplementary Tables 2 and 3]. For patients starting treatment between ages 18-49 years, the combined logistic model incorporating both DS3 and GRAF improved discrimination to an AUC of 0.77 (95%CI, 0.73-0.86), representing a mean ΔAUC of +0.04-0.09, which was statistically significant by bootstrap comparison (P < 0.05). Among patients aged ≥ 50 years, the DS3 and GRAF models yielded AUCs of 0.74 (95%CI, 0.66-0.82) and 0.62 (95%CI, 0.61-0.79), respectively. The combined model showed modest improvement (AUC = 0.76, 95%CI, 0.70-0.85), though the gain over single predictors was smaller (P ≈ 0.10). No reliable estimates could be derived for patients who began therapy before age 18, due to the absence of fracture events. Thus, both DS3 and GRAF individually predict fracture risk with moderate accuracy, and in combo, modestly enhance predictive performance, particularly in adults treated before age 50.
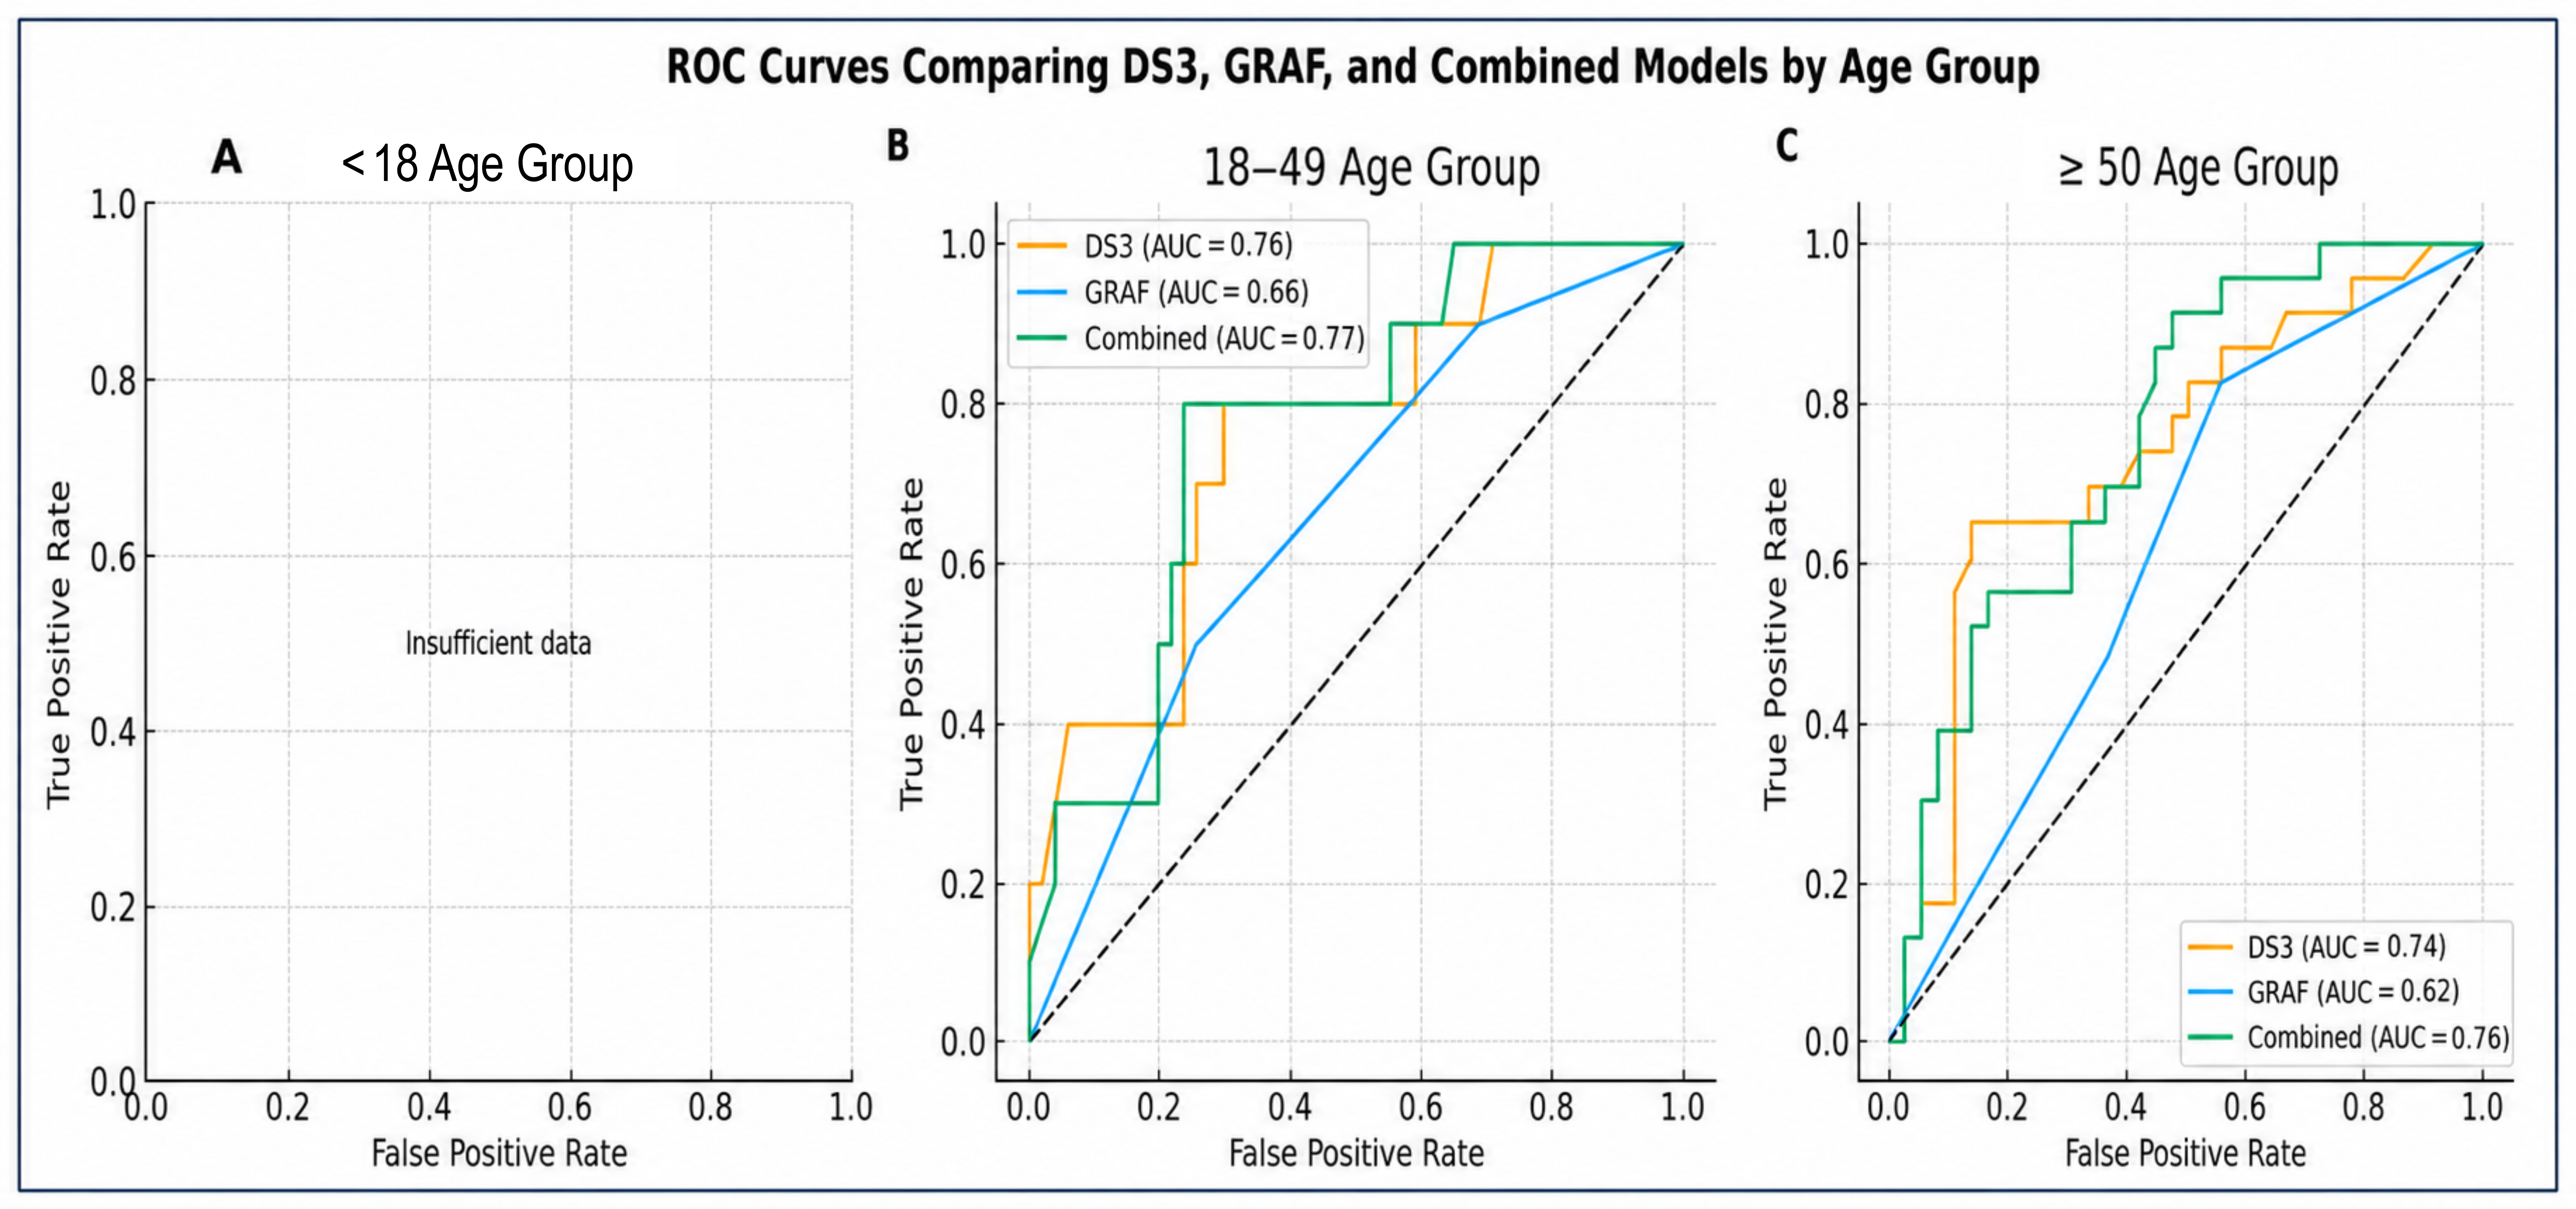
Figure 8. Receiver Operating Characteristic (ROC) curves for DS3, GRAF, and Combined (DS3 + GRAF) models predicting fracture risk during enzyme replacement therapy. Panels (A-C) depict ROC curves for each age-at-treatment group: A: < 18 years; B: 18-49 years; and C: ≥ 50 years. Each panel compares the predictive performance of the DS3 score (continuous), GRAF score (ordinal 1-3), and the combined logistic model incorporating both measures. The area under the curve (AUC) is shown for each model. The combined model modestly improved discrimination relative to single predictors, particularly in adults who began therapy before age 50, as indicated by the bootstrap-derived ΔAUC and P-values. Dashed diagonal lines represent the reference line for random classification. GRAF: Gaucher risk assessment for fracture; DS3: disease severity scoring system.
ROC/AUC shows how well a score discriminates between patients who do and do not fracture. It does not directly account for follow-up time, censoring, or whether a score predicts fracture independently of age. To address this, time-to-event analyses were performed using Cox proportional hazards regression with age included as a continuous variable. Here, baseline DS3 remained independently associated with fracture risk (HR, 1.21 per 1-point increase; 95%CI, 1.08-1.35; P = .0006). Age was also independently associated with fracture risk in this model (HR, 1.06 per year; 95%CI, 1.03-1.08; P < 0.001). In a separate model including age and GRAF, GRAF was significantly associated with fracture risk (HR, 2.33 per unit increase; 95%CI, 1.31-4.16; P = 0.004), whereas age was no longer statistically significant. This finding is consistent with the fact that age is incorporated directly into the GRAF score, and age and GRAF were strongly correlated (r = 0.84), indicating substantial overlap between these predictors. Direct comparison of hazard ratios between DS3 and GRAF should be interpreted cautiously because the scores are measured on different numerical scales and capture different underlying constructs. DS3 primarily reflects Gaucher disease severity across multiple organ systems, whereas GRAF incorporates age and history of splenectomy and bone crises to estimate fracture risk. Thus, differences in HR magnitude do not necessarily indicate superior predictive performance.
Discrimination of the Cox models was assessed using Harrell’s C-index. The age-adjusted DS3 model demonstrated a C-index of 0.80, compared with 0.78 for the age-adjusted GRAF model. Inclusion of both scores together resulted in only minimal improvement in discrimination (C-index 0.80), suggesting limited incremental predictive value of combining the two measures. Thus, pre-treatment baseline DS3 is a modestly stronger predictor of fracture risk in patients on ERT than GRAF score (KM survival and ERT), GD1 severity itself contributes to skeletal fragility beyond the effect of aging alone (COX), and inclusion of both scores together resulted in only minimal improvement in discrimination (ROC, C-index comparison).
DISCUSSION
Observations
The GRAF risk score is the first tool for quantifying risk for fragility fractures after a patient with GD1 starts ERT. It was also designed for use in medically deprived countries where access to MRI and DXA technologies is at best limited[16]. Nonetheless, the GRAF authors recognized the additional importance of adding DXA BMD measurements and Fracture Risk Assessment Tool (FRAX) scores when available with the caveat that techniques that were not originally designed for GD1 require further validation testing in GD-specific populations[16]. The DS3 integrates multisystem manifestations of GD1, including skeletal involvement and DXA, and has been validated as a measure of overall disease burden[18,19]. Because the GRAF score does not incorporate elements of GD skeletal disease that are captured by DS3 (bone pain, osteonecrosis, lytic lesions, bone marrow infiltration), we hypothesized that DS3 score in a yet untreated patient with GD1 would provide additive value to GRAF as a predictor of fracture risk after initiation of ERT. To our best knowledge, fracture-free survival in ERT-treated patients with GD1 as a function of DS3 or other GD severity score[26-30] has not been investigated. Additionally, because, unlike GRAF, DS3 was shown to correlate with disease progression and therapeutic response[19,31], we also reviewed the DS3 study data to test the hypothesis that improvement in DXA and DS3 scores prevents fractures in ERT-treated patients.
This study demonstrates that pre-treatment DS3 score predicts fracture risk in ERT-treated adults with GD1 and provides additive value to the GRAF score. This conclusion was supported by the initial Kaplan-Meier analyses of fracture-free survival, but whose statistical power was weakened by relatively low patient numbers and the small number of fracture events. Moreover, unlike GRAF, DS3 for adult patients is age and sex blind. In our cohort, women were equally over-represented among patients with and without fractures. However, age stratification demonstrated that fracture risk increased markedly in patients initiating ERT at ≥ 50 years, particularly among those with higher DS3 scores. Conversely, no fractures occurred within 10 years among patients who began ERT before age 18. This is consistent with observations that, in general, patient age is a very important determinant of fracture risk particularly in post-menopausal woman and in geriatric patients regardless of sex[32]. Thus, age and a careful assessment for frailty, balance, gait, risk for falls, and muscle mass should be considered independently of DS3 or GRAF scores when discussing risk for fractures even after a decision to start ERT/SRT has been agreed on between physician and patient. With that caveat in mind, the age-stratified ROC analyses confirm our hypothesis that the pre-treatment DS3 score is predictive of fracture risk in ERT-treated patients with GD1 and that combined use of DS3 and GRAF provides a modest but clinically dubious improvement in fracture risk prediction.
The Cox regression models provide important additional insight. When age was included as a continuous covariate, DS3 remained significantly associated with time to fracture, suggesting that Gaucher disease severity itself contributes to skeletal risk beyond the effect of aging alone. In contrast, the association between age and fracture risk was attenuated when GRAF was included in the model, consistent with the fact that age is an explicit component of the GRAF score. Direct comparison of hazard ratios between DS3 and GRAF should be interpreted cautiously because the scores are measured on different numerical scales and capture different underlying constructs.
The model including both DS3 and GRAF suggested that the two scores may capture partially overlapping but not identical aspects of fracture risk. DS3 may reflect disease-related skeletal vulnerability, whereas GRAF represents a broader composite risk measure incorporating age, sex, and delay starting treatment. However, given the strong correlation between age and GRAF and the relatively limited number of fracture events, the present analysis cannot establish that combined use of both scores provides clinically meaningful improvement in fracture prediction.
There is reasonable concern that our observations may be less relevant to current practice in some countries where with newborn screening programs and increased awareness among pediatricians and geneticists, early diagnosis and early initiation of therapy before 20 years of age may substantially decrease the incidence of skeletal complications including fragility fractures. The strongest evidence for this supposition is from the ICGG GRAF study where adult fracture risk was negligible in patients who started GD treatment before age 18[16], an observation that we replicated here, with the caveat that follow up was rarely longer than 10 years. However, there is still no large, prospective, randomized or registry-based study explicitly designed to compare early (< 20 y) vs adult treatment starters with fracture incidence as a primary endpoint. What is incontrovertible is that diagnostic and therapeutic delays are associated with higher subsequent risk of adult fractures and with osteonecrosis. In a recent Spanish study confirming that delayed initiation of ERT is associated with cumulative and, in many cases, irreversible skeletal damage that may persist despite long-term therapy, the mean ages at diagnosis and start of treatment were 24.6 years and 31.0 years, respectively[33]. Our study included 61 patients who began treatment when 18-49 years old and it was this group in which the ROC-AUC analysis showed the greatest and statistically significant advantage for DS3 over GRAF for predicting subsequent fracture risk. Worldwide, early diagnosis and early access and continuity of treatment for GD1 continue to be problematic and documentation of disease severity as a harbinger of risk for irreversible complications including fractures could be an important determinant for treatment eligibility. Even as Newborn Screening (NBS) and earlier diagnosis becomes more prevalent, it is crucial that children, teenagers and adults in whom treatment is not started at the time of diagnosis because of insufficient severity of current manifestations or failure to conform with treatment guidelines, have regular and lifetime serial expert-driven evaluations so that should disease progression occur, the risk of eventual complications, skeletal or otherwise can be minimized.
Our secondary objective was to examine the hypothesis that DS3 is predictive of fracture risk primarily because DXA-derived aBMD is a heavily weighted component of the overall bone domain severity score[18]. In fact, more than half of fractures occurred in patients with normal DXA aBMD at the time of fracture, underscoring the limitations of relying on DXA alone as a surrogate for skeletal integrity in GD1[34]. This finding is consistent with multiple studies showing that improved DXA aBMD scores are only a partial explanation for decreased risk for vertebral and non-vertebral fractures in osteopenic and osteoporotic patients chronically treated with Federal Drug Administration (FDA)-approved drugs[34-38] and that complex total compartmental bone pathologies that increase brittleness and decrease elasticity likely contribute to susceptibility to fracture independent of BMD. These bone abnormalities include dysmorphic trabecular microarchitecture (number, thickness, connectivity, anisotropy), cortical porosity and thickness, bone geometry (hip axis length, neck-shaft angle, cross-sectional moment of inertia), and bone matrix material properties (microdamage, collagen cross-linking, mineralization heterogeneity) that have rarely if ever been investigated in patients with GD[8]. Although none of these cortical and medullary skeletal pathologies have been incorporated in the DS3 bone domain score, it is possible that parameters other than DXA that are evaluated in DS3 (intensity of bone pain, history of osteonecrosis, lytic lesions, and fractures, and semi-quantitation of bone marrow infiltration with Gaucher cells) may indirectly point to the presence of such pathologies adding to the predictive power of DS3 for fracture risk. However, it should be noted that fractures occurred in our patient cohort even though DS3 scores improved significantly from pre-treatment scores indicating the limitations of using surrogate biomarkers and algorithmic calculations to define the totality of clinical response to treatment[19]. Specifically, our findings cast doubt on the common assumption that DXA score or DS3 score improvement is an adequate measure of the efficacy of ERT/SRT for GD skeletal manifestations including fractures[16].
Limitations
Over the 18 years since ERT was introduced, corresponding to the years of our study, the prevalence of splenectomy, bone crises, and the interval between age at diagnosis and age when treatment was started significantly decreased and continues to do so[20,39]. Post-ERT fractures in patients with GD1 may also be less common[40]. Thus, our estimations of post-treatment fracture risk may need to be re-evaluated using updated data especially if it will be used as a historical benchmark for clinical trials of new GD treatments including gene therapies. Our findings are also relevant only to populations in which the distribution of GBA1 variants and general socioeconomic environment resemble that found in the Caucasian ethnicities in North America[41].
The retrospective design and reliance on registry data introduce potential biases, including inconsistent documentation of fracture events and missing information on treatment adherence or comorbidities. Additional limitations include the loss of statistical power resulting from sub-grouping and stratification by age categories as well as the infrequency and stochastic occurrence of fractures. We were unable to include serum or plasma biomarkers in the risk assessment. Plasma glucosylsphingosine measurements were not available for us at the time of the original study and serum chitotriosidase assays are subject to too much inter-laboratory variation and confounding due to CHIT1 mutations for reliable inter-patient comparisons[42].
The ICGG Registry which was our primary data source does not collect information about risk factors for fractures such smoking, use of alcohol, or concurrent illnesses save for Parkinson disease. Based on BMI measurements, we found no evidence for an excess of frailty in our patients with fractures. Information about use of bisphosphonates in our study population was insufficient for analysis and its absence may have affected our results. The introduction of new bone-strengthening drugs such as teriparatide, denosumab, or romosozumab in more recent years should also be considered when applying our results to the current time. The effect of such adjuvant therapies on fracture risk in patients with GD1 has yet to be studied[43]. Our dataset had no information about general risk factors for osteoporosis and fractures including smoking, excess alcohol intake, poor nutrition including low dietary calcium intake, vitamin D deficiency, inactivity, sarcopenia, history of falling, family history of osteoporosis or frequent fractures, menopausal status and age at menopause, hormone replacement therapy, parathyroid hormone levels, and a comprehensive record of medications in common use that have been linked to fracture risk including corticosteroids, proton pump inhibitors, L-thyroxin, anticoagulants (warfarin), and various antidepressants and anxiolytics[44,45]. The absence of this knowledge either at baseline or at the time of fracture may substantially confound the observed associations and limit causal interpretation. Thus, the predictive model remains incomplete but a multifactorial analysis attempting to incorporate all these variables would require a study population that likely exceeds the currently known number of GD patients worldwide.
Due to patient confidentiality requirements, our study was required to use de-identified data, and we were unable to assess patient-reported outcomes (PROM) in terms of post-fracture functional recovery and health-related quality of life. In the pre-ERT era, pathological fractures were often preceded by osteonecrosis, immobilization and healing was often prolonged, and partial or complete nonunion was common[46]. Orthopedic surgery was sometimes deferred because of concurrent anemia and/or severe thrombocytopenia requiring splenectomy and complicated by peri- or post-operative bleeding and/or infection and often by prolonged or irreversible functional disability[12,47-49]. There is little published information about patient outcomes after GD1-associated fragility fractures in patients treated with ERT/SRT. Of 14 French patients with GD1 who suffered vertebral fractures while receiving ERT, nine had no subsequent chronic back pain. Of the five with continued pain, three had multiple vertebral fractures. No patient had spinal cord compression[13]. Most reports of hip arthroplasty in patients with GD1 concern elective surgery for post-osteonecrosis hip arthritis in middle-aged individuals rather than emergency surgery for fractures. Although outcome reports are generally favorable, especially for first-time surgery rather than revisions, it is noteworthy that retrospective analysis showed that even in patients receiving chronic ERT, those with GD required more intraoperative packed RBC transfusions, more intra-and post-operative platelet transfusions than non-GD arthroplasty patients, and had a higher rate of postoperative infections than matched non-GD1 control patients[50-55]. Beyond annotation of fracture events in patients with GD1, future studies should include information about acute and chronic clinical and functional outcomes, especially for high-risk groups such as the elderly.
Neither our study nor the GRAF score study address the issue of risk for fracture in GD1 patients who have never started ERT/SRT. Dinur et al. described a cohort of 103 Israeli adult GD1 patients with mild disease severity followed for a median 20 (5-58) years of whom none had ever had ERT/SRT[56]. 80.5% were N409S homozygous. The median age at diagnosis of GD1 was ∼20 (0-60) years and most of the patients were younger than 50 years old at the time of last follow-up. Based on DXA LS spine T-scores (N = 71), 40.8% had osteopenia and 9.9% had osteoporosis at last follow-up between 2014-2019. None of the total cohort had any bone complications, presumably including any fragility fractures. Thus, a clinician could reasonably conclude that for a patient with a DS3 score indicative of mild severity, watchful waiting is an acceptable action plan and GD-specific treatment need not be started solely to prevent future fractures. On the other hand, for patients with DS3 scores ≥ 3.00, and especially for those older than 50 years at the time of evaluation, where the risk of future fracture is substantial for those receiving GD-specific therapy, a fortiori reasoning would suggest that the risk for fracture would be even greater should the patient continue untreated.
CONCLUSIONS
Our findings suggest that DS3 captures clinically relevant aspects of Gaucher disease severity that contribute to fracture risk independently of age, supporting its potential utility as a disease-specific marker of skeletal risk in patients with Gaucher disease. In clinical practice, DS3 may be preferred for baseline risk stratification, while GRAF may retain value in settings where full DS3 assessment is not feasible. Combined use of both measures may slightly improve predictive accuracy in patients who start treatment between ages 18-50 years. However, in clinical practice, either DS3 or GRAF in conjunction with the other assessments mentioned above is likely sufficient for assessment of fracture risk. These tools may assist clinicians in identifying higher-risk patients at the time of treatment initiation although DS3, whose total score reflects severity of hematologic, splenic, hepatic, and pulmonary involvement is better suited for that purpose. However, as many other fracture risk variables are not included either in DS3 or GRAF, both should be interpreted as complementary rather than stand-alone predictive tools to assist experienced physicians in making clinical judgements and recommendations. In that regard, scientific evidence confirms that, at least for the present, based both on accumulated personal experience and appreciation of contextual skills, the ability of expert specialist physicians to assess probabilities and identify patients at risk for complications and progressive disease still trumps that of algorithm-educated, large language model artificial intelligence[57].
Our findings support reassessment of DXA-centric monitoring strategies and highlight the need for comprehensive skeletal risk evaluation in GD1 and further study of the applicability of published guidelines for pharmacologic and non-pharmacologic treatments to prevent fractures specifically to patients with GD1[6,58-61]. Thus, even as NBS and earlier diagnosis becomes more prevalent, it is crucial that children, teenagers and adults in whom treatment is not started at the time of diagnosis because of insufficient severity of current manifestations or failure to conform with treatment guidelines, have regular and lifetime serial expert-driven evaluations so that should disease progression occur, the risk of eventual complications, skeletal or otherwise can be minimized. Additional study topics should include patient reported and professional assessments about post-fracture functional recovery and health-related quality of life, efficacy of oral eliglustat versus ERT for prevention of GD1-associated fragility fractures, and critical evaluations of adjunctive interventions such as pharmacotherapies for osteoporosis, vitamin D optimization, and targeted weight-bearing exercises.
DECLARATIONS
Acknowledgments
Thank you to the co-authors of the initial DS3 validation study: Dr. Dominick Amato, Dr. David Finegold, Dr. Evelyn Feingold, Dr. Barry Rosenbloom, Dr. Suma Shankar, and Dr. Zhen Zeng, without whose contributions this study would not have been possible. Even though many years have passed, we continue to miss the wisdom of the late Dr. Paul Fernhoff, who was among the group of initial principal investigators for the DS3 study until his untimely passing in September 2011.
Authors’ contributions
Data and statistical analyses, drafting and editing the manuscript, preparation of figures, graphic abstract, approval of the final manuscript: Scher YY
Study conception and design, data input and analysis, statistical analyses, drafting and editing the manuscript, corresponding author, reply to peer reviewers, approval of the final manuscript: Weinreb NJ
Availability of data and materials
The primary source of data for this study is the ICGG Registry database housed by Sanofi (Cambridge, MA). Because this database is proprietary and privileged, data sharing is not possible by the authors. However, we will be available to answer any questions and to share other aggregated data not subject to copyrights on application to Weinreb NJ,
AI and AI-assisted tools statement
Not applicable.
Financial support and sponsorship
Study expenses were supported by the University Research Foundation for Lysosomal Storage Diseases, Inc., Boca Raton, Florida, USA. The authors received no financial compensation. The original DS3 investigation was supported by a multi-center research grant (Independent Sponsored Study Grant) to the University Research Foundation for Lysosomal Storage Diseases, Inc., Boca Raton, Florida, USA (Weinreb NJ, MD, Director), from Genzyme, a Sanofi company, Cambridge, Massachusetts, USA.
Conflicts of interest
Weinreb NJ has been a compensated consultant for Sanofi, has received research funding from Sanofi and Takeda, and has received speaker bureau compensation from Sanofi and Takeda. Weinreb NJ is the Guest Editor of the Special Issue “Innovations in Gaucher Disease Research: Progress, Perspectives, and Promising Therapies” of Rare Disease and Orphan Drugs Journal and the Associate Editor of Rare Disease and Orphan Drugs Journal. He was not involved in any steps of the editorial processing, notably including reviewer selection, manuscript handling, or decision-making. Scher Y declared that there are no conflicts of interest.
Ethical approval and consent to participate
This study was performed as part of the research titled “Validation Study of a Severity Score Index (DS3) for Adult Patients with type 1 Gaucher disease” (URFLSD-.2010-01) after review of the protocol (WIRB® Protocol #20100371) and approval of the patient informed consent form dated March 23, 2010 by the Western Institutional Review Board (WIRB®, now WCG IRB Connexus, Seattle, WA, USA). All consent forms were signed by the patients.
Consent for publication
The signed consent form includes patient permission to publish aggregate anonymized results in scientific journals.
Copyright
© The Author(s) 2026.
Supplementary Materials
REFERENCES
1. Roh J, Subramanian S, Weinreb NJ, Kartha RV. Gaucher disease-more than just a rare lipid storage disease. J Mol Med. 2022;100:499-518.
2. Grabowski GA, Kishnani PS, Alcalay RN, et al. Challenges in Gaucher disease: perspectives from an expert panel. Mol Genet Metab. 2025;145:109074.
3. Weinreb NJ, Camelo JS, Charrow J, Mcclain MR, Mistry P, Belmatoug N. Gaucher disease type 1 patients from the ICGG Gaucher Registry sustain initial clinical improvements during twenty years of imiglucerase treatment. Mol Genet Metab. 2021;132:100-11.
4. Weinreb NJ, Goker-alpan O, Kishnani PS, et al. The diagnosis and management of Gaucher disease in pediatric patients: Where do we go from here? Mol Genet Metab. 2022;136:4-21.
5. Marcucci G, Zimran A, Bembi B, et al. Gaucher disease and bone manifestations. Calcif Tissue Int. 2014;95:477-94.
6. Hughes D, Mikosch P, Belmatoug N, et al. Gaucher disease in bone: from pathophysiology to practice. J Bone Miner Res. 2019;34:996-1013.
7. Hernandez CJ, Van Der Meulen MC. Understanding bone strength is not enough. J Bone Miner Res. 2017;32:1157-62.
8. Zebaze R, Ebeling PR. Disorganization and Musculoskeletal diseases: novel insights into the enigma of unexplained bone abnormalities and fragility fractures. Curr Osteoporos Rep. 2022;21:154-66.
9. Gupta N, Patel H, Kasmenn M, et al. Temporal and regional trends of fractures in the United States: a review of the global burden of disease database. J Orthop. 2025;62:207-15.
10. Weinreb NJ. The international cooperative Gaucher group (ICCG) Gaucher registry. Best Pract Res Clin Haematol. 2023;36:101522.
11. Charrow J, Andersson HC, Kaplan P, et al. The gaucher registry: demographics and disease characteristics of 1698 patients with Gaucher disease. Arch Intern Med. 2000;160:2835.
12. Deegan PB, Pavlova E, Tindall J, et al. Osseous manifestations of adult Gaucher disease in the era of enzyme replacement therapy. Medicine. 2011;90:52-60.
13. Javier R, Hachulla E, Rose C, et al. Vertebral fractures in Gaucher disease type I: data from the French “Observatoire” on Gaucher disease (FROG). Osteoporos Int. 2010;22:1255-61.
14. Stirnemann J, Vigan M, Hamroun D, et al. The French Gaucher’s disease registry: clinical characteristics, complications and treatment of 562 patients. Orphanet J Rare Dis. 2012;7:77.
15. Xu B, Radojčić MR, Anderson DB, et al. Trends in prevalence of fractures among adults in the United States, 1999-2020: a population-based study. Int J Surg. 2024;110:721-32.
16. Deegan P, Khan A, Camelo JS, Batista JL, Weinreb N. The International Collaborative Gaucher Group GRAF (gaucher risk assessment for fracture) score: a composite risk score for assessing adult fracture risk in imiglucerase-treated Gaucher disease type 1 patients. Orphanet J Rare Dis. 2021;16:92.
17. Khan A, Hangartner T, Weinreb NJ, Taylor JS, Mistry PK. Risk factors for fractures and avascular osteonecrosis in type 1 Gaucher disease: a study from the International Collaborative Gaucher Group (ICGG) Gaucher registry. J Bone Miner Res. 2012;27:1839-48.
18. Weinreb NJ, Cappellini MD, Cox TM, et al. A validated disease severity scoring system for adults with type 1 Gaucher disease. Genet Med. 2010;12:44-51.
19. Weinreb NJ, Finegold DN, Feingold E, et al. Evaluation of disease burden and response to treatment in adults with type 1 gaucher disease using a validated disease severity scoring system (DS3). Orphanet J Rare Dis. 2015;10:64.
20. Mistry PK, Batista JL, Andersson HC, et al. Transformation in pretreatment manifestations of Gaucher disease type 1 during two decades of alglucerase/imiglucerase enzyme replacement therapy in the International Collaborative Gaucher Group (ICGG) Gaucher registry. Am J Hematol. 2017;92:929-39.
21. Charlson M, Szatrowski TP, Peterson J, Gold J. Validation of a combined comorbidity index. J Clin Epidemiol. 1994;47:1245-51.
22. Pan Z, Zeng J, Li T, et al. Age-adjusted Charlson comorbidity index is associated with the risk of osteoporosis in older fall-prone men: a retrospective cohort study. BMC Geriatr. 2024;24:413.
23. Kahwati LC, Kistler CE, Booth G, et al. Screening for osteoporosis to prevent fractures: a systematic evidence review for the US preventive services task force. JAMA. 2025;333:509.
24. Gewiess J, Albers CE, Keel MJB, Frihagen F, Rommens PM, Bastian JD. Chronic pelvic insufficiency fractures and their treatment. Arch Orthop Trauma Surg. 2024;145:76.
25. Stiles AR, Jung S, Evard R, et al. Recognizing Gaucher disease in the fifth decade and beyond: a retrospective case study in patients of Ashkenazi Jewish descent. Rare Dis Orphan Drugs J. 2025;4:34.
26. Zimran A, Gross E, West C, Sorge J, Kubitz M, Beutler E. Prediction of severity of Gaucher’s disease by identification of mutations at dna leveL. Lancet. 1989;334:349-52.
27. Di Rocco M, Giona F, Carubbi F, et al. A new severity score index for phenotypic classification and evaluation of responses to treatment in type I Gaucher disease. Haematologica. 2008;93:1211-8.
28. Lollert A, Laudemann K, Mengel E, et al. Retrospective analysis of whole-body magnetic resonance imaging of bone manifestations in long-term treated patients with Gaucher disease type 1. Klin Padiatr. 2018;231:52-9.
29. Paskulin LD, Starosta RT, Bertholdo D, Vairo FP, Vedolin L, Schwartz IVD. Bone marrow burden score is not useful as a follow-up parameter in stable patients with type 1 Gaucher disease after 5 years of treatment. Blood Cells Mol Dis. 2021;90:102591.
30. Lai JK, Robertson PL, Goh C, Szer J. Intraobserver and interobserver variability of the bone marrow burden (BMB) score for the assessment of disease severity in Gaucher disease. Possible impact of reporting experience. Blood Cells Mol Dis. 2018;68:121-5.
31. Ganz ML, Stern S, Ward A, et al. A new framework for evaluating the health impacts of treatment for Gaucher disease type 1. Orphanet J Rare Dis. 2017;12:38.
32. Hoong CWS, Saul D, Khosla S, Sfeir JG. Advances in the management of osteoporosis. BMJ. 2025;390:e081250.
33. Andrade-campos MM, De Frutos LL, Cebolla JJ, et al. Identification of risk features for complication in Gaucher’s disease patients: a machine learning analysis of the Spanish registry of Gaucher disease. Orphanet J Rare Dis. 2020;15:256.
34. Vilaca T, Schini M, Lui L, et al. The relationship between treatment-related changes in total hip BMD measured after 12, 18, and 24 mo and fracture risk reduction in osteoporosis clinical trials: the FNIH-ASBMR-SABRE project. J Bone Miner Res. 2024;39:1434-42.
35. Chen P, Miller PD, Delmas PD, Misurski DA, Krege JH. Change in lumbar spine BMD and vertebral fracture risk reduction in teriparatide-treated postmenopausal women with osteoporosis. J Bone Miner Res. 2006;21:1785-90.
36. Austin M, Yang Y, Vittinghoff E, et al. ; for the FREEDOM Trial. Relationship between bone mineral density changes with denosumab treatment and risk reduction for vertebral and nonvertebral fractures. J Bone Miner Res. 2012;27:687-93.
37. Graeff C, Campbell GM, Peña J, et al. Administration of romosozumab improves vertebral trabecular and cortical bone as assessed with quantitative computed tomography and finite element analysis. Bone. 2015;81:364-9.
38. Damm T, Libanati C, Peña J, et al. Romosozumab significantly improves vertebral cortical bone mass and structure compared with teriparatide, whereas both treatments increase vertebral trabecular bone mass similarly: high-resolution quantitative computed tomography analyses of randomized controlled trial results in postmenopausal women with low bone mineral density. JBMR Plus. 2025;9:ziaf119.
39. Deegan P, Lau H, Elstein D, et al. Long-term treatment of Gaucher disease with velaglucerase alfa in ERT-Naïve patients from the gaucher outcome survey (GOS) registry. J Clin Med. 2024;13:2782.
40. Elstein D, Belmatoug N, Bembi B, et al. Twelve years of the gaucher outcomes survey (GOS): insights, achievements, and lessons learned from a Global patient registry. JCM. 2024;13:3588.
41. Meddeb Z, Ben Younes N, Abida H, et al. Bone involvement in Gaucher disease: data from a North African registry. Reumatol Clin. 2025;21:501996.
42. Luettel DM, Terluk MR, Roh J, Weinreb NJ, Kartha RV. Emerging biomarkers in Gaucher disease. In: Advances in Clinical Chemistry. Elsevier; 2025. pp. 1-56.
43. Wenstrup RJ, Bailey L, Grabowski GA, et al. Gaucher disease: alendronate disodium improves bone mineral density in adults receiving enzyme therapy. Blood. 2004;104:1253-7.
45. International Osteoporosis Foundation. Risk factors for Osteoporosis. Available from: https://www.osteoporosis.foundation/patients/about-osteoporosis/risk-factors. [Last accessed on 26 Mar 2026].
46. Katz K, Cohen IJ, Ziv N, Grunebaum M, Zaizov R, Yosipovitch Z. Fractures in children who have Gaucher disease. J Bone Joint Surg Am. 1987;69:1361-70.
47. Lutsky KF, Tejwani NC. Orthopaedic manifestations of Gaucher disease. Bull NYU Hosp Jt Dis. 2007;65:37-42.
48. Binnetoglu E, Komurcu E, Sen H, Kizildag B. Gaucher disease with pathological femoral neck fracture. BMJ Case Rep. 2013;2013:bcr2013200260.
49. Stowens DW, Teitelbaum SL, Kahn AJ, Barranger JA. Skeletal complications of Gaucher disease. Medicine. 1985;64:310-22.
50. Lebel E, Itzchaki M, Hadas-halpern I, Zimran A, Elstein D. Outcome of total hip arthroplasty in patients with Gaucher disease. J Arthroplasty. 2001;16:7-12.
51. Lebel E, Elstein D, Zimran A, Itzchaki M. Cementless total hip arthroplasties in Gaucher disease: long-term follow-up. Am J Orthop. 2009;38:130-2.
52. Cohen D, Kogan D, Rubin A, Zimran A, Lebel E. Longevity of total hip arthroplasty implants in patients with Gaucher disease. HIP International. 2019;30:147-51.
53. Bubbar V, Heras FL, Amato D, Pritzker KPH, Gross AE. Total hip replacement in Gaucher’s disease: effects of enzyme replacement therapy. J Bone Joint Surg Br. 2009;91-B:1623-7.
54. Grass A, Riemer E, Zimran A, et al. Anesthetic approaches and perioperative complications of total hip arthroplasty in Gaucher disease: a control-matched retrospective-cohort study. Life. 2023;13:1716.
55. Mamonov VE, Chabaeva YA, Khomenko VA, Ponomarev RV, Lukina EA. Total hip arthroplasty in patients with Gaucher disease: characteristics and outcomes. NN Priorov J Traumatol Orthop. 2025;32:347-59.
56. Dinur T, Zimran A, Becker-cohen M, et al. Long term follow-up of 103 untreated adult patients with type 1 Gaucher disease. JCM. 2019;8:1662.
57. Tang Z, Shen K, Kejriwal M. An evaluation of estimative uncertainty in large language models. npj Complex. 2026;3:8.
58. Qaseem A, Hicks LA, Etxeandia-Ikobaltzeta I, et al. Pharmacologic treatment of primary osteoporosis or low bone mass to prevent fractures in adults: a living clinical guideline from the American college of physicians. Ann Intern Med. 2023;176:224-38.
59. Stokes G, Herath M, Samad N, Trinh A, Milat F. Bone health-across a woman’s lifespan. Clin Endocrinol. 2025;102:389-402.
60. Marcucci G, Brandi ML. The diagnosis and therapy of osteoporosis in Gaucher disease. Calcif Tissue Int. 2025;116:31.
Cite This Article
 Open Access
How to Cite
Download Citation
Export Citation File:
Type of Import
Tips on Downloading Citation
Citation Manager File Format
Type of Import
Direct Import: When the Direct Import option is selected (the default state), a dialogue box will give you the option to Save or Open the downloaded citation data. Choosing Open will either launch your citation manager or give you a choice of applications with which to use the metadata. The Save option saves the file locally for later use.
Indirect Import: When the Indirect Import option is selected, the metadata is displayed and may be copied and pasted as needed.
About This Article
Special Topic
Copyright

Data & Comments
Data
0










Comments
Comments must be written in English. Spam, offensive content, impersonation, and private information will not be permitted. If any comment is reported and identified as inappropriate content by OAE staff, the comment will be removed without notice. If you have any queries or need any help, please contact us at [email protected].