
fig6
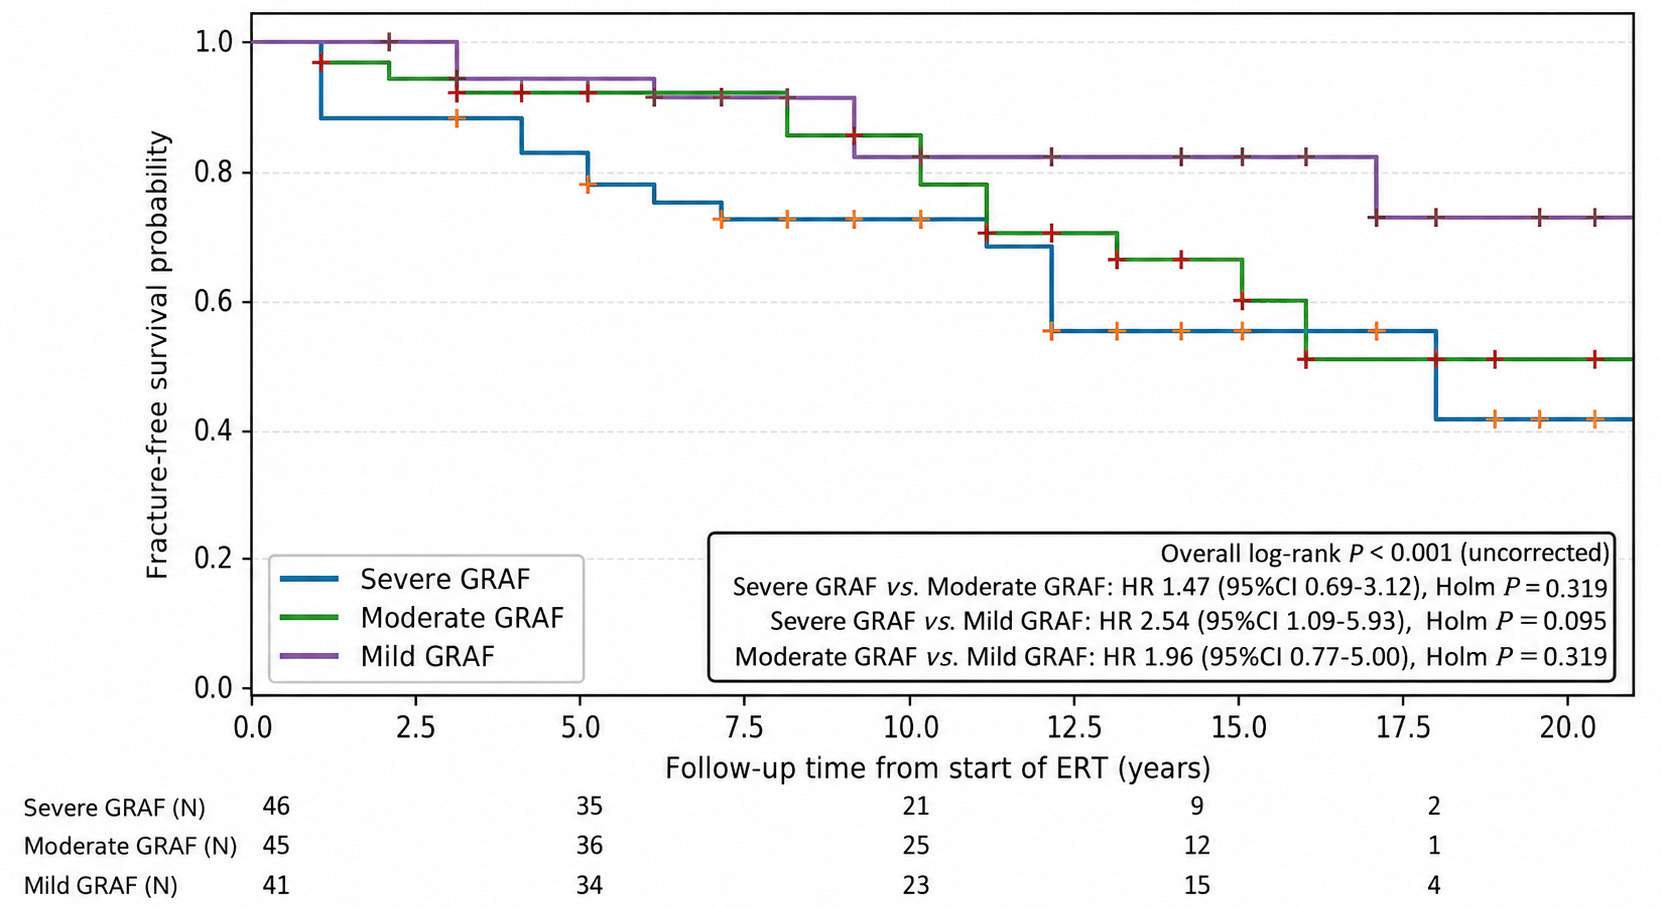
Figure 6. Kaplan-Meier plot of fracture-free survival stratified by GRAF score risk category. 3 = marked; 2 = moderate; 1 = mild. The number of patients at risk at the start of study and after 5, 10, 15, 20 years is shown beneath the X-axis. P values were calculated by log rank-χ2 tests as explained in the legend to Figure 4. P values for pairwise comparisons are Holm-corrected; although the overall log-rank test is significant, pairwise differences between groups were not statistically significant after correction. GRAF: Gaucher risk assessment for fracture; ERT: enzyme replacement therapy; CI: confidence interval; HR: hazard ratio.