
fig7

A validated disease severity scoring system predicts risk of fractures in treated adults with type 1 Gaucher disease

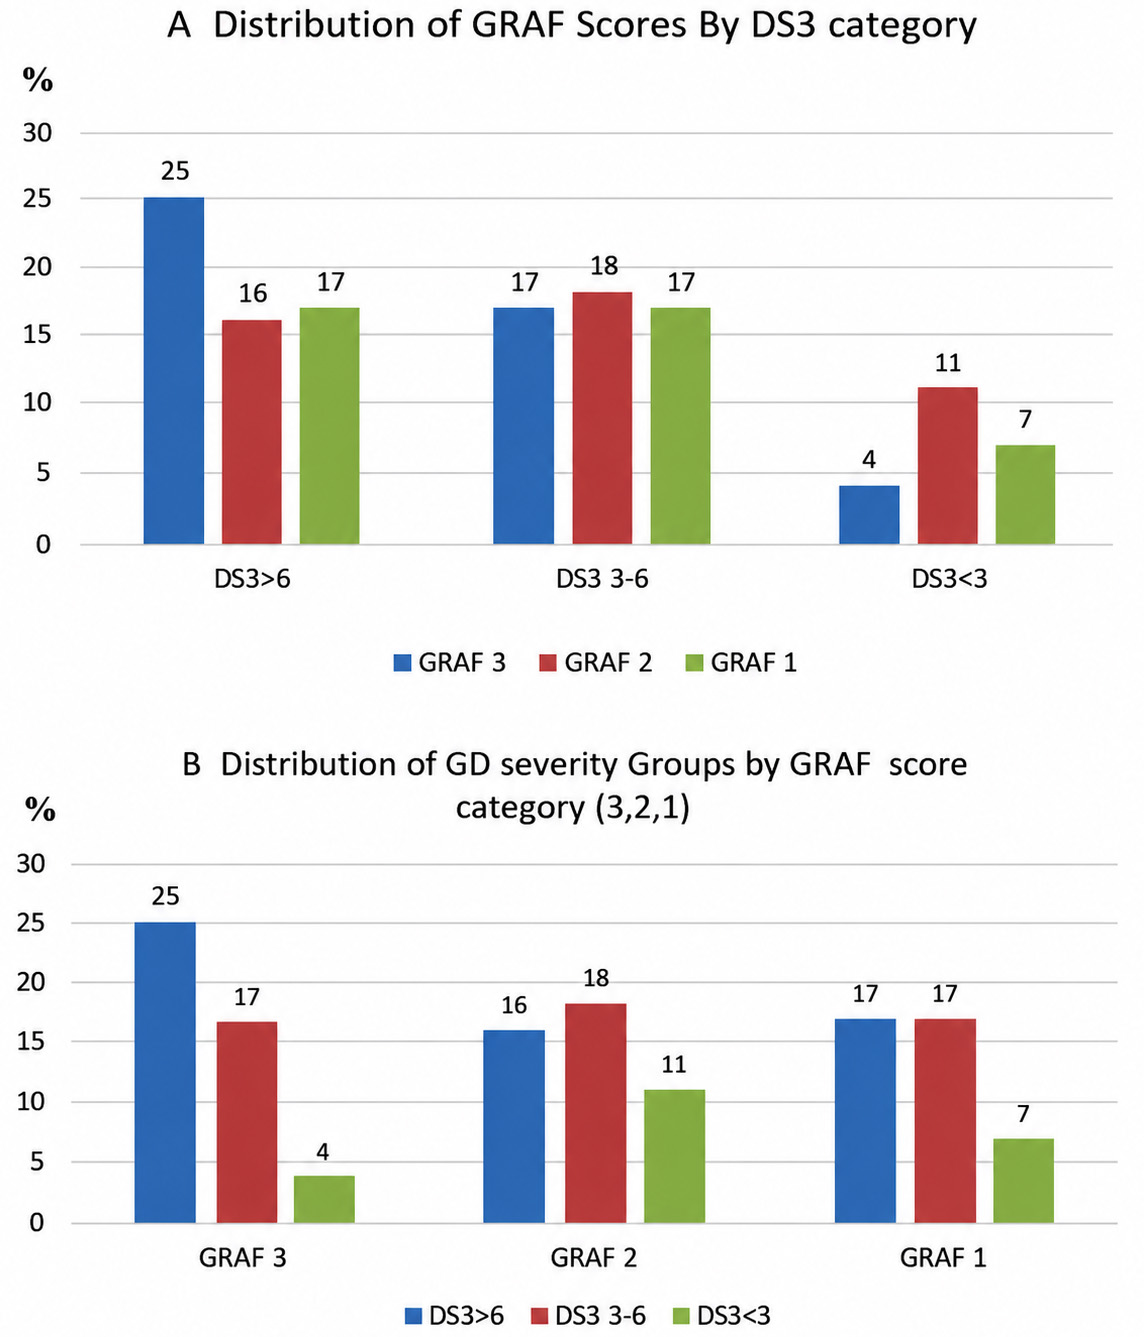
Figure 7. (A) Distribution of GRAF scores by DS3 category (3,2,1); (B) Distribution of DS3 severity groups by GRAF score risk category (3,2,1). For GRAF risk categories, 3 = high; 2 = intermediate; 1 = low. For DS3 severity categories, 3 = marked; 2 = moderate; 1 = mild. GRAF: Gaucher risk assessment for fracture; DS3: disease severity scoring system; GD: Gaucher disease.


Rare Disease and Orphan Drugs Journal
ISSN 2771-2893 (Online)
Follow Us

Portico

All published articles are preserved here permanently:

https://www.portico.org/publishers/oae/

Portico

All published articles are preserved here permanently:

https://www.portico.org/publishers/oae/