


fig5
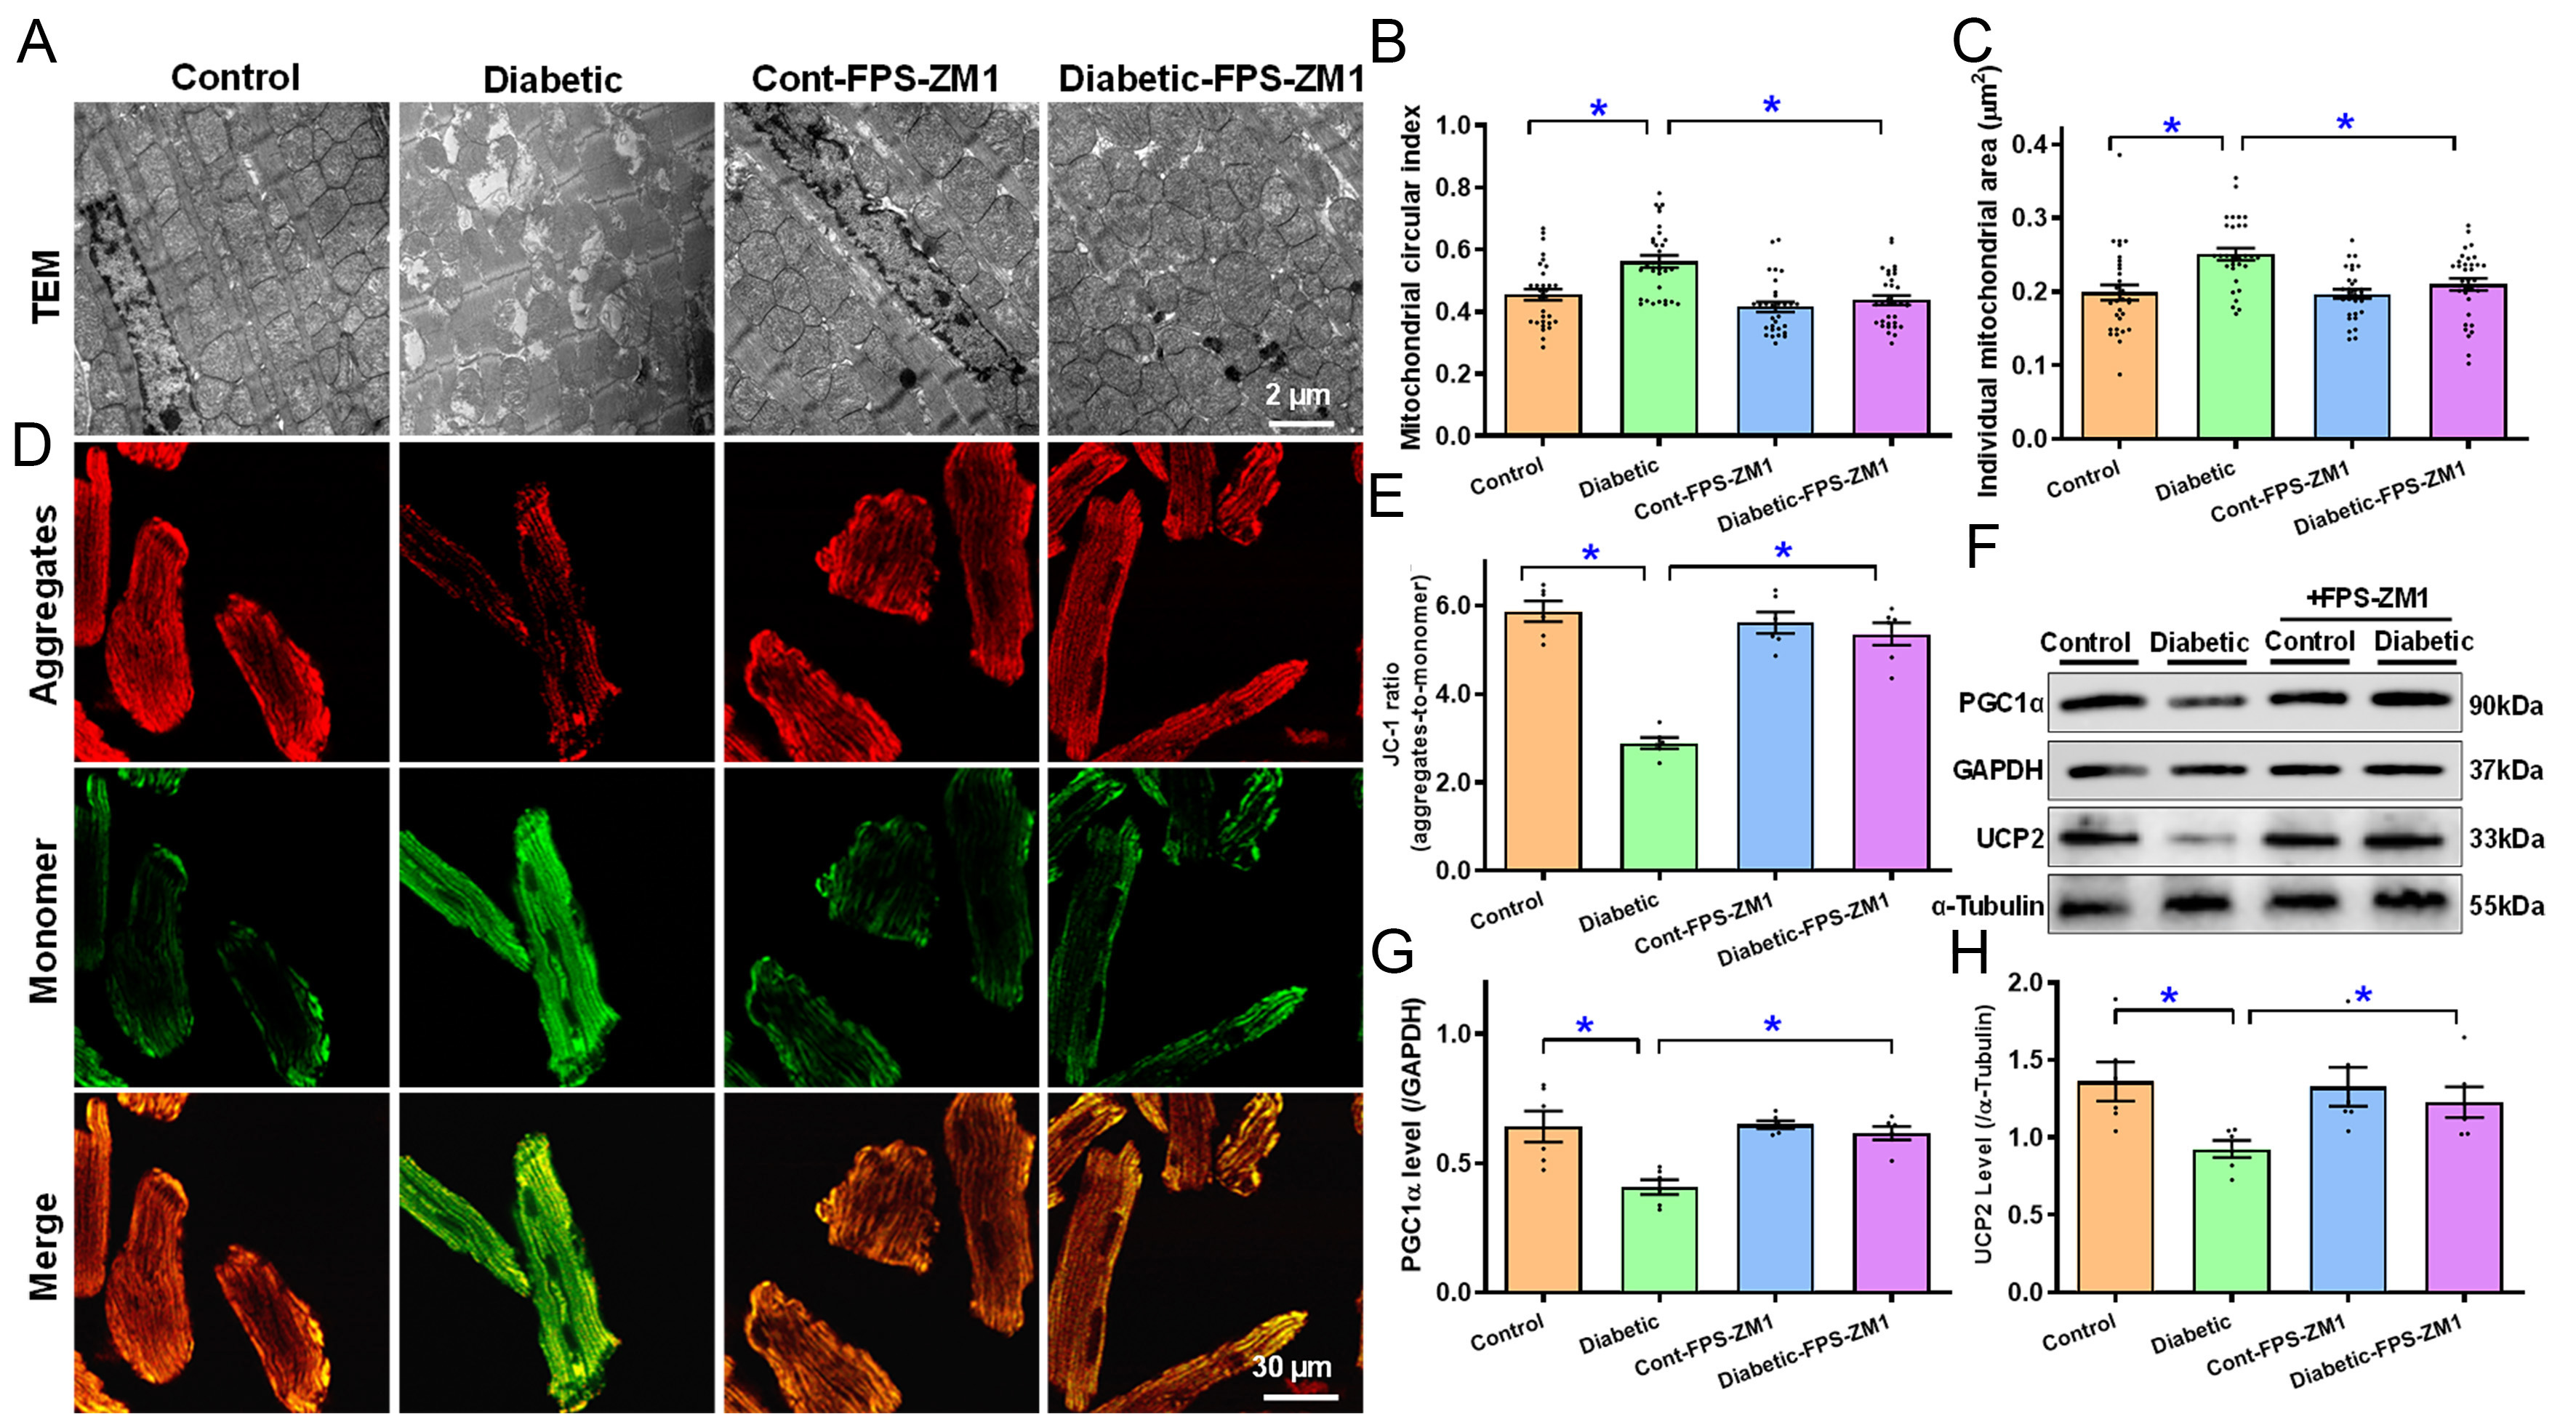
Figure 5. TEM ultrastructure and MMP of myocardial tissues or cardiomyocytes from experimental mice treated with RAGE inhibitor FPS-ZM1 for 4 weeks. (A) TEM ultrastructure micrographs (representative); (B) Short-to-long axis ratio for mitochondrial circularity; (C) Individual mitochondrial size; (D) JC-1 aggregates (red, top row), monomer (green, middle row) and merged (bottom row) fluorescence signals (representative); (E) Summarized data for JC-1 aggregate-to-monomer ratio; (F) Gel blotting depicting UCP2 and PGC1α levels (representative) using specific antibodies (α-tubulin or GAPDH as loading controls); (G) PGC1α; (H) UCP2. Mean ± SEM, n = 30-33 mitochondria [5 pictures/group, (B and C)] or 6 mice (E, G and H) per group, normal distribution was determined via the Shapiro-Wilk test, results were assessed via one-way ANOVA and then Tukey’s post hoc test, *P < 0.05 between labeled groups. MMP: Mitochondrial membrane potential; RAGE: receptor for AGEs; TEM: transmission electron microscope; UCP2: uncoupling protein 2; PGC1α: peroxisome proliferator-activated receptor gamma coactivator 1-alpha; GAPDH: glyceraldehyde-3-phosphate dehydrogenase; SEM: standard error of the mean; ANOVA: analysis of variance.


