


fig3
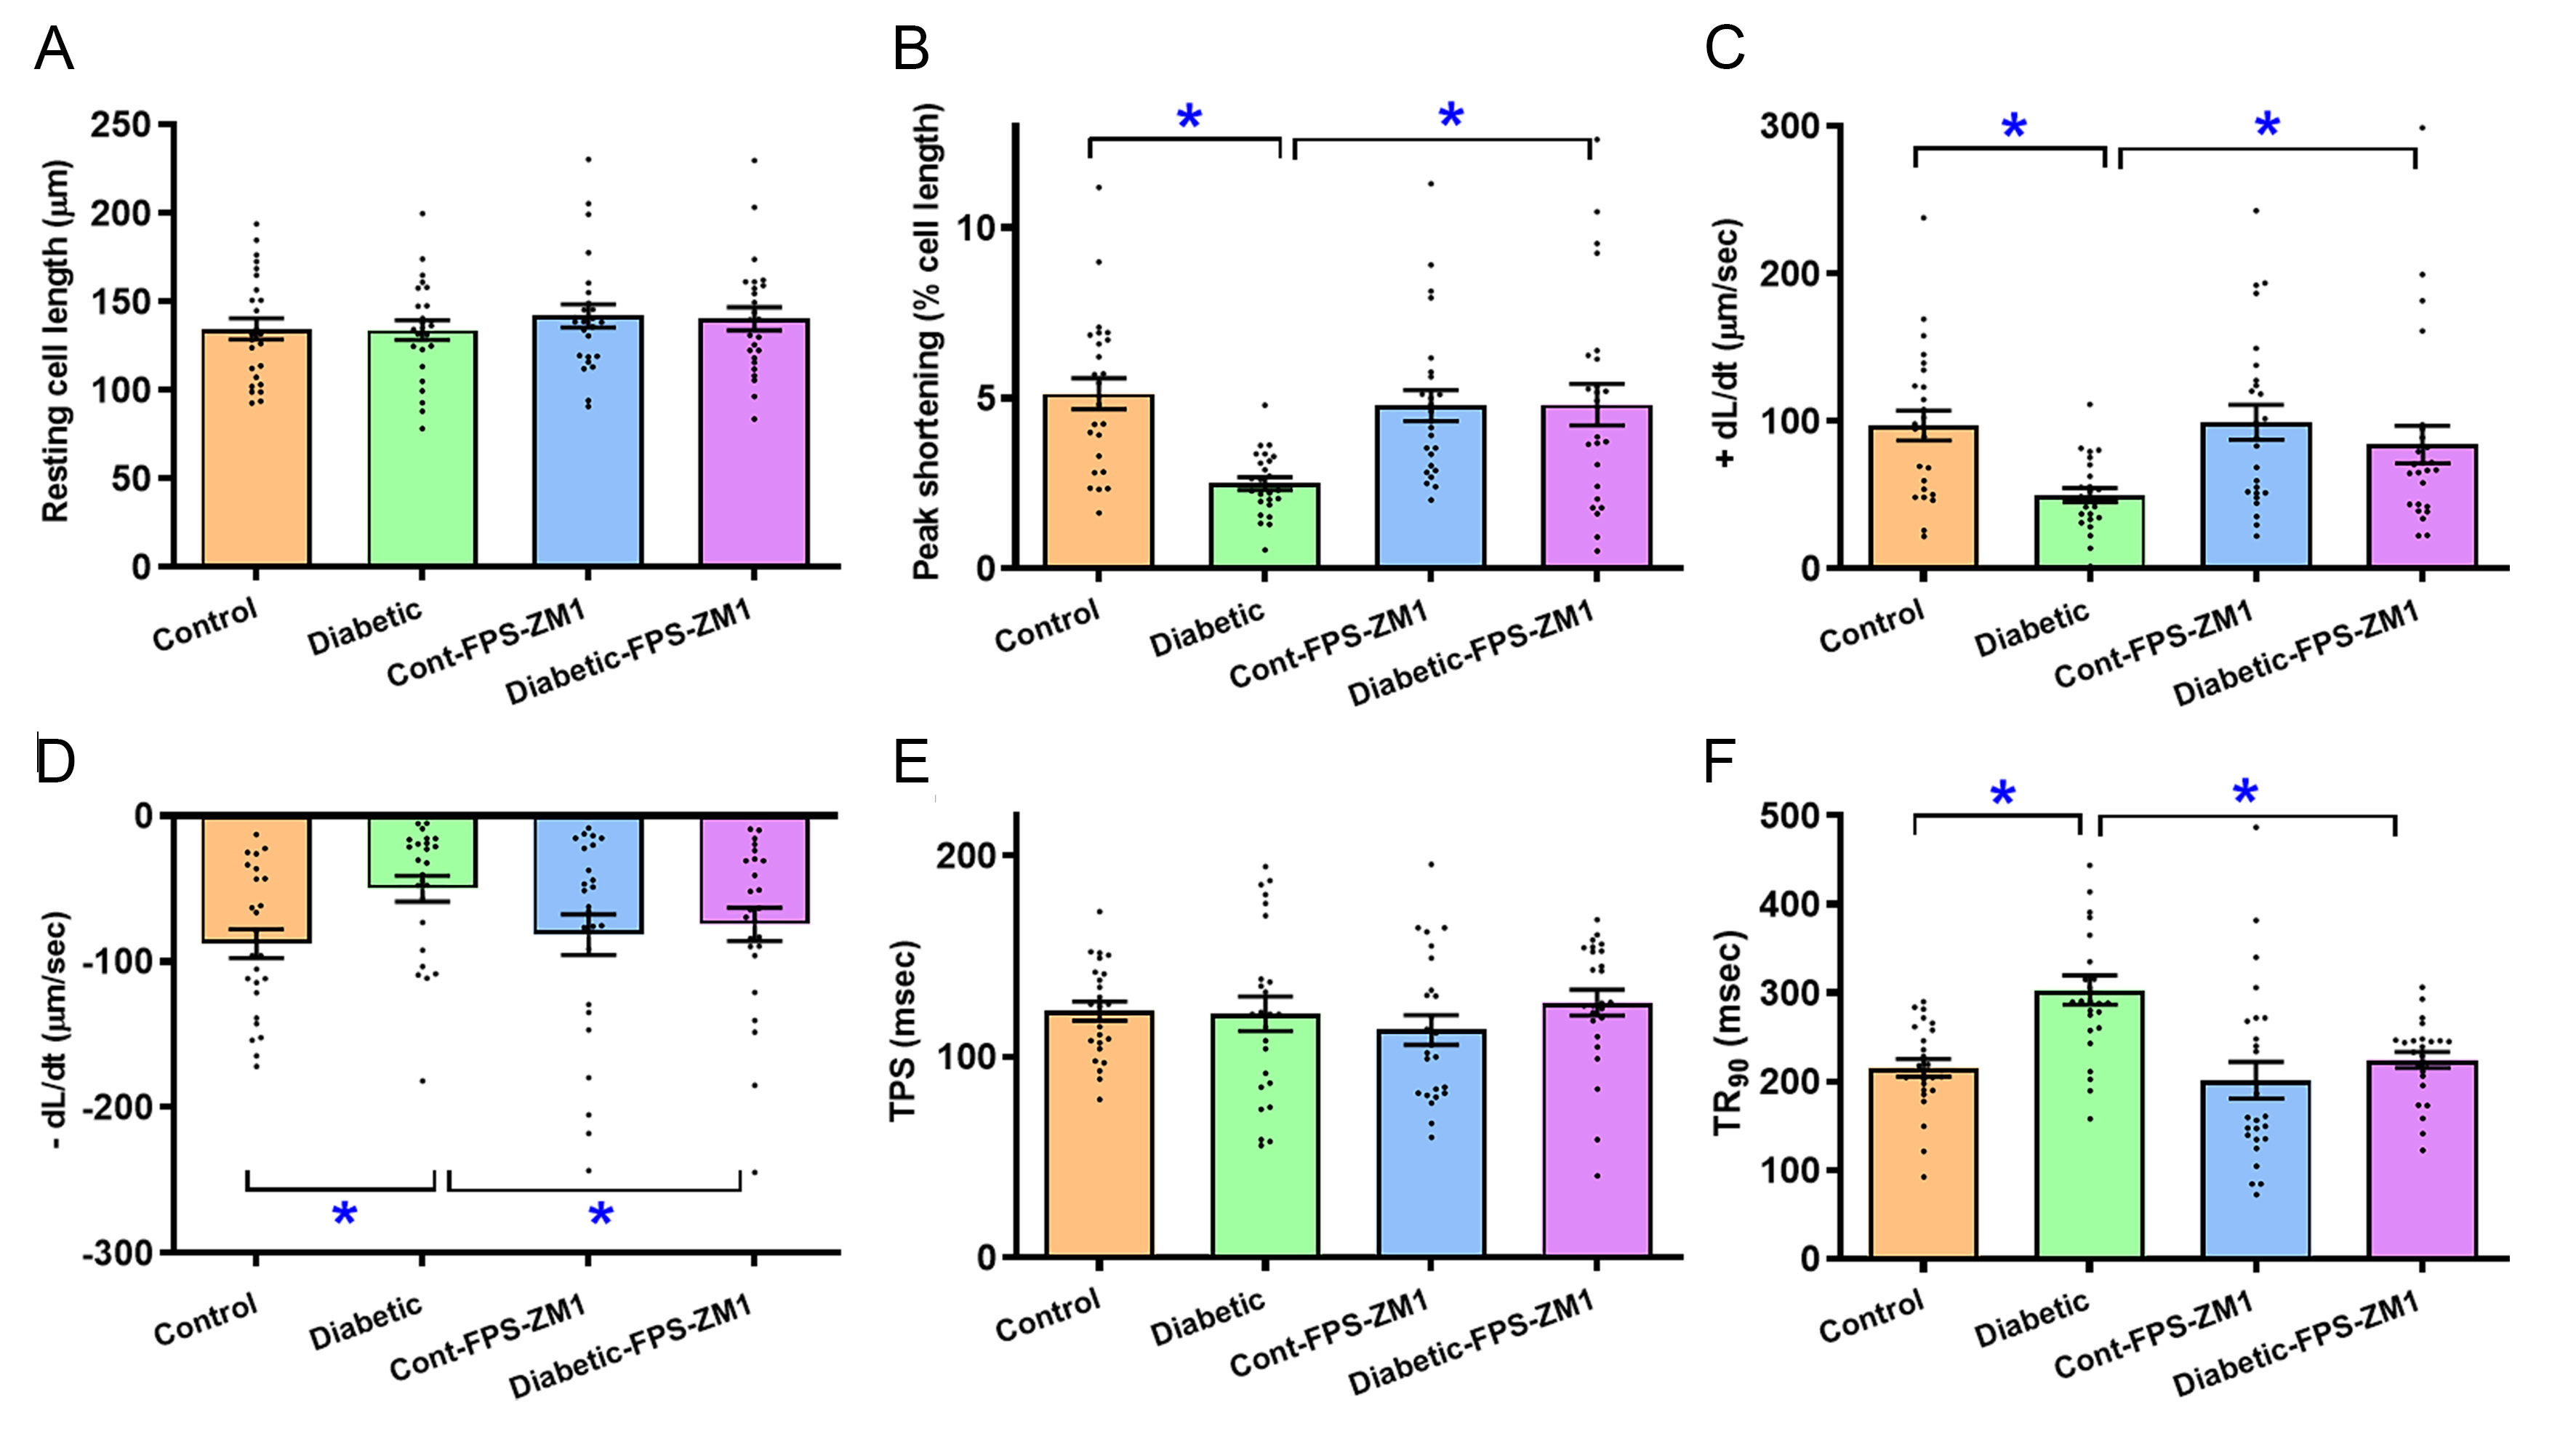
Figure 3. Cardiomyocyte contractile profiles in experimental mice treated with RAGE inhibitor FPS-ZM1 for 4 weeks. (A) Resting cell length; (B) PS; (C) Maximal velocity of shortening (+dL/dt); (D) Maximal velocity of relengthening (-dL/dt); (E) TPS; (F) TR90. Mean ± SEM, n = 25 cardiomyocytes (4 mice) per study group, normal distribution was evaluated using the Shapiro-Wilk test, data were assessed using one-way ANOVA and then Tukey’s post hoc test, *P < 0.05 between labeled groups. RAGE: Receptor for AGEs; PS: peak shortening; TPS: time-to-PS; TR90: time-to-90% relengthening; SEM: standard error of the mean.


