


fig2
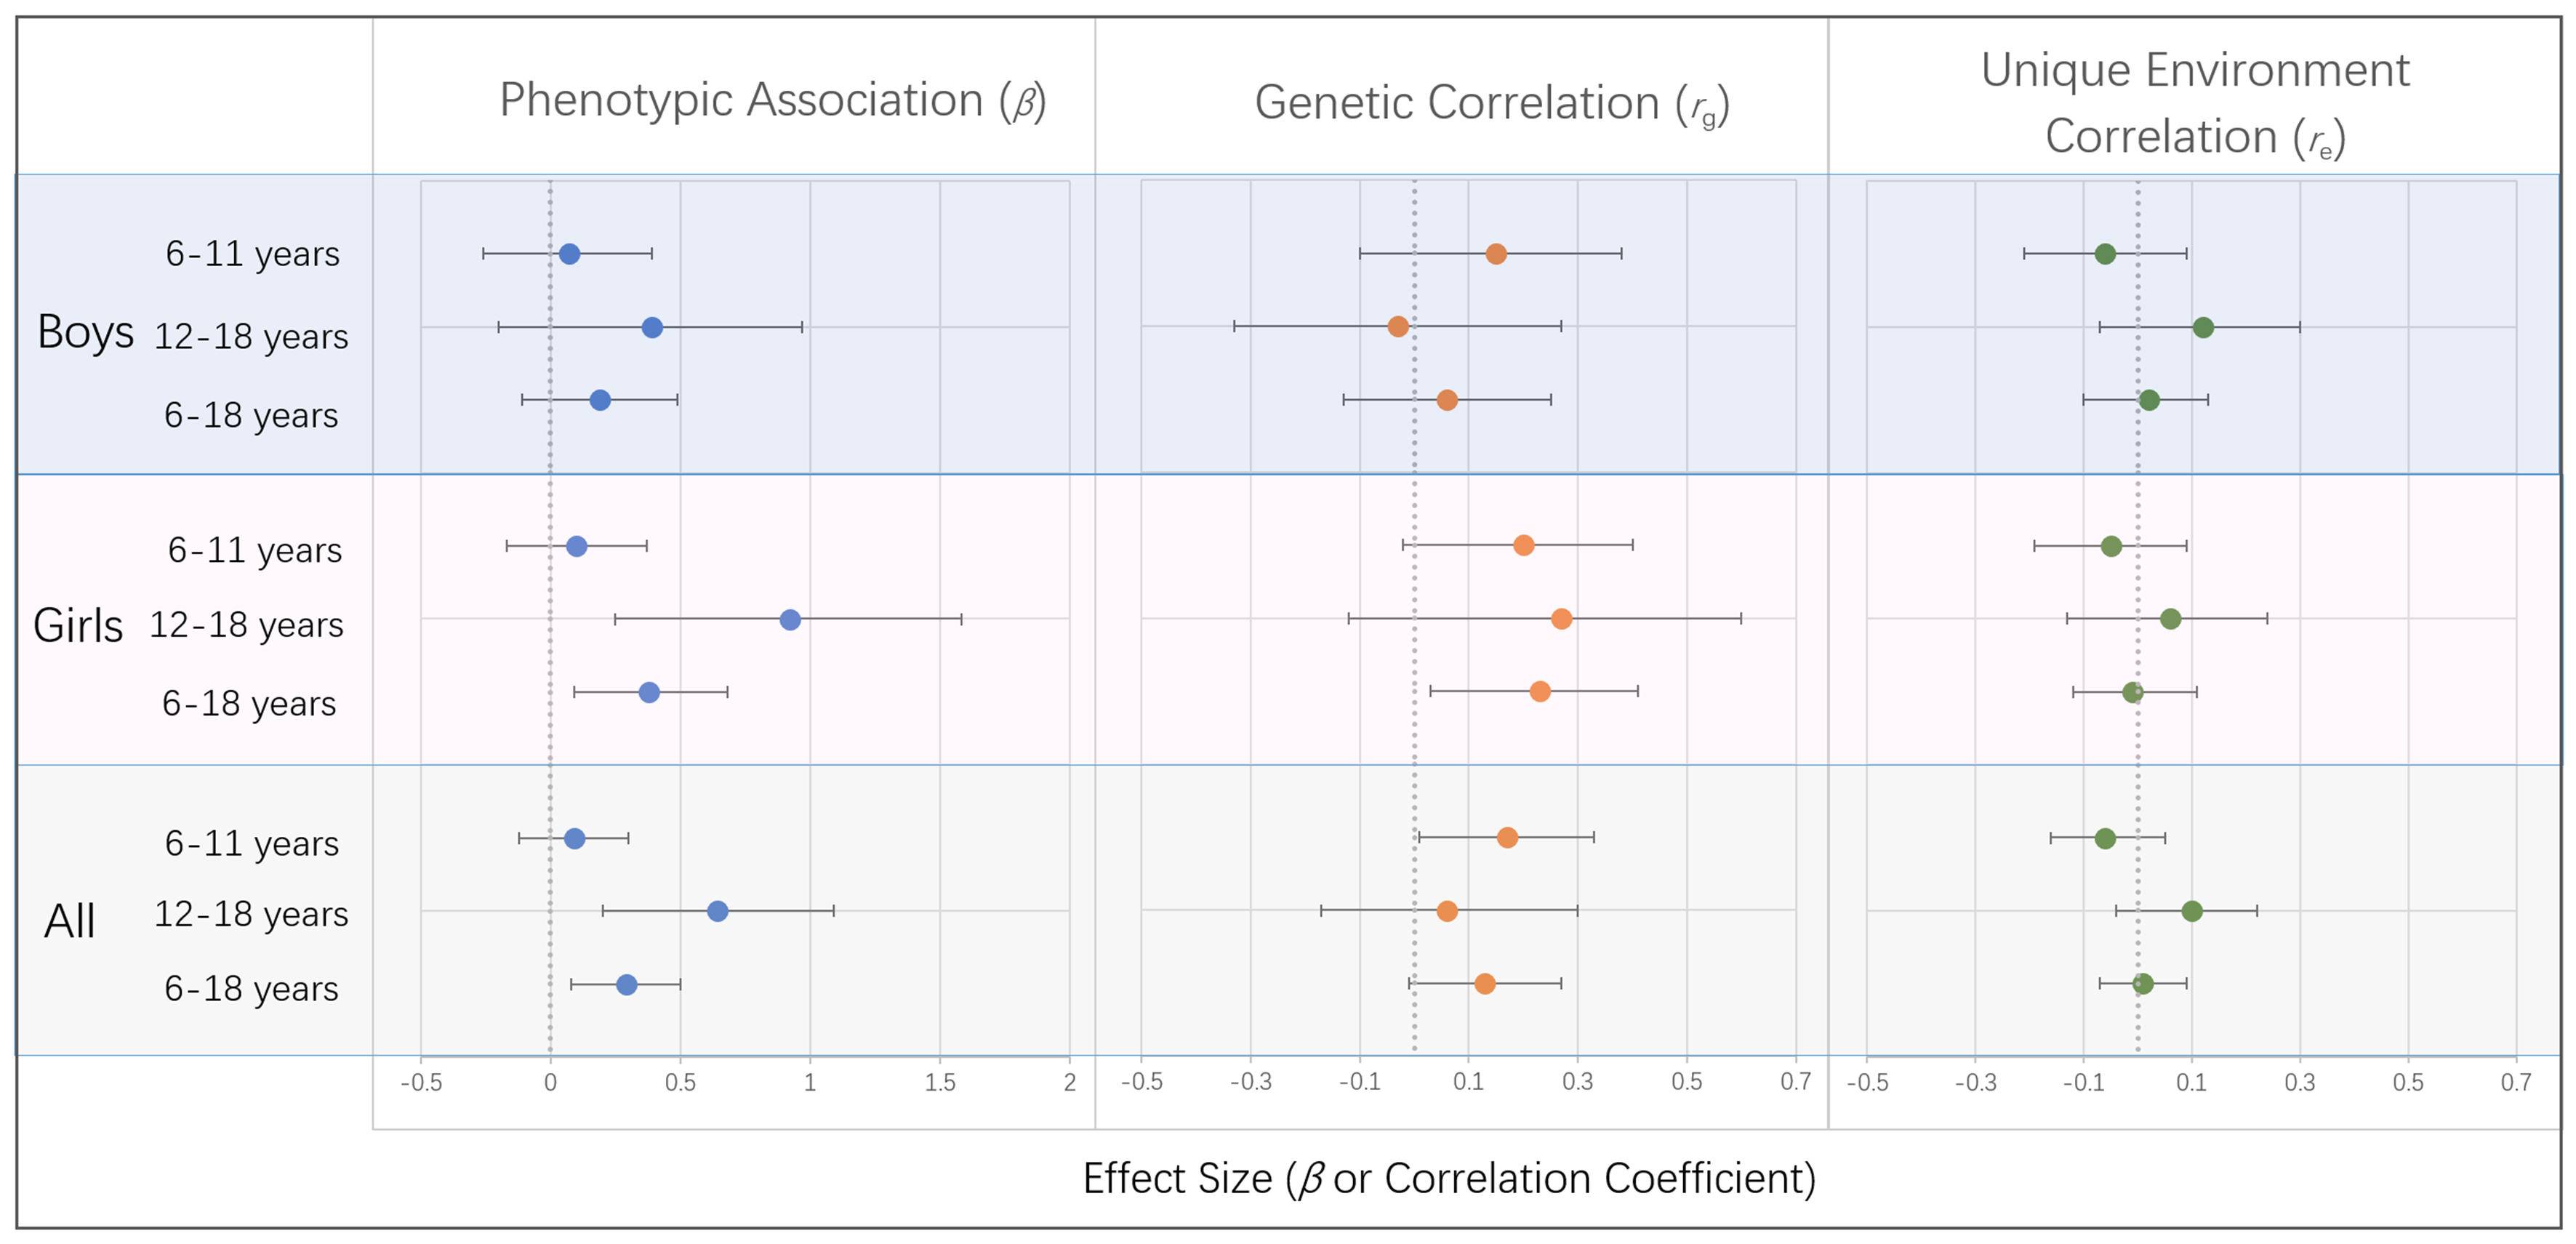
Figure 2. Sex- and Age-Specific Associations of ADHD Symptoms With BMI. Points represent effect estimates, and horizontal bars indicate 95%CI. Phenotypic associations are expressed as regression coefficients (β), while genetic and unique environmental correlations are expressed as rg and re, respectively. Statistical significance is inferred when the 95%CI does not include zero. Sample sizes for each subgroup are provided in Table 1. ADHD: Attention-deficit/hyperactivity disorder; BMI: body mass index; CI: confidence interval.


