
fig7
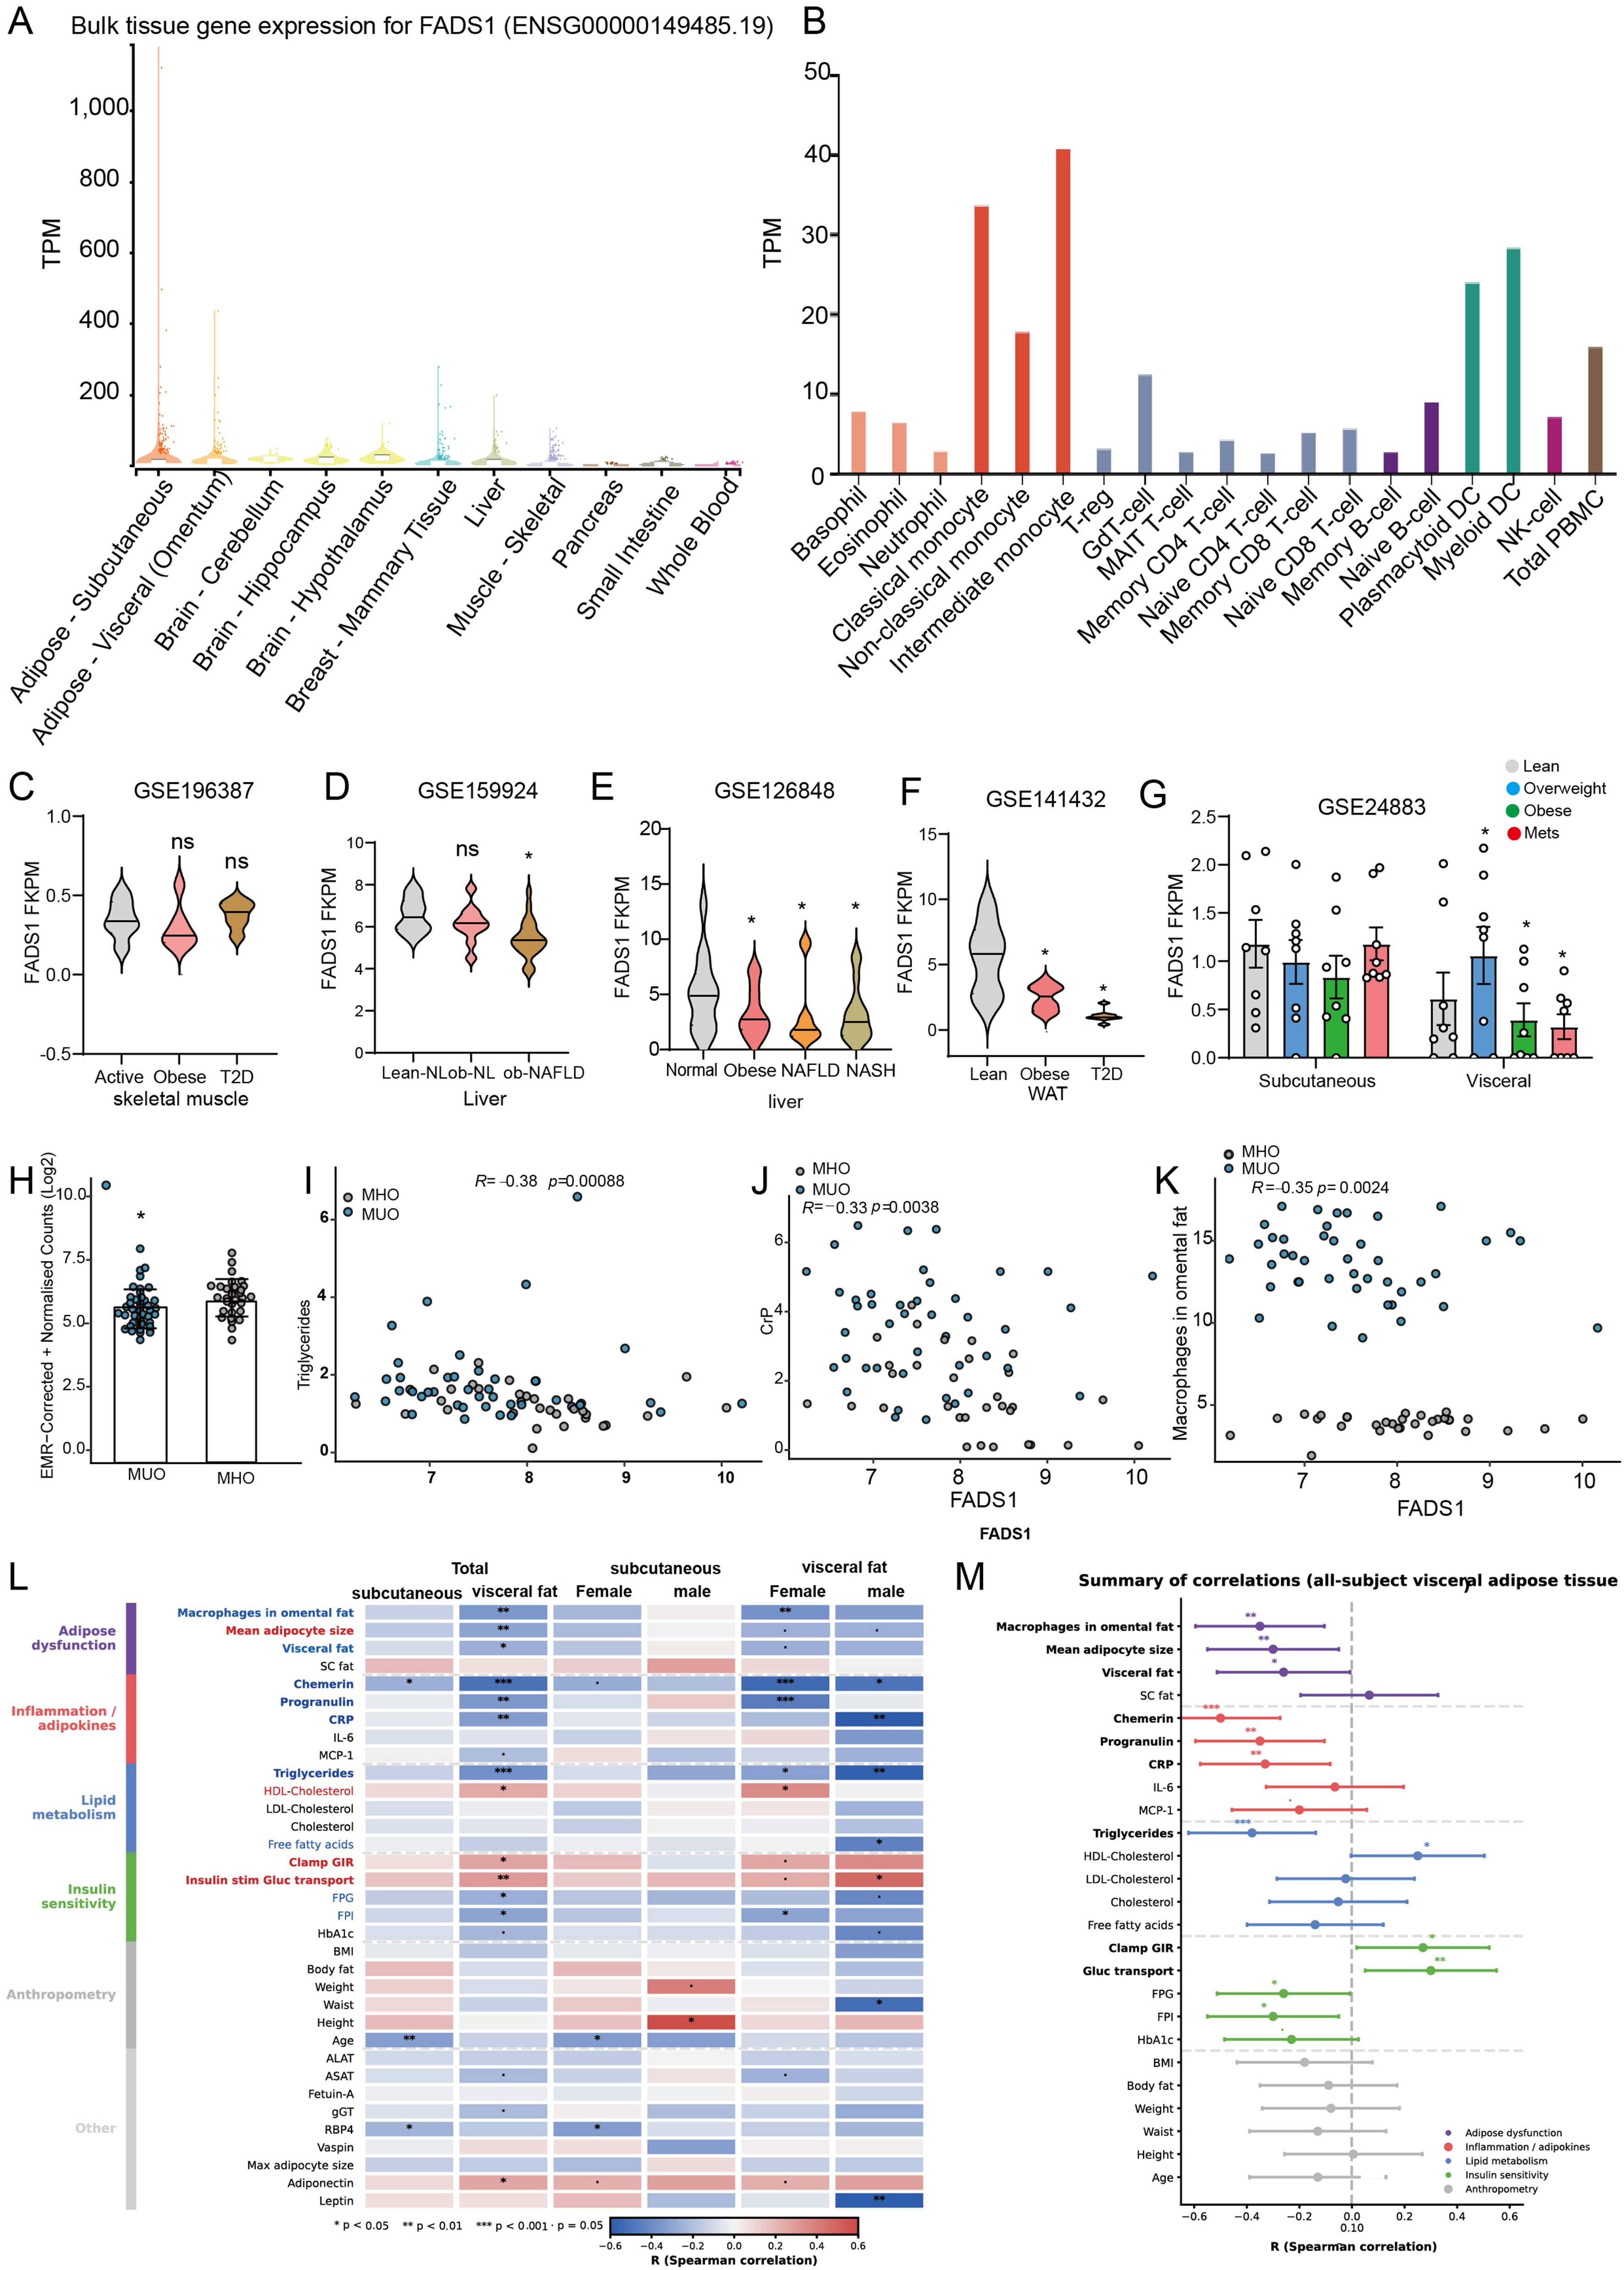
Figure 7. FADS1 expression and clinical associations across independent datasets. (A) Tissue distribution of FADS1 expression across GTEx tissues. FADS1 expression was relatively high in adipose and liver tissues. These data describe baseline tissue distribution and do not indicate the direction of disease-associated expression changes or identify the tissue mediating the genetic associations; (B) FADS1 expression across peripheral immune-cell populations in the HPA dataset; (C-G) Within-dataset comparisons of FADS1 expression in metabolic conditions: (C) FADS1 expression in skeletal muscle from lean physically active participants (Active), participants with obesity (Obese), and participants with obesity and type 2 diabetes (T2D) in GSE196387 (n = 6 per group); (D) Hepatic FADS1 expression in lean participants without NAFLD (Lean-NL), obese participants without NAFLD (Ob-NL), and obese participants with NAFLD (Ob-NAFLD) in GSE159924; (E) liver across normal, obese, NAFLD, and NASH groups in GSE126848; (F) visceral adipose tissue across lean, obese, and T2D groups in GSE141432; and (G) subcutaneous and visceral adipose tissue in obesity in GSE24883. The reference groups for the annotated comparisons were Active in panel C, Lean-NL in panel D, normal in (E), and Lean in (F). In (G), the Overweight, Obese, and MetS groups were compared separately with the Lean group within each adipose depot. *P < 0.05, **P < 0.01, and ***P < 0.001; ns, not statistically significant (P ≥ 0.05); (H-M) Within-cohort expression comparisons and correlations between FADS1 expression and metabolic or inflammatory measures in the metabolically healthy vs. unhealthy obesity cohort. Panels H-M were analyzed within the indicated cohort and were not combined with the other datasets. In panel L, each cell represents the Spearman correlation between FADS1 expression and the indicated clinical measure within the tissue and participant subgroup specified by the column heading. Colors indicate the correlation coefficients. Asterisks indicate P values for testing the null hypothesis of zero correlation: *P < 0.05, **P < 0.01, and ***P < 0.001. Because these datasets differed in tissue source, cohort composition, sample size, experimental platform, and normalization procedure, expression levels and effect directions should not be compared directly across panels. No formal tissue-by-disease interaction model or cross-tissue interaction test was performed. Accordingly, these descriptive expression and correlation analyses do not establish the tissue mediating the genetic associations, immune-cell-specific causality, or a disease-wide immune-vs.-metabolic-tissue expression pattern. GTEx: Genotype-Tissue Expression; HPA: Human Protein Atlas; Lean-NL: lean participants without NAFLD; MetS: metabolic syndrome; MHO: metabolically healthy obesity; MHUO: metabolically healthy versus unhealthy obesity; MUO: metabolically unhealthy obesity; NAFLD: non-alcoholic fatty liver disease; NASH: non-alcoholic steatohepatitis; Ob-NL: obese participants without NAFLD; T2D: type 2 diabetes.