
fig5
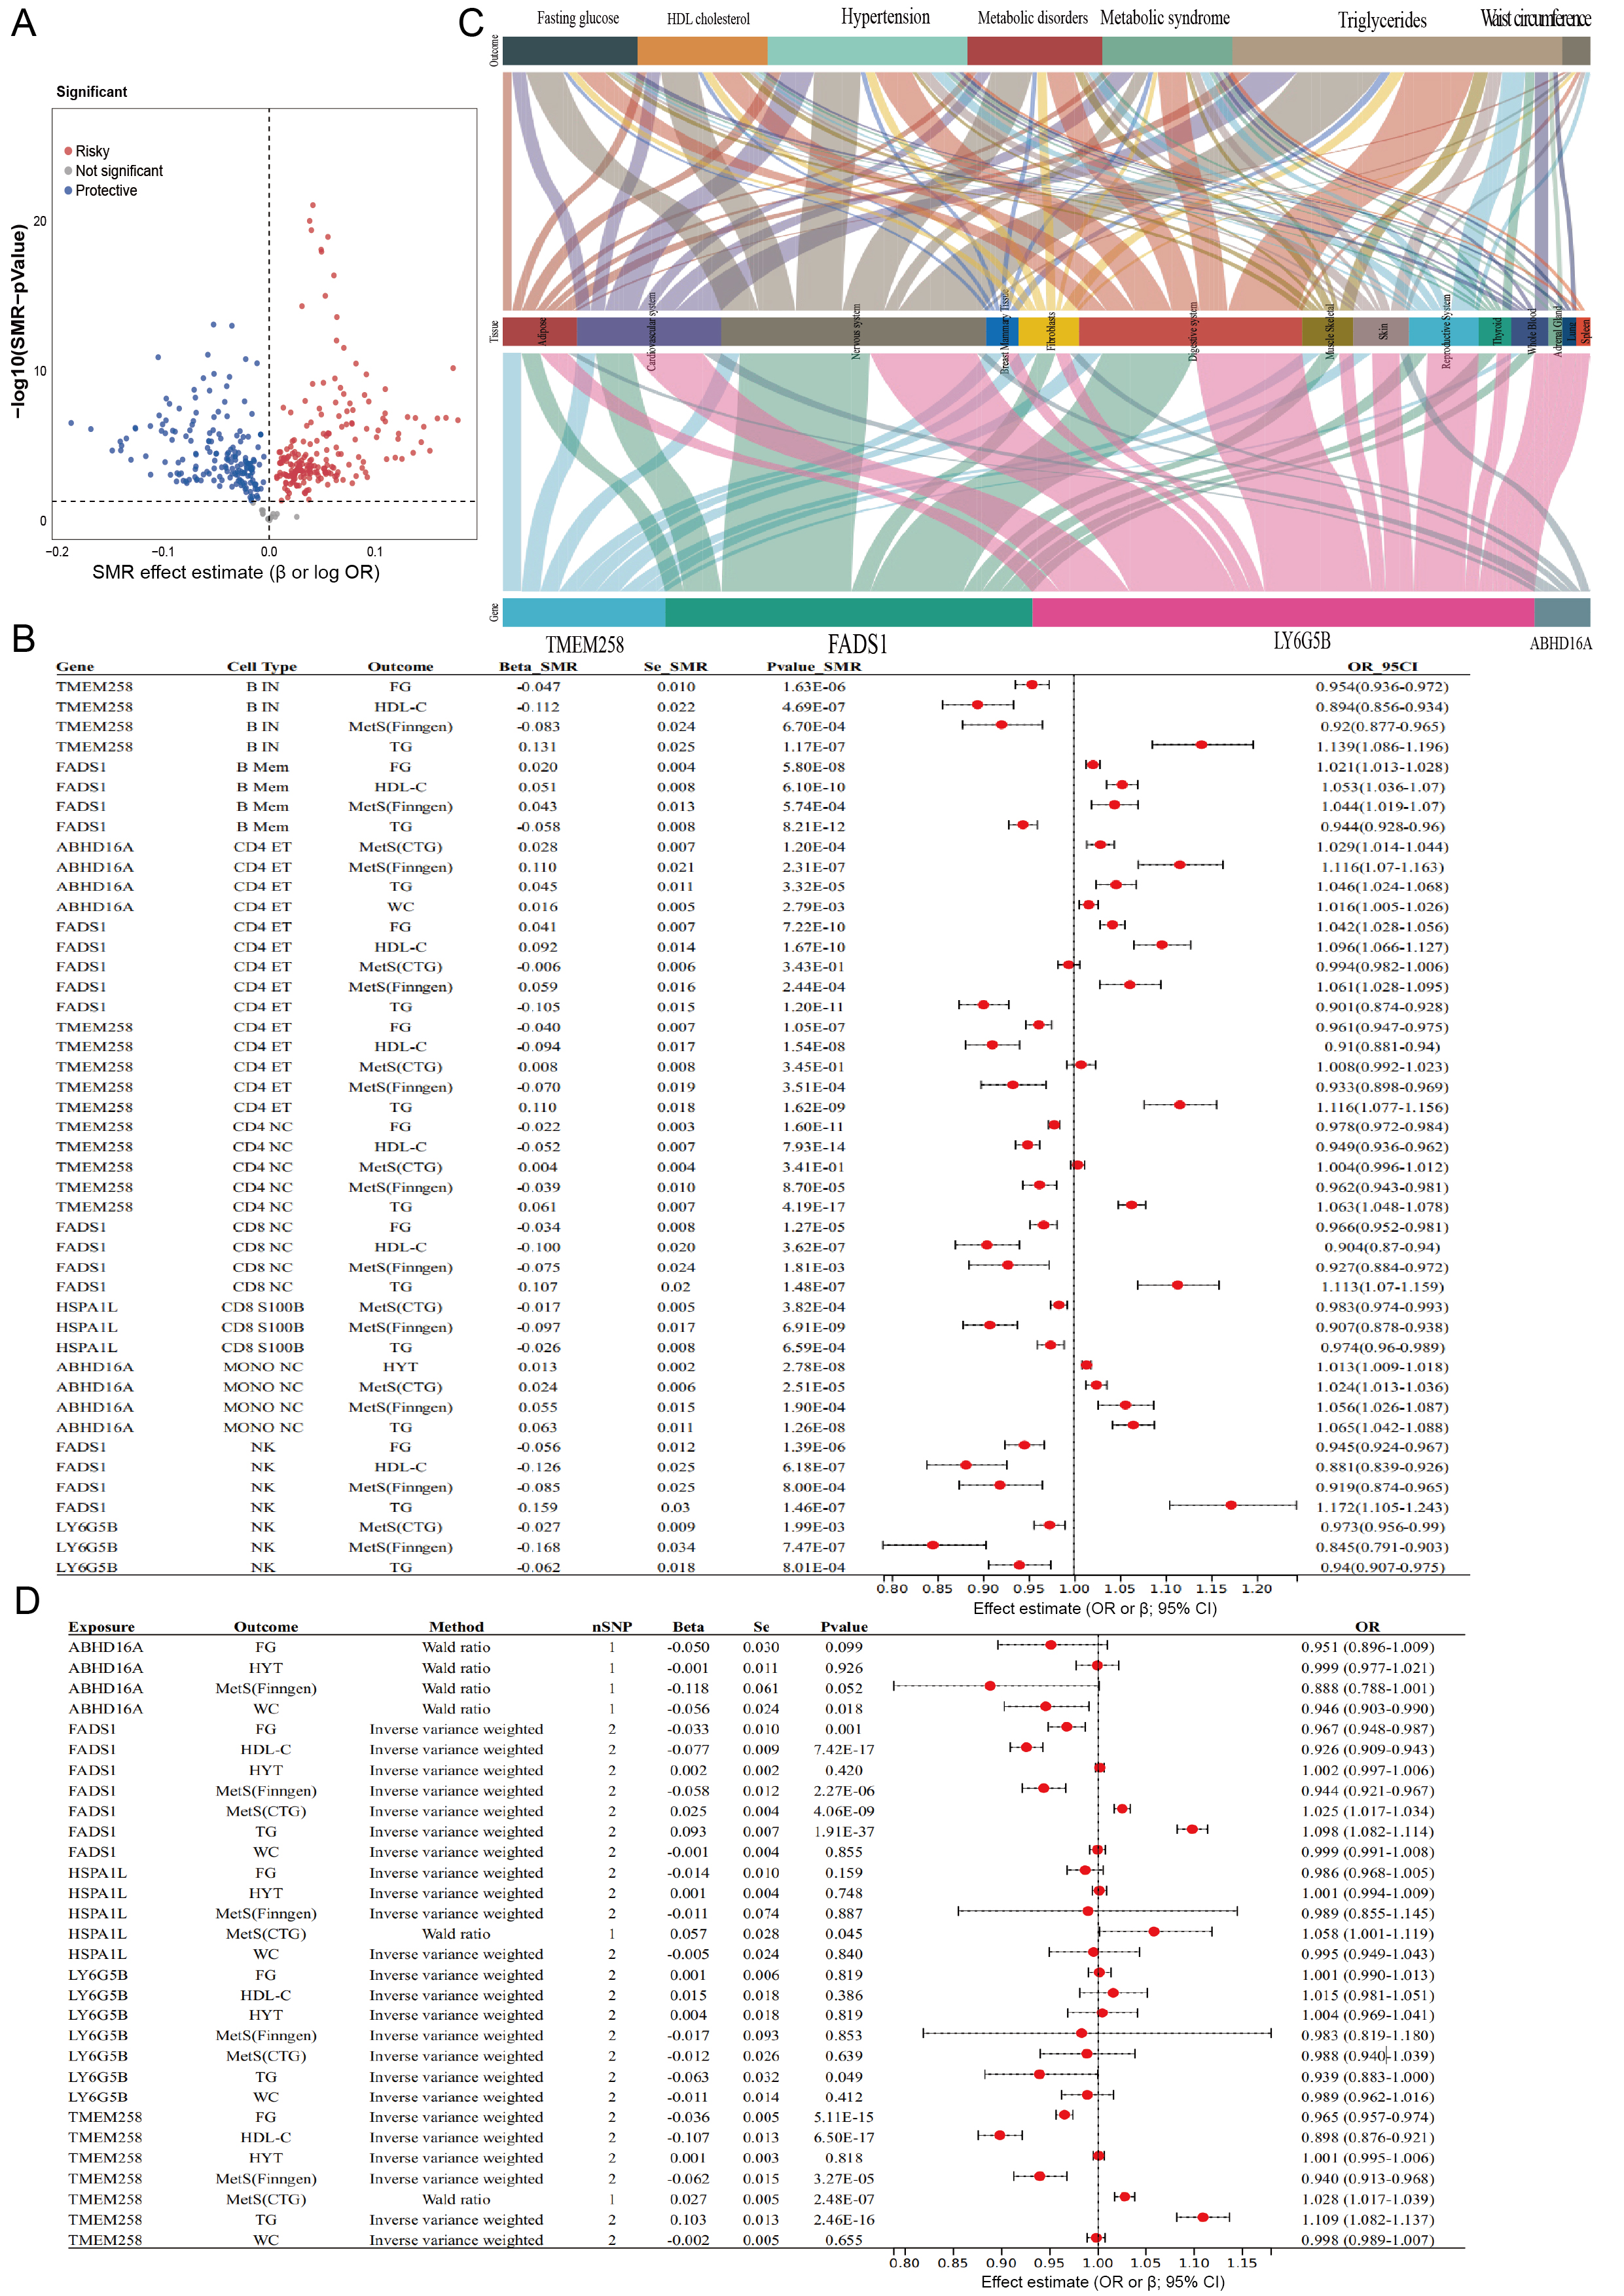
Figure 5. Cross-platform SMR and MR analyses of prioritized gene-trait associations. (A) Volcano plot showing SMR results integrating immune-cell-specific eQTLs with GWAS summary statistics for metabolic traits. The x-axis represents the SMR effect estimate, expressed as β for continuous outcomes or log odds ratios for binary outcomes, and the y-axis shows -log₁₀(SMR P values). Each point corresponds to a gene-trait association evaluated across immune-cell contexts. Red and blue dots indicate positive and negative associations, respectively, after FDR correction, whereas grey dots denote associations that did not meet the FDR threshold; (B) Forest plots summarizing FDR-significant immune-cell-specific SMR associations across FG, HDL-C, TG, WC, MetS, and HTN. Effect estimates and 95% confidence intervals are shown for the associations displayed in the panel. β coefficients are reported for continuous outcomes, whereas odds ratios are reported for binary outcomes. TMEM258 and FADS1 showed recurring associations across multiple lipid-related traits and metabolic-syndrome-related outcomes, whereas LY6G5B and ABHD16A showed more restricted or context-dependent patterns; (C) Sankey diagram illustrating the many-to-many relationships among genes, immune-cell contexts, and metabolic phenotypes represented by FDR-significant SMR associations. The diagram is descriptive and summarizes the observed structure of the evaluated association set; it does not establish shared immune-mediated regulation, biological pleiotropy, or a common causal mechanism. GTEx-based tissue-level SMR/HEIDI analyses provided additional cross-tissue evidence for selected gene-trait associations, although the strength of support varied across tissues [Supplementary Table 8]; (D) Forest plots showing two-sample MR estimates obtained using blood eQTLs from the eQTLGen consortium as exposure instruments. Effect estimates are presented as odds ratios for binary outcomes or β coefficients for continuous outcomes, with 95% confidence intervals. The panel displays selected gene-trait pairs involving TMEM258, FADS1, LY6G5B, and ABHD16A for visualization. Directionally concordant estimates provide cross-platform consistency with the immune-cell-specific SMR findings but do not constitute independent causal validation or replace formal colocalization and HEIDI assessment. Complete eQTL Gene validation results are provided in Supplementary Table 7. CI: Confidence interval; eQTL: expression quantitative trait locus; FDR: false discovery rate; FG: fasting glucose; GWAS: genome-wide association study; HDL-C: high-density lipoprotein cholesterol; HEIDI: heterogeneity in dependent instruments; HTN: hypertension; MetS: metabolic syndrome; MR: Mendelian randomization; OR: odds ratio; SMR: summary-data-based Mendelian randomization; TG: triglycerides; WC: waist circumference.