
fig3
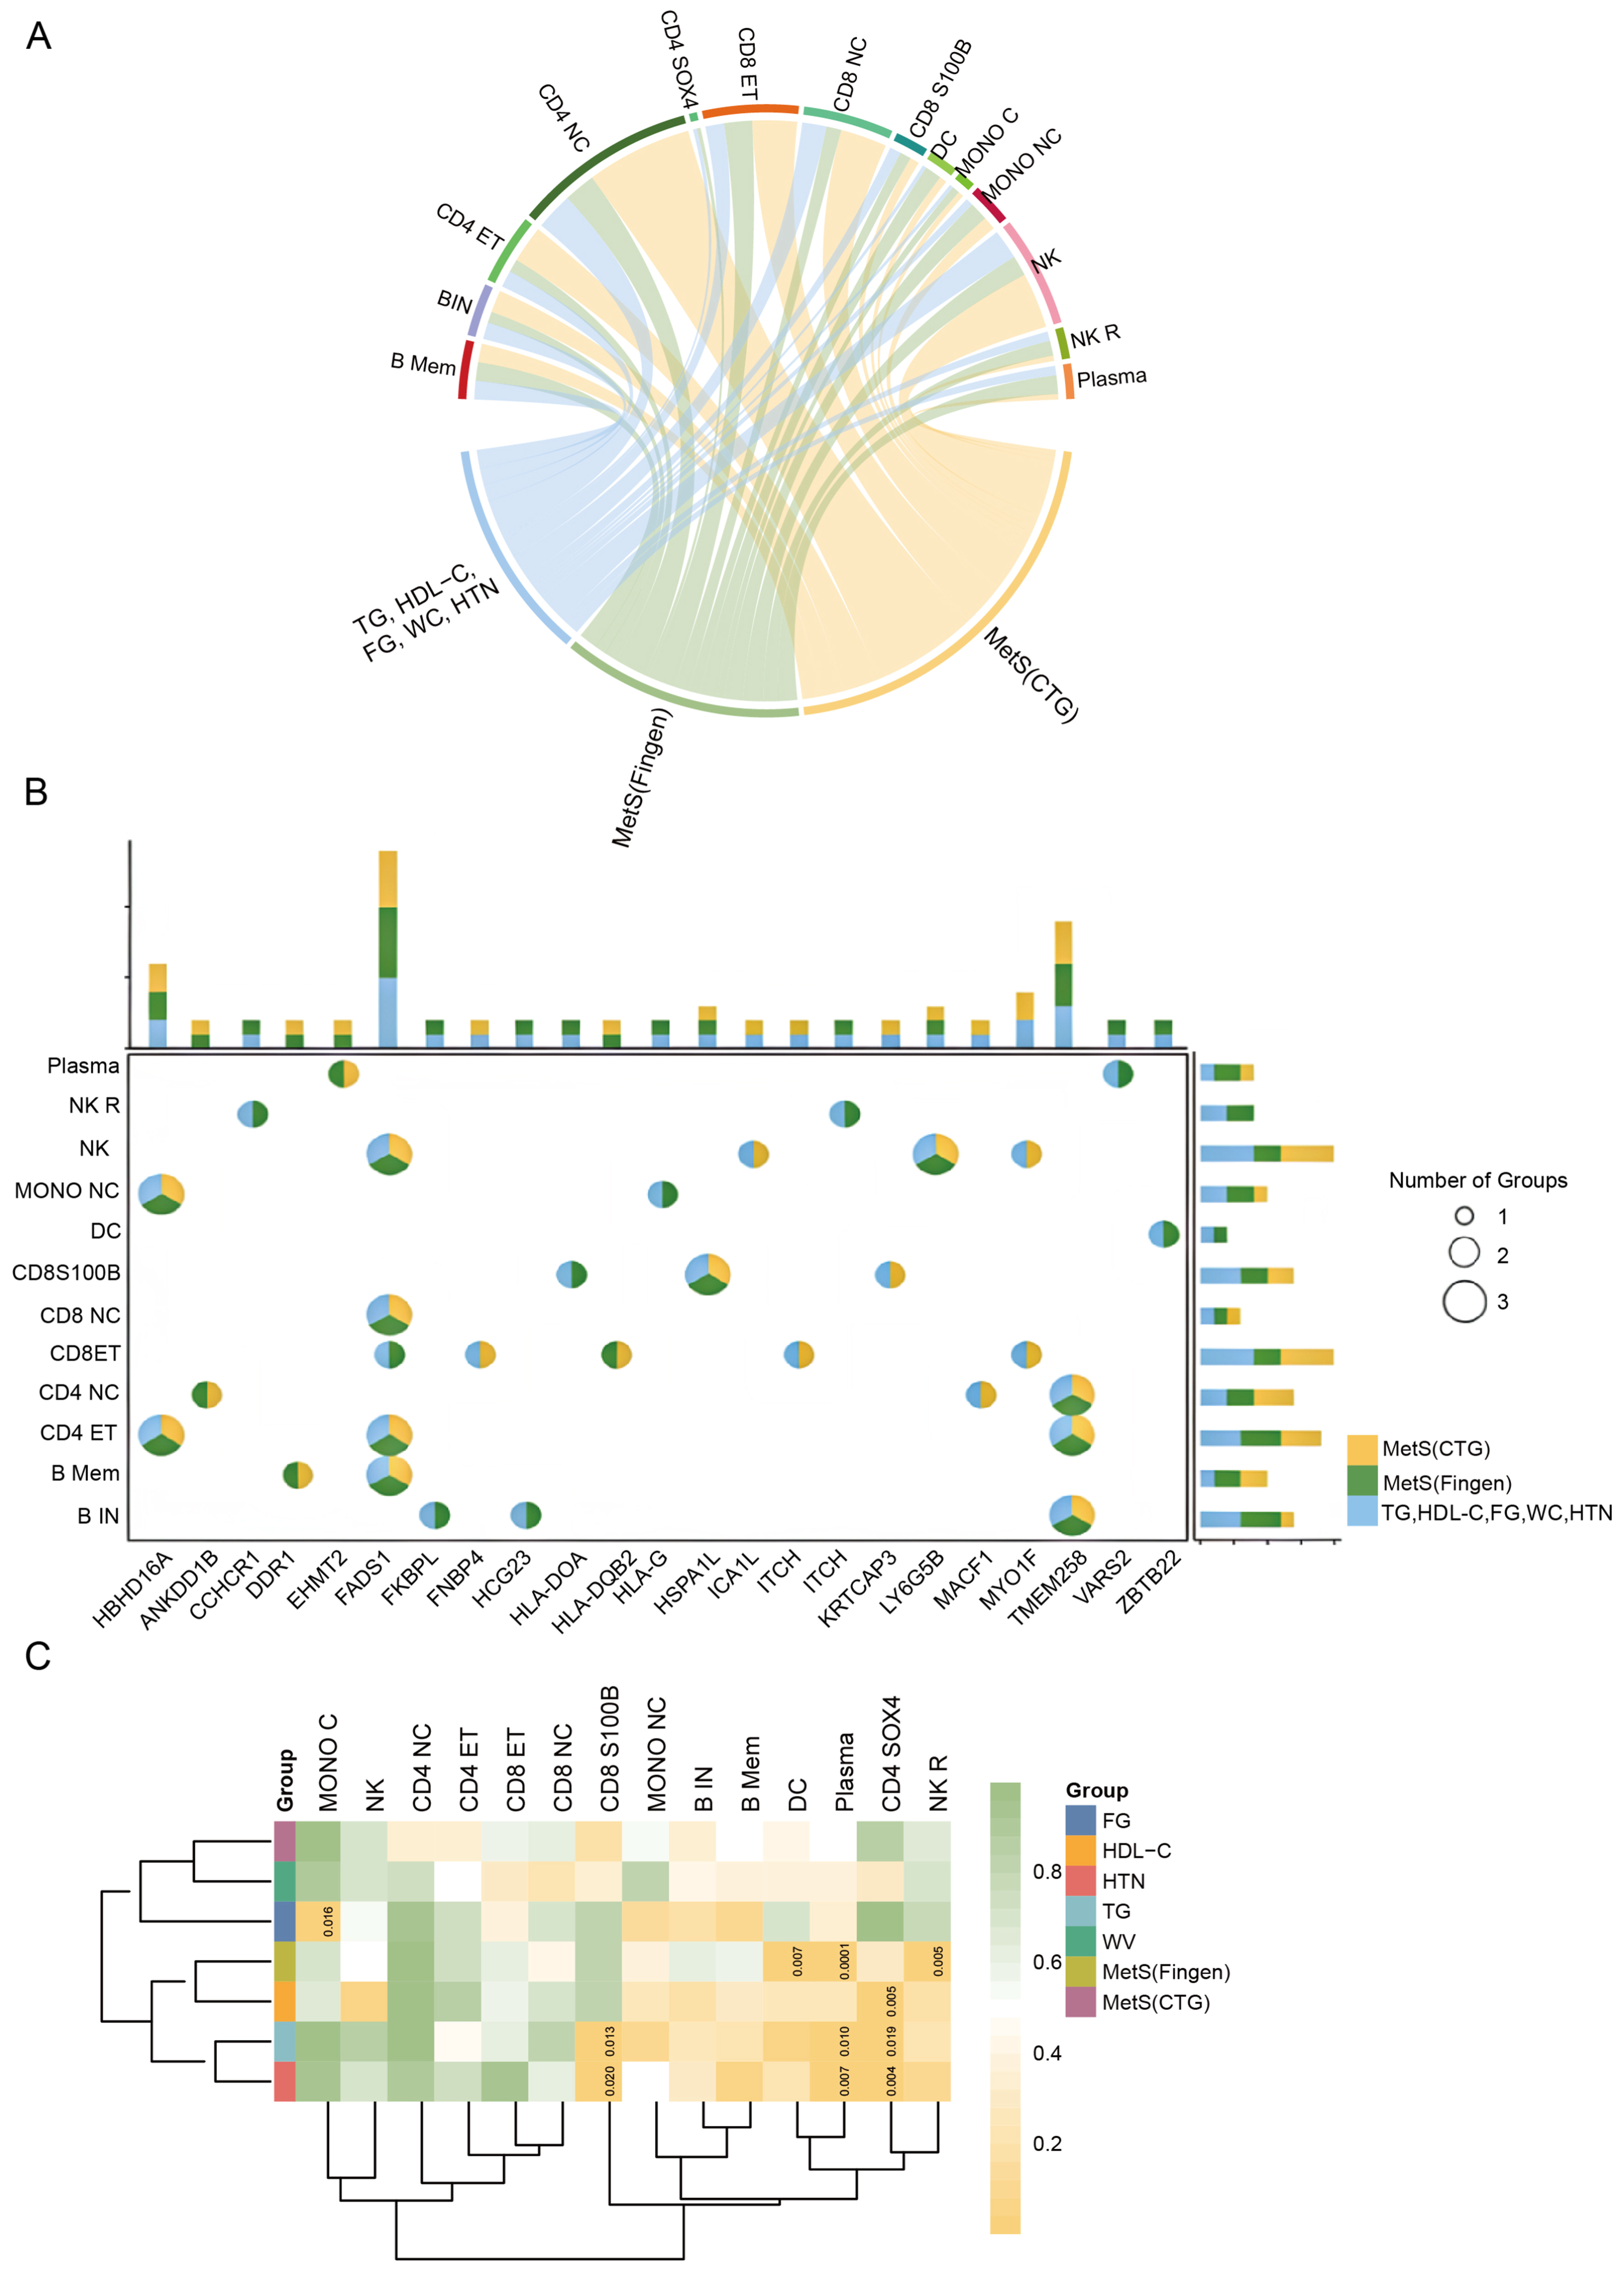
Figure 3. Cross-phenotype and immune cell-resolved patterns of MR-prioritized gene-cell exposures. (A) Circos plot illustrating the relationships between immune-cell populations and metabolic phenotype groups. Links connect immune-cell-specific gene-cell exposures to three phenotype categories: MetS derived from the CTG consortium, MetS derived from FinnGen, and combined cardiometabolic component traits, including TG, HDL-C, FG, WC, and HTN. The plot summarizes the observed overlap of gene-cell exposures across immune-cell contexts and metabolic phenotype groups and does not establish shared biological causality; (B) Bubble plot showing the number of phenotype groups in which each MR-prioritized gene-cell exposure was detected, stratified by immune-cell population. Bubble size represents the number of phenotype groups (one to three), and color indicates the corresponding phenotype category. The bar plots at the top and right summarize the observed distribution of gene-cell exposures across phenotype groups and immune-cell populations. These summaries are descriptive and should not be interpreted as evidence that any immune-cell population functions as a causal hub; (C) Heatmap displaying the observed distribution of immune-cell-specific gene-cell exposures across metabolic phenotype groups. Rows correspond to metabolic phenotype groups, and columns represent immune-cell populations. Hierarchical clustering reflects similarity in the observed gene-phenotype association patterns. The clustering therefore summarizes detection patterns rather than formally established cell-type-specific regulatory mechanisms. Between-cell-type effect heterogeneity was not formally tested. Differences in the number and distribution of detected associations may reflect unequal effective eQTL sample sizes, statistical power, and genetic instruments shared across cell types. Accordingly, these plots should be interpreted as detection-limited, descriptive cell-resolved patterns and do not establish cell-type-specific causal mediation, lineage specificity, or distinct regulatory compartmentalization. CTG: Complex Trait Genetics; eQTL: Expression quantitative trait locus; FG: fasting glucose; HDL-C: high-density lipoprotein cholesterol; HTN: hypertension; MR: Mendelian randomization; TG: triglycerides; WC: waist circumference.