
fig2
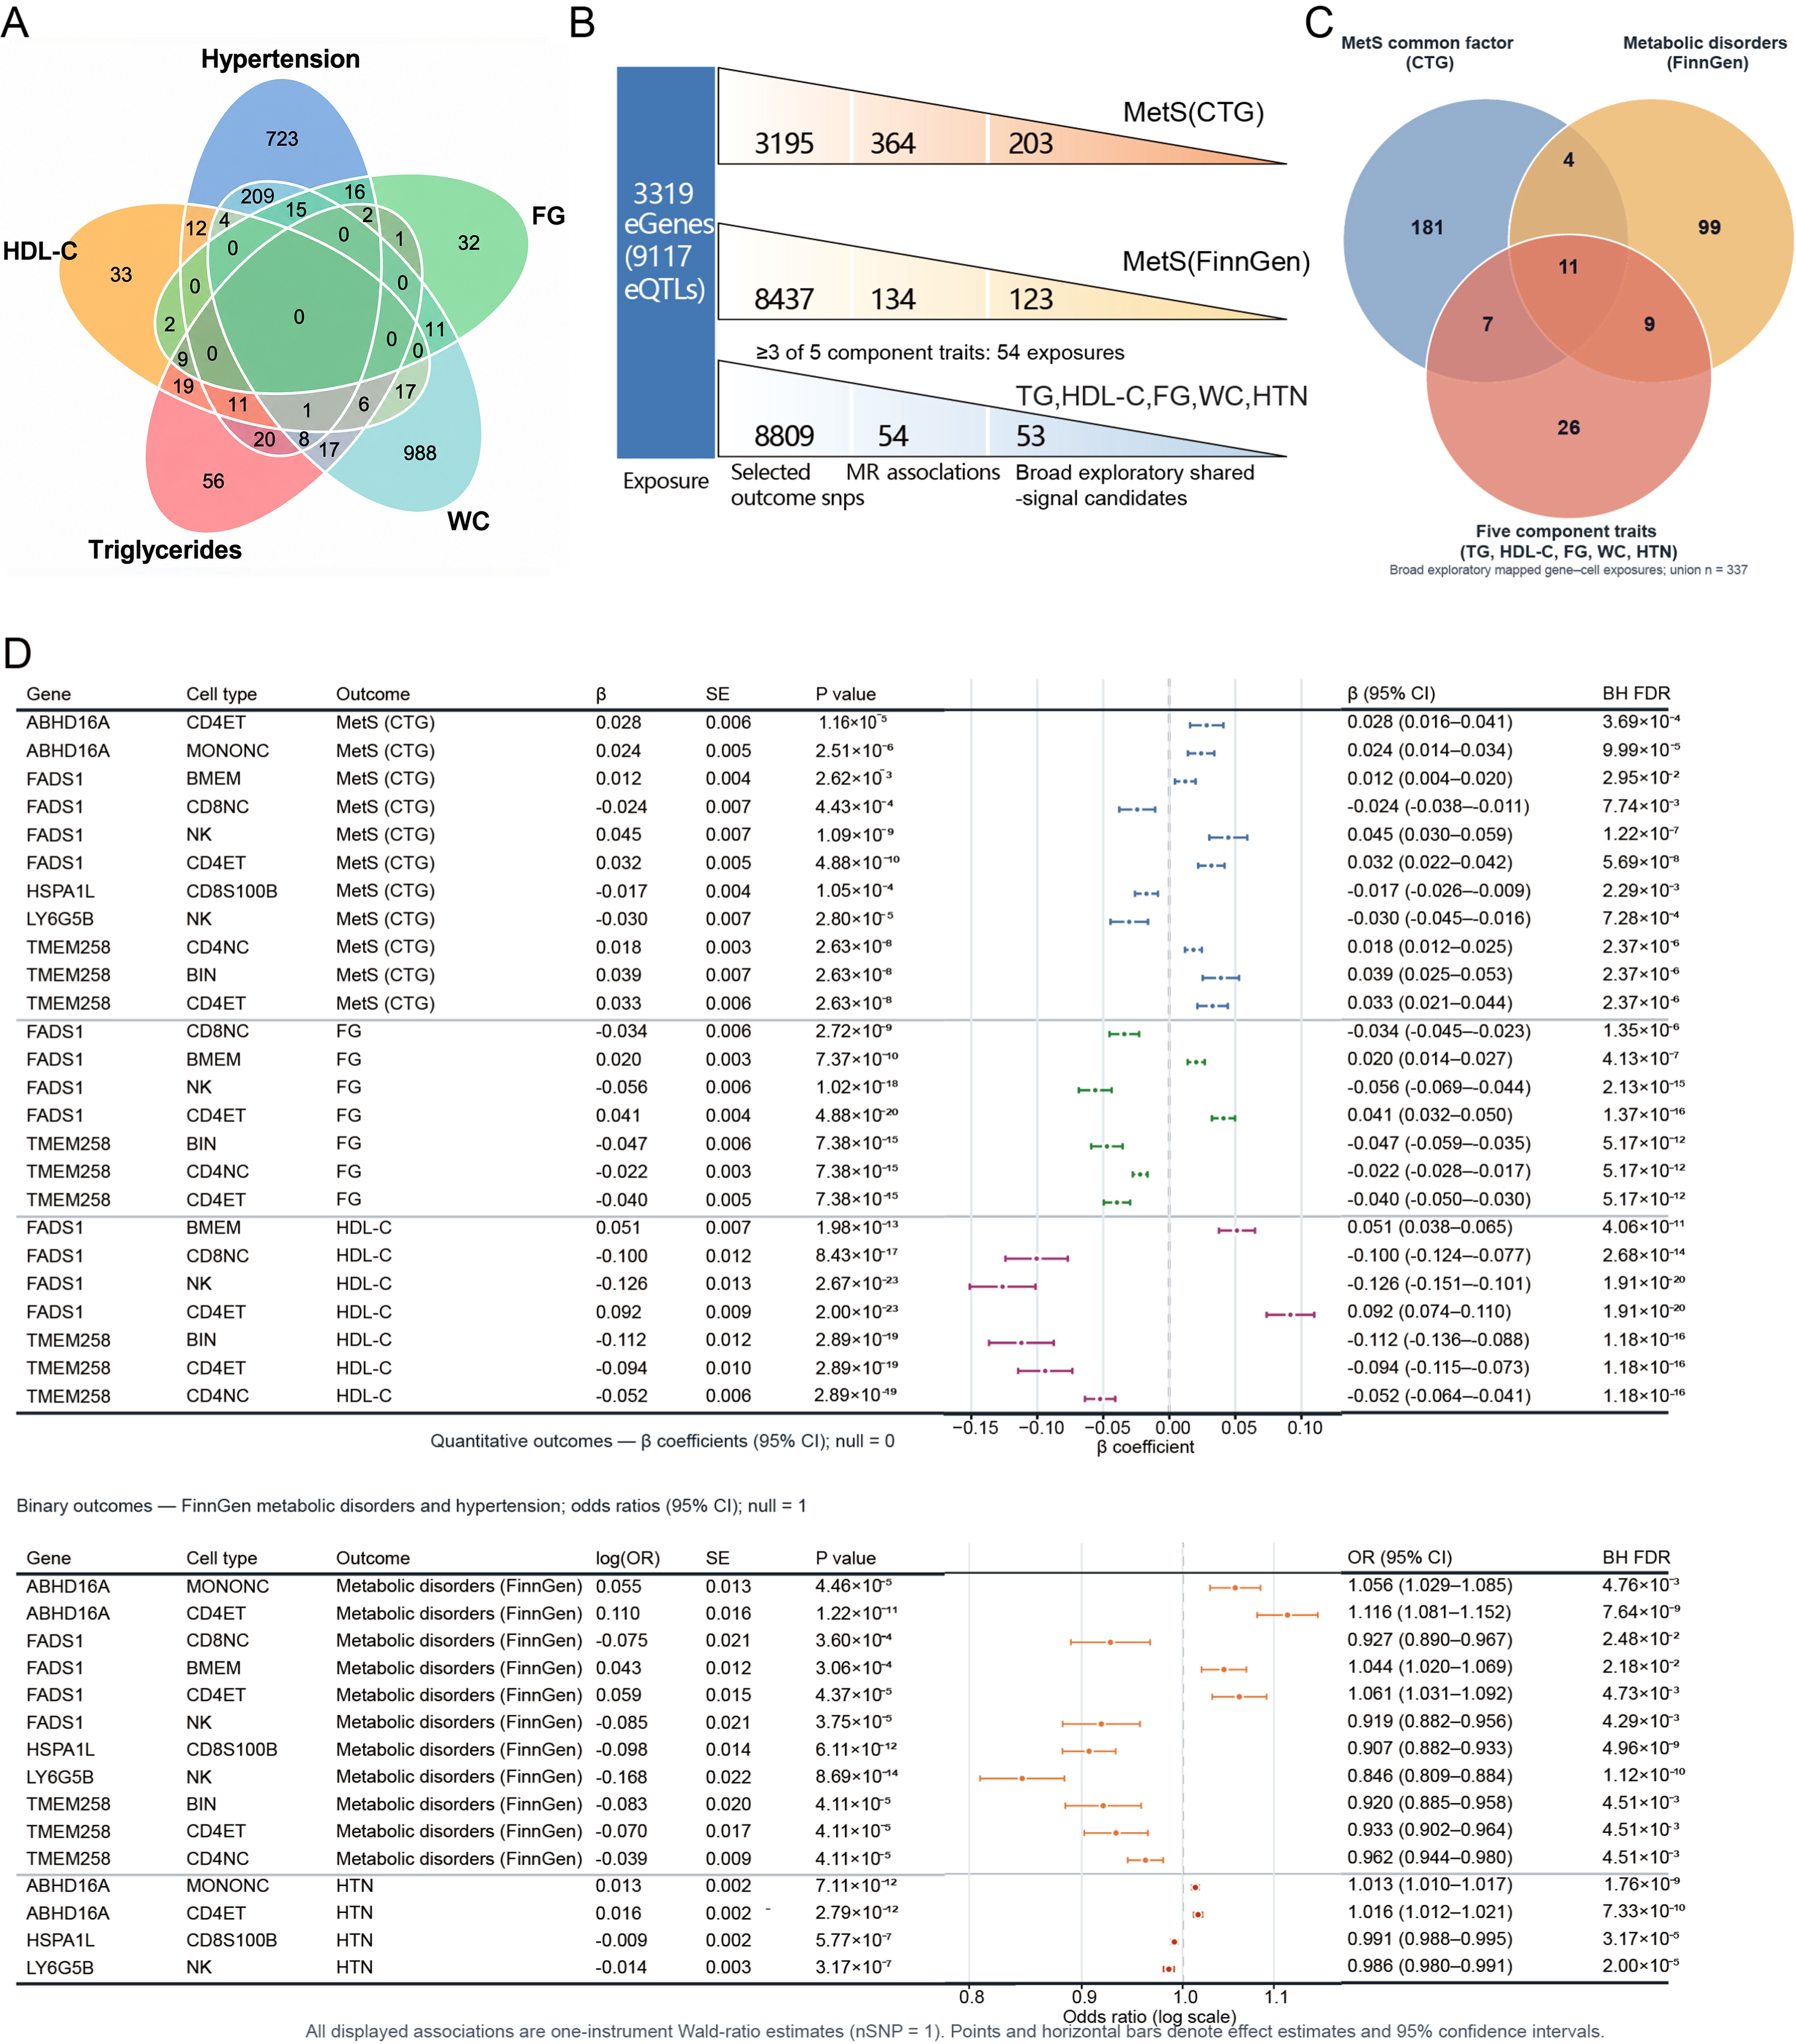
Figure 2. Mendelian randomization prioritizes immune-cell-specific gene-trait associations across metabolic phenotypes. (A) Venn diagram showing the overlap of FDR-significant gene-cell exposures across five metabolic-syndrome component traits: TG, HDL-C, FG, WC, and HTN. Each entry represents a gene-cell exposure rather than a unique gene. Intersections indicate that the same immune-cell-specific gene-expression exposure was associated with more than one component trait by the primary MR analysis. These overlaps were considered evidence of cross-trait recurrence and not proof of biological pleiotropy or shared causality; (B) Flow diagram summarizing the selection of gene-cell exposures for regional mapping. The starting set comprised 3,319 unique eQTL-associated genes represented by 9,117 cell-type-specific instrument records. After matching instruments to the outcome GWAS datasets, 3,195 instrument records were available for the CTG metabolic-syndrome common-factor outcome, 8,437 for the FinnGen metabolic-disorders outcome, and 8,809 for the five component-trait datasets. Primary MR identified 364 FDR-significant gene-cell exposures for the CTG outcome and 134 for the FinnGen outcome. For the component-trait analysis, 54 gene-cell exposures associated with at least three of the five component traits were carried forward, corresponding to 163 gene-cell-trait regions. The ≥ 3-of-5 threshold was used as an exploratory filtering rule to retain recurrent component-trait signals while limiting the number of regions entering downstream mapping; it was not intended to establish biological pleiotropy and was not applied to the CTG or FinnGen branches. As sensitivity counts, 378 exposures met the ≥ 2-of-5 criterion and one exposure met the ≥ 4-of-5 criterion. The final numbers of 203, 123, and 53 represent broad exploratory mapped gene-cell exposures for the CTG, FinnGen, and component-trait groups, respectively. This broad set incorporated both formal Bayesian colocalization findings and associations supported only by the exploratory linkage-disequilibrium screen; it therefore should not be interpreted as a set of formally colocalized associations; (C) Venn diagram showing the overlap of the broad exploratory mapped gene-cell exposures among the CTG metabolic-syndrome common-factor outcome, the FinnGen metabolic-disorders outcome, and the five component traits. The three sets contained 203, 123, and 53 gene-cell exposures, respectively, with 337 unique gene-cell exposures in their union. Thirty-one gene-cell exposures occurred in at least two mapping groups, including 11 represented in all three groups. After collapsing immune-cell contexts and duplicate outcome records, the 337 gene-cell exposures corresponded to 192 unique genes. Of these, 28 genes were represented in at least two mapping groups and six were represented in all three groups. Accordingly, the 192-gene set was treated as a broad exploratory candidate pool, rather than a set of 192 formally colocalized or causally established genes; (D) Forest plots showing selected primary MR estimates for representative immune-cell-specific gene-trait associations involving FADS1, TMEM258, ABHD16A, HSPA1L, and LY6G5B. Because every displayed association was based on one genetic instrument, estimates were obtained using the Wald-ratio method. Effect estimates and 95% confidence intervals are reported as β coefficients for quantitative outcomes - the CTG metabolic-syndrome common factor, fasting glucose, and high-density lipoprotein cholesterol - and as odds ratios for binary outcomes - the FinnGen metabolic-disorders endpoint and hypertension. Nominal P values and Benjamini-Hochberg FDR-adjusted P values are shown. The selected associations illustrate variation in the direction and magnitude of MR estimates across genes, immune-cell contexts, and metabolic outcomes and do not, by themselves, establish causal effects. Complete primary MR results are provided in Supplementary Table 3. Formal approximate Bayes factor and SuSiE colocalization results are provided in Supplementary Table 5A-C, whereas the exploratory linkage-disequilibrium mapping results and classification of the broad candidate set are provided separately in Supplementary Table 5D. CI: Confidence interval; CTG: Complex Trait Genetics; eQTL: expression quantitative trait locus; FDR: false discovery rate; FG: fasting glucose; GWAS: genome-wide association study; HDL-C: high-density lipoprotein cholesterol; HTN: hypertension; LD: linkage disequilibrium; MetS: metabolic syndrome; MR: Mendelian randomization; OR: odds ratio; SuSiE: sum of single effects; TG: triglycerides; WC: waist circumference.