
fig1
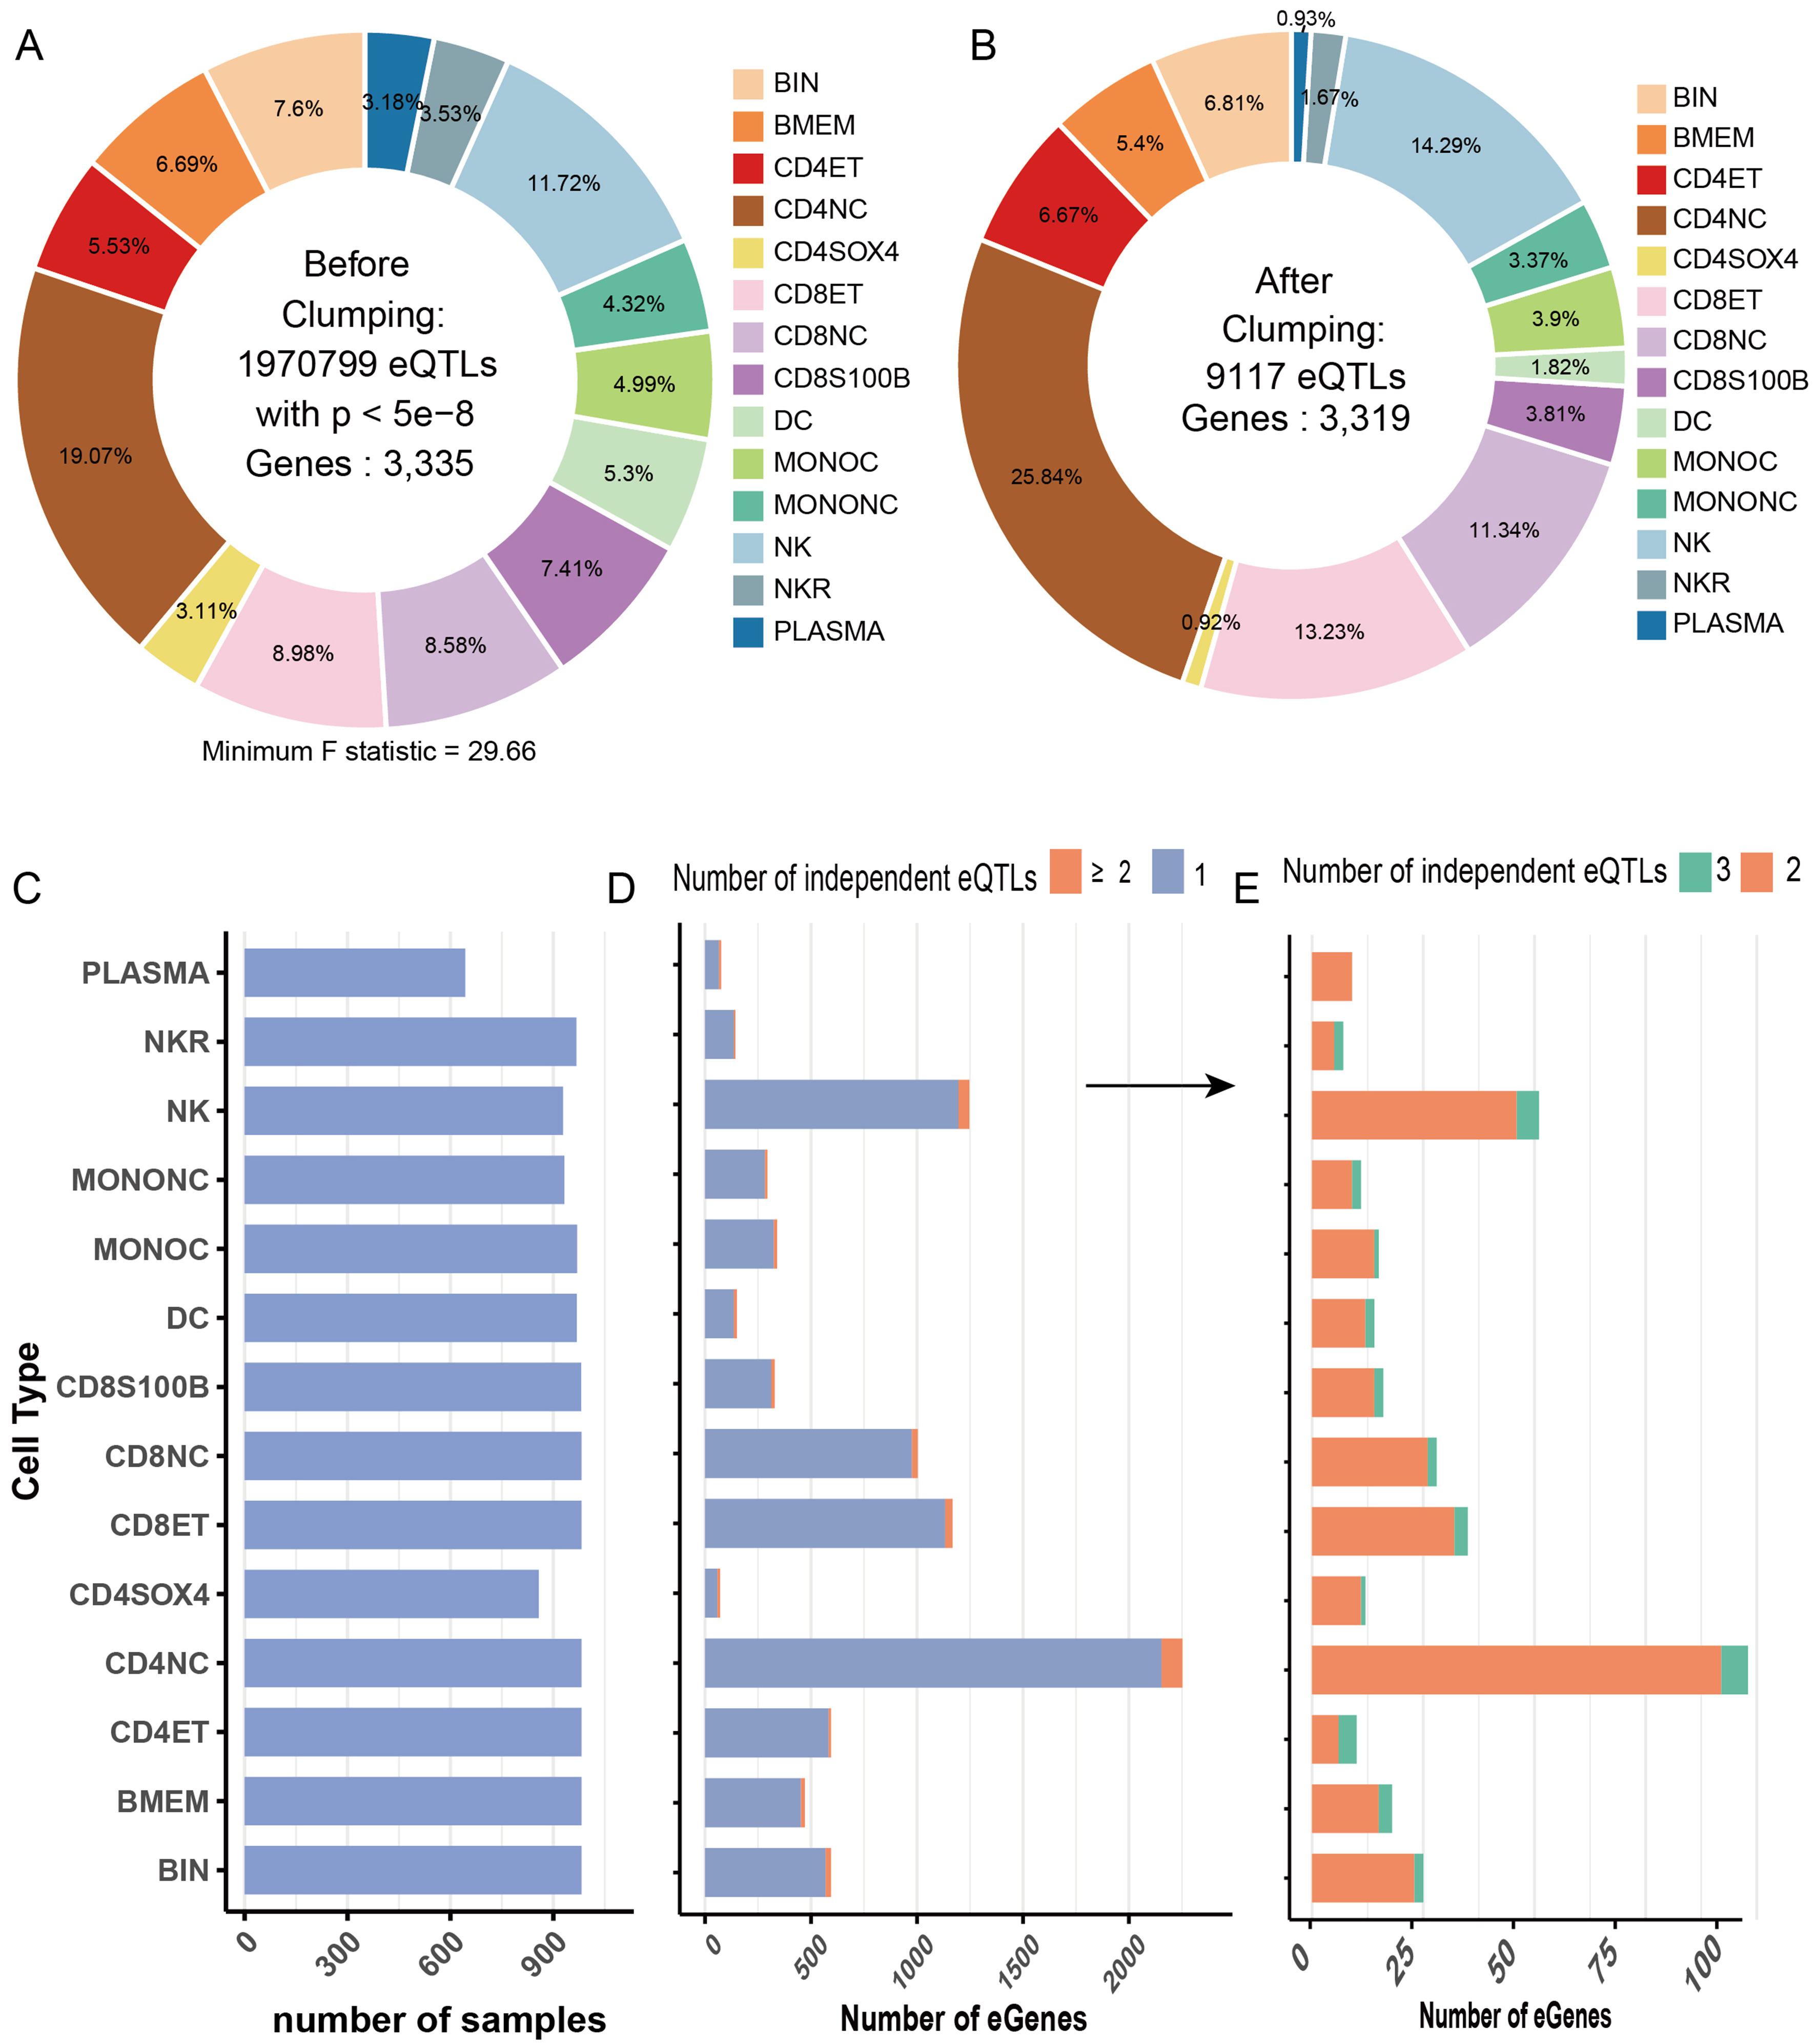
Figure 1. Selection and distribution of immune cell-specific cis-eQTL instruments for Mendelian randomization analysis. (A) Proportional distribution of 1,970,799 genome-wide-significant cis-eQTL association records (P < 5 × 10⁻⁸) across 14 immune-cell populations before linkage disequilibrium clumping. These records corresponded to 3,335 unique genes in the OneK1K peripheral-blood mononuclear-cell dataset; (B) Distribution of retained instrument records across immune-cell populations after gene- and cell-type-specific LD clumping. The number of unique genes decreased from 3,335 before clumping to 3,319 after clumping. Clumping was performed using r2 < 0.001 within a 10,000-kb window. This intentionally broad window was used to minimize the retention of correlated cis-instruments across extended regulatory regions. A total of 9,117 cell-type-specific cis-eQTL instrument records, representing 8,733 gene-cell exposures and 3,319 unique genes, were retained for downstream analyses. The minimum F statistic among the retained instruments was 29.66. Because the same genetic variant could serve as an instrument for more than one gene or immune-cell context, the 9,117 instrument records corresponded to 6,776 unique variant identifiers; (C) Cell-type-specific donor sample sizes in the OneK1K single-cell eQTL dataset; (D) Number of cell-type-specific eQTL-associated genes, grouped according to whether their expression was instrumented by exactly one or by two or more independent cis-eQTLs. A gene represented in more than one immune-cell population was counted separately in each corresponding gene-cell context; (E) Expanded view of the multi-instrument group shown in panel D, separating gene-cell exposures supported by exactly two or exactly three independent cis-eQTL instruments. No evaluated gene-cell exposure contained more than three independent instruments. Source data and cell-type-specific donor sample sizes are provided in Supplementary Table 1A, and complete instrument-level information is provided in Supplementary Table 1D. BIN: Naïve/immature B cells; BMEM: memory B cells; CD4ET: CD4+ effector-memory/TEMRA T cells; CD4NC: CD4+ naïve/central-memory T cells; CD4SOX4: CD4+ SOX4-expressing T cells; CD8ET: CD8+ effector-memory T cells; CD8NC: CD8+ naïve/central-memory T cells; CD8S100B: CD8+ S100B-expressing T cells; DC: dendritic cells; eQTL: expression quantitative trait locus; LD: linkage disequilibrium; MONOC: classical monocytes; MONONC: non-classical monocytes; NK: natural killer cells; NKR: natural killer recruiting cells; PLASMA: plasma cells; TEMRA: terminally differentiated effector memory T cells re-expressing CD45RA.