


fig4
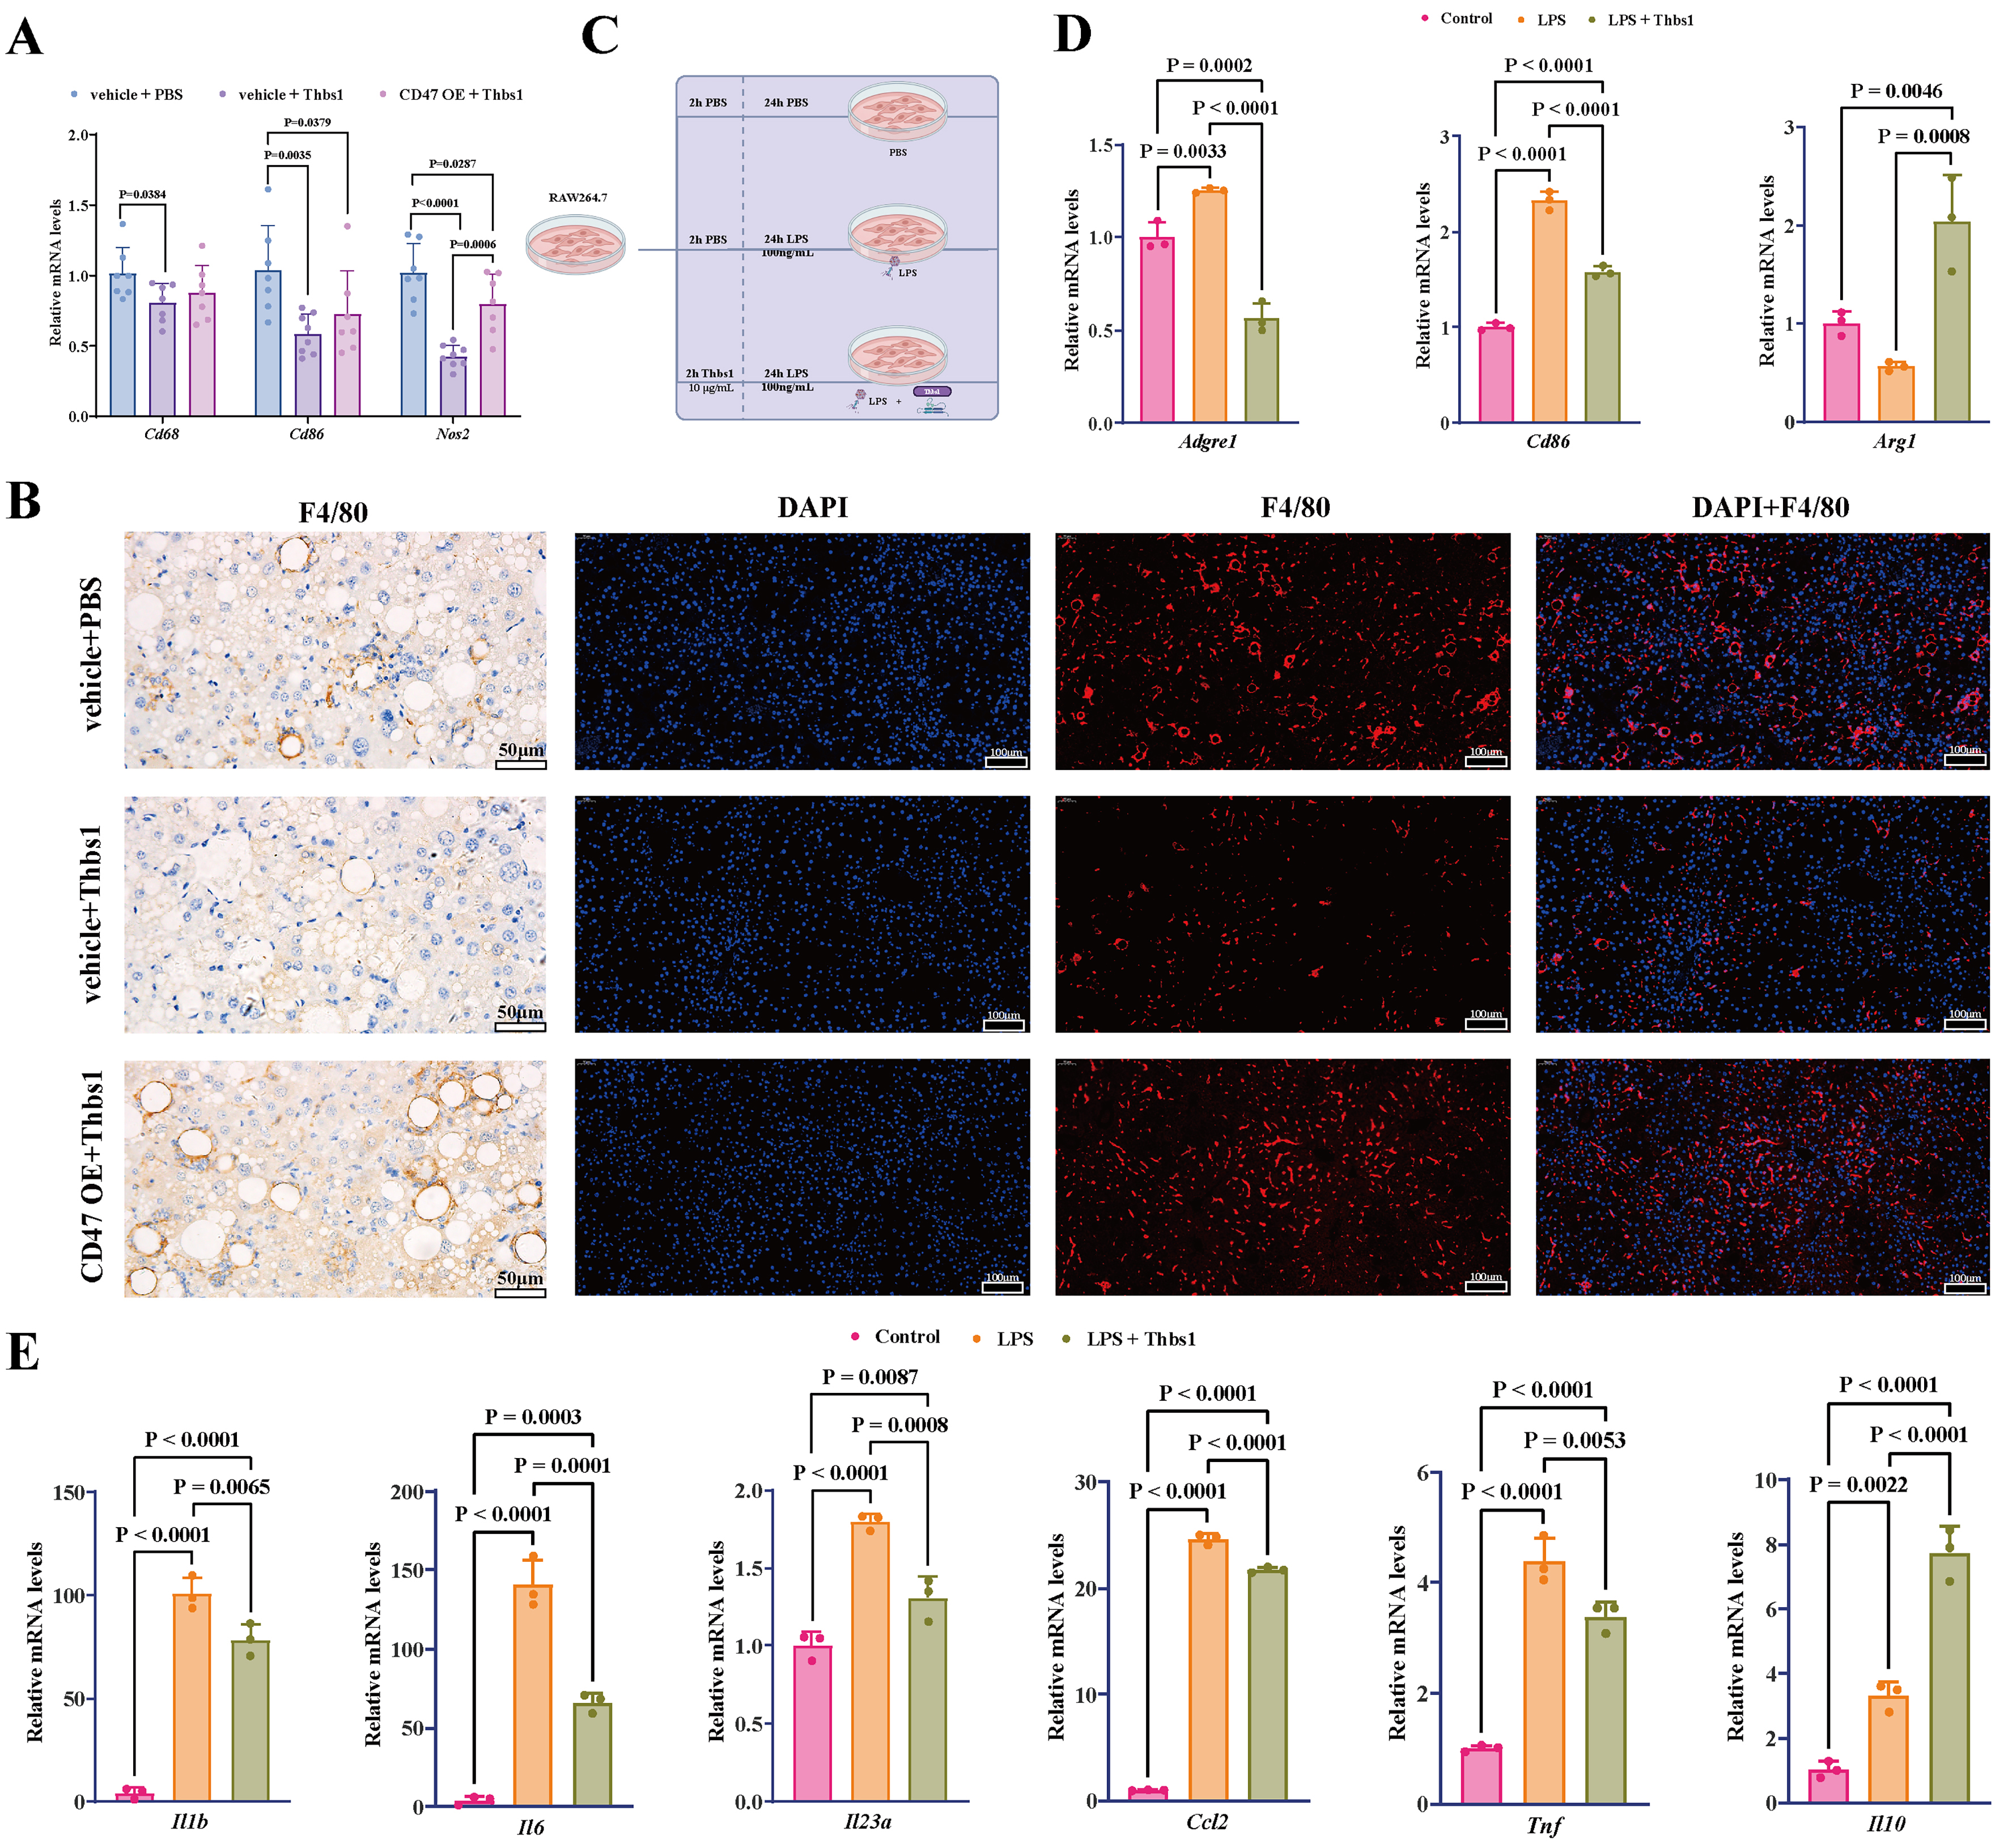
Figure 4. Thbs1 suppressed M1 macrophage-associated signatures via CD47. (A) Thbs1 treatment reduced hepatic mRNA expression of the macrophage marker Cd68 and M1 markers Cd86 and Nos2; CD47 OE attenuated these effects; (B) Representative F4/80 immunohistochemistry (scale bar = 50 μm) and immunofluorescence staining (scale bar = 100 μm) of mouse liver sections. Images are provided as qualitative representations of hepatic macrophage infiltration; (C) In vitro experimental design to confirm that the effect of Thbs1 is related to the inhibition of M1 macrophage-associated signatures; (D and E) Effects of Thbs1 on M1/M2 markers and cytokines in LPS‑stimulated RAW264.7 cells. RAW264.7 macrophages were stimulated with LPS (100 ng/mL) for 24 h in the presence or absence of Thbs1. For in vivo experiments, n = 8 mice per group were initially included; after outlier exclusion using ROUT (Q = 5%), 6-8 samples per group were used for statistical analysis. In vitro experiments were independently repeated three times (n = 3). Data are presented as mean ± SD. Statistical significance was determined using one-way ANOVA, with Tukey’s multiple comparisons test for correction. P < 0.05 was considered statistically significant. ANOVA: Analysis of variance; CD47: cluster of differentiation 47; LPS: lipopolysaccharide; M1: classically activated macrophage phenotype; M2: alternatively activated macrophage phenotype; mRNA: messenger RNA; OE: overexpression; RAW264.7: murine macrophage cell line RAW264.7; ROUT: robust regression and outlier removal; SD: standard deviation; Thbs1: thrombospondin-1; Cd68: cluster of differentiation 68; Cd86: cluster of differentiation 86; Nos2: nitric oxide synthase 2; Adgre1: adhesion G protein-coupled receptor E1; Arg1: arginase 1; Il1β: interleukin-1β; Il6: interleukin-6; Il23α: interleukin-23α; Ccl2: C-C motif chemokine ligand 2; Tnf: tumor necrosis factor-α; Il10: interleukin-10.


