

fig2
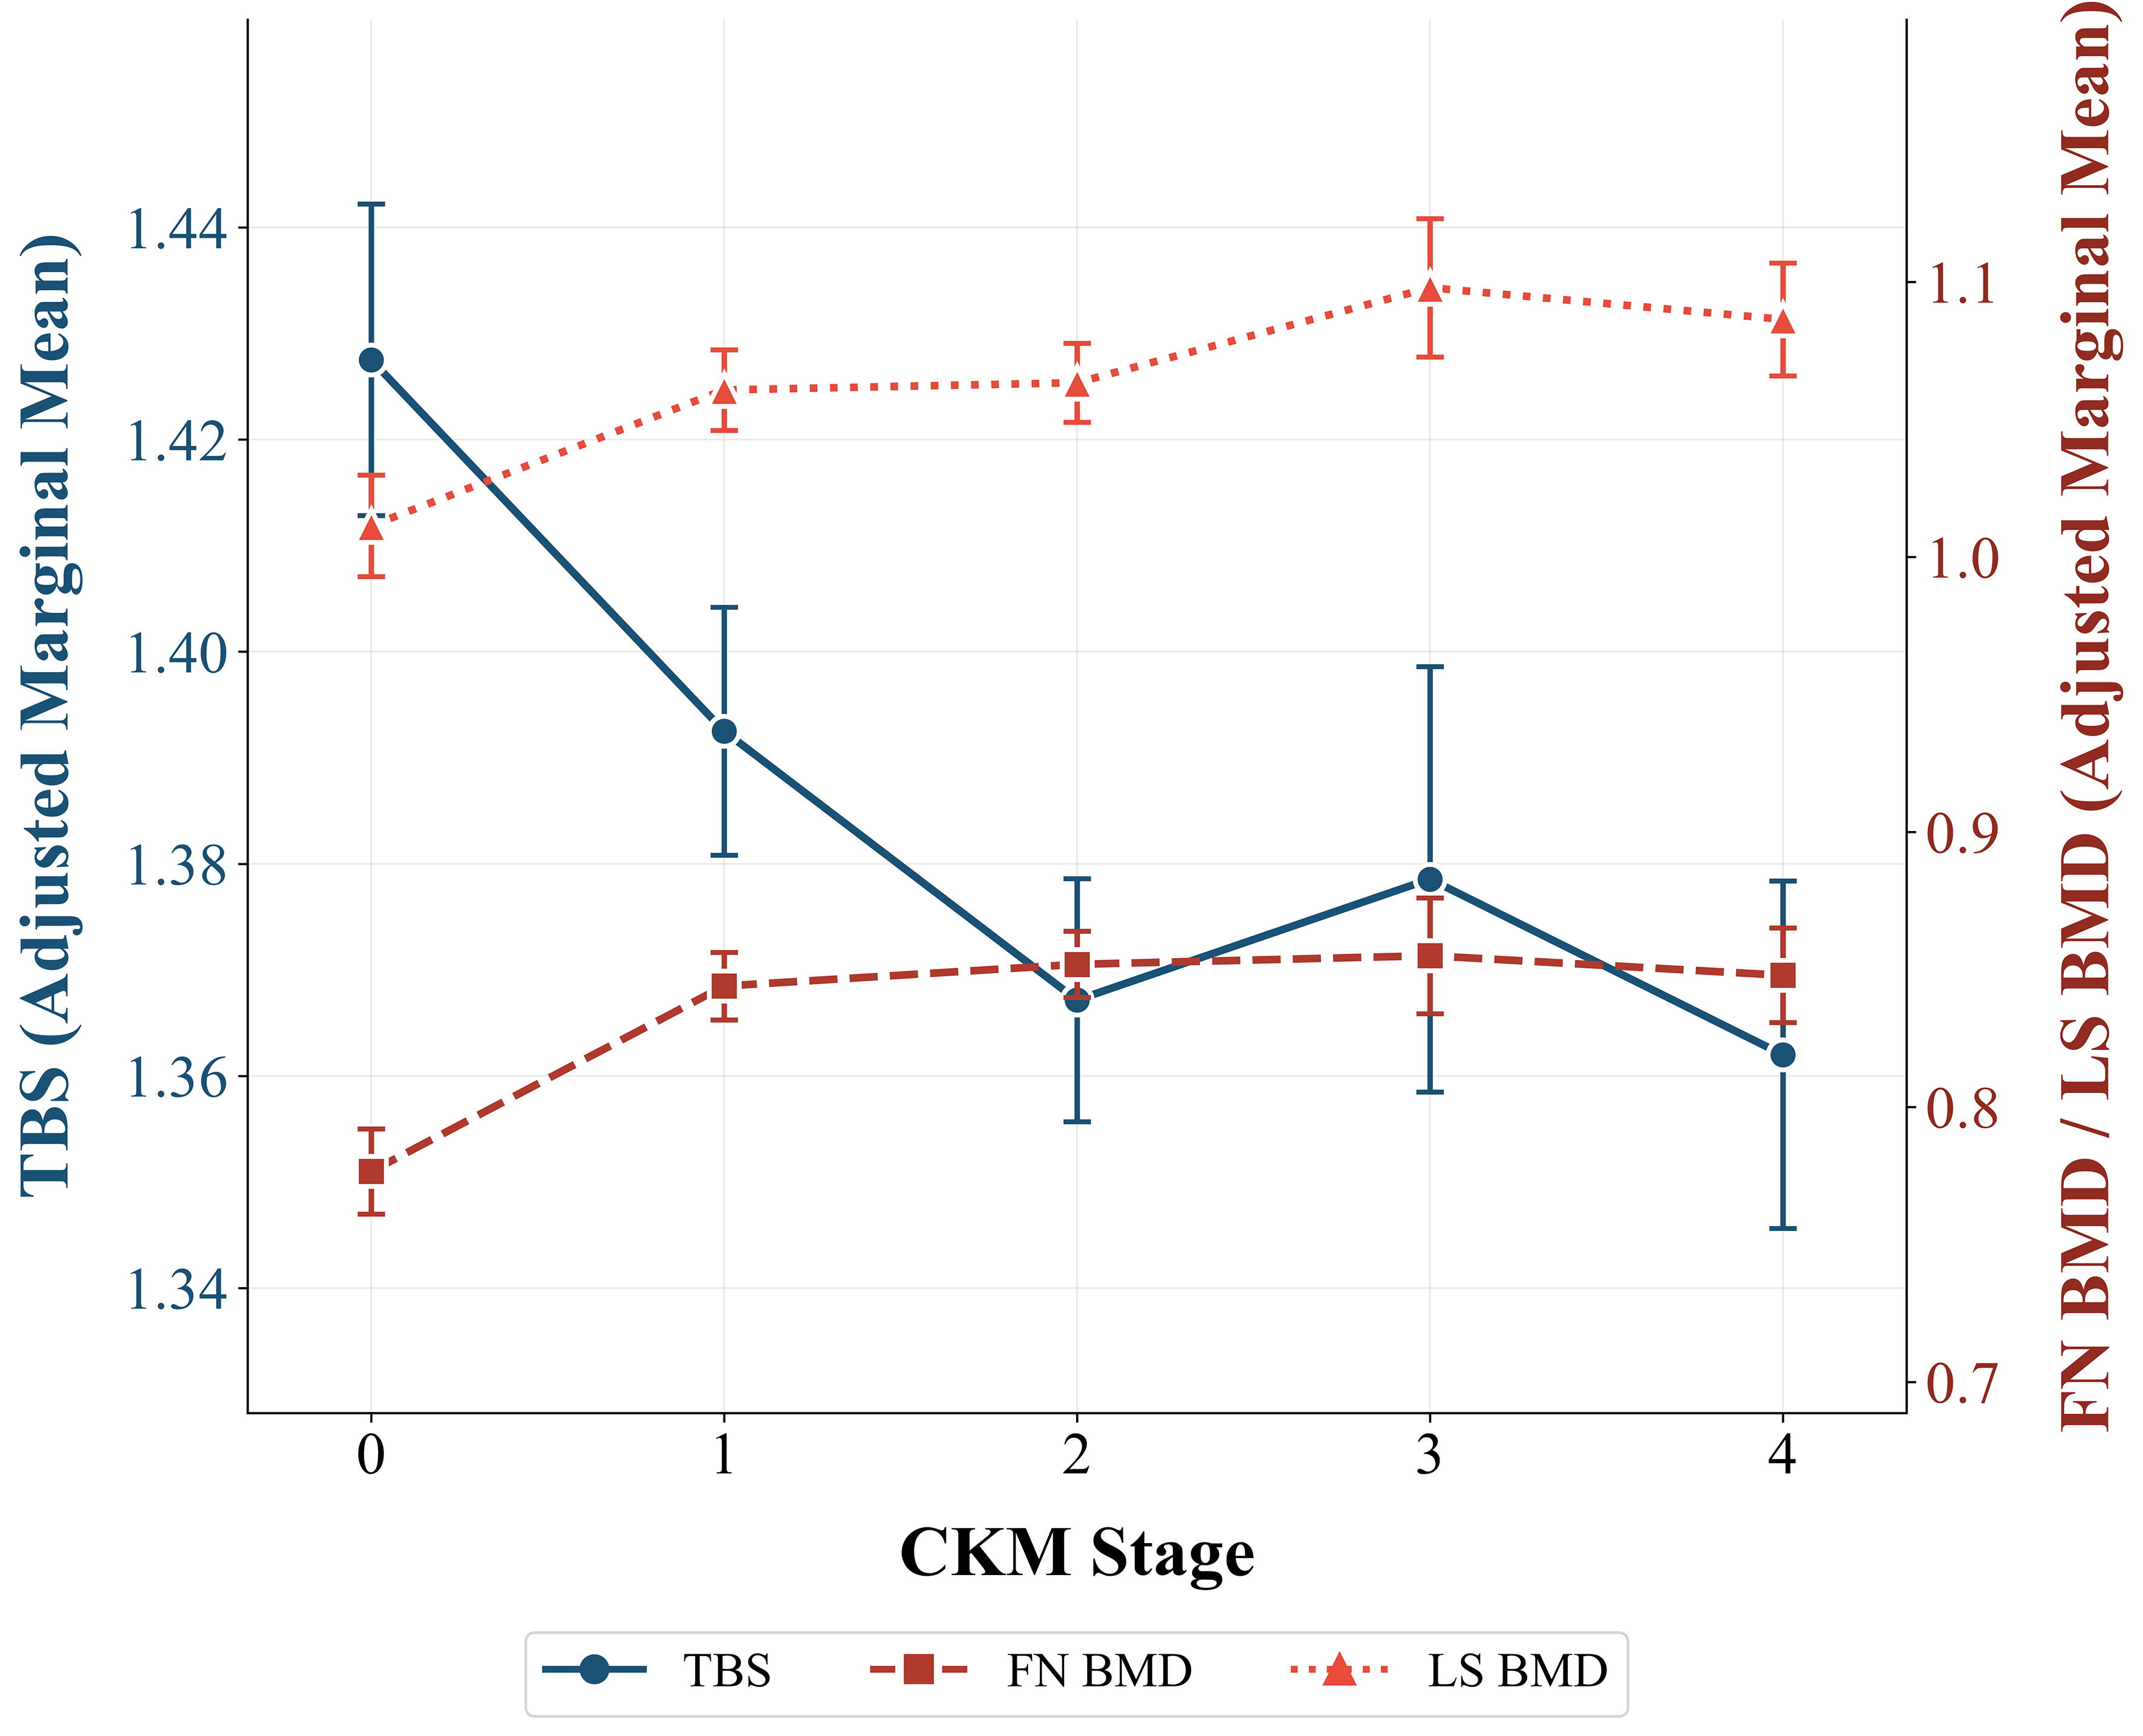
Figure 2. Adjusted marginal means of TBS, FN BMD, and LS BMD across CKM syndrome stages; TBS (unitless) and BMD (g/cm2) are presented on separate y-axes due to their distinct measurement scales and variation ranges. The visual intersection of the trend lines does not imply mathematical equivalence but illustrates the discordant trajectories of microarchitectural degradation (declining TBS) and areal bone density preservation (increasing BMD) with advancing CKM stages. CKM: Cardiovascular-kidney-metabolic; TBS: trabecular bone score; FN: femoral neck; LS: lumbar spine; BMD: bone mineral density.





