


fig3
From: Variation spectrum and reevaluation of selected VUS of ATP7B in a Chinese Wilson disease cohort
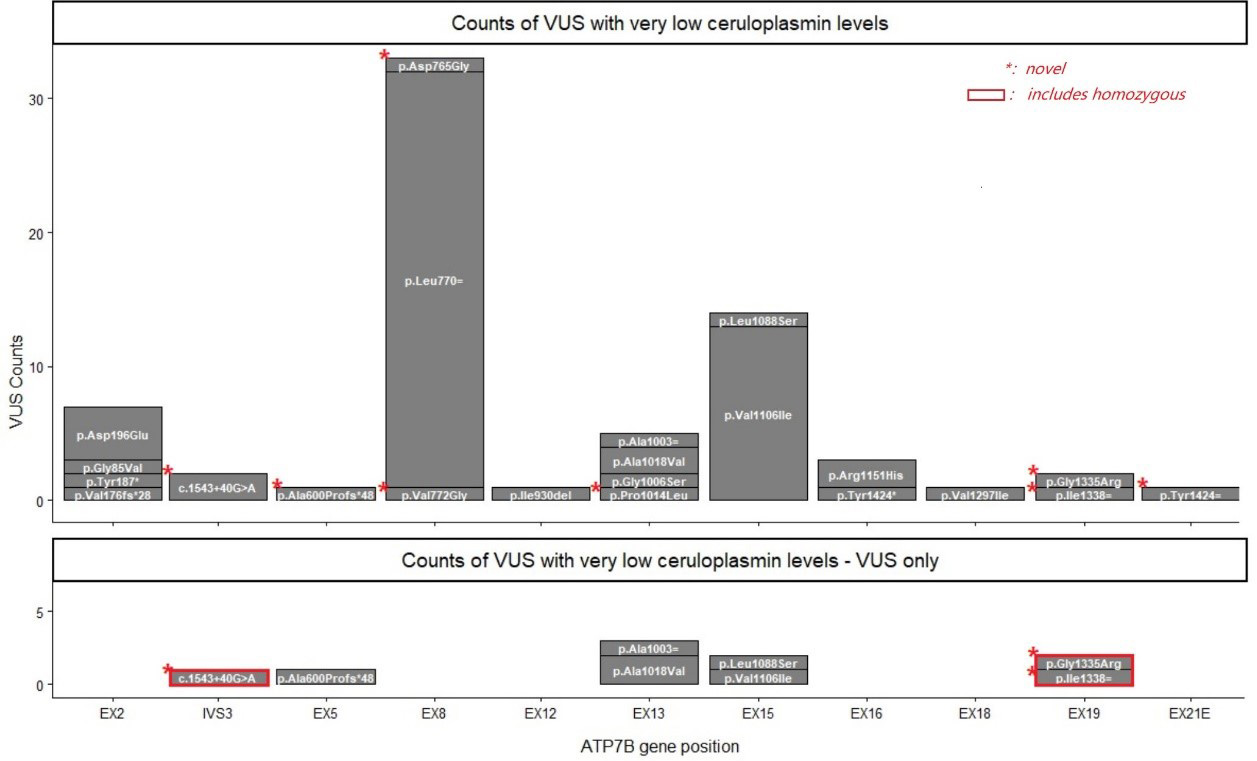
Figure 3. Occurrence of VUS associated with ceruloplasmin levels below 100 mg/L. Stacked bar plots comparing the distribution and frequency of selected ATP7B VUS. The x-axis represents gene positions, with labels such as EX (exon) and IVS (intron) indicating specific genomic regions. The y-axis shows the number of variants observed in each region in this study. Each bar consists of stacked segments, with the HGVS nomenclature for each variant labeled within its corresponding segment. Upper panel: all VUS; Lower panel: VUS occurring in isolation. Red rectangles represent variants in a homozygous state, while red asterisks in the upper left corner of a segment denote novel variants. VUS: Variants of unknown significance.


