


fig2
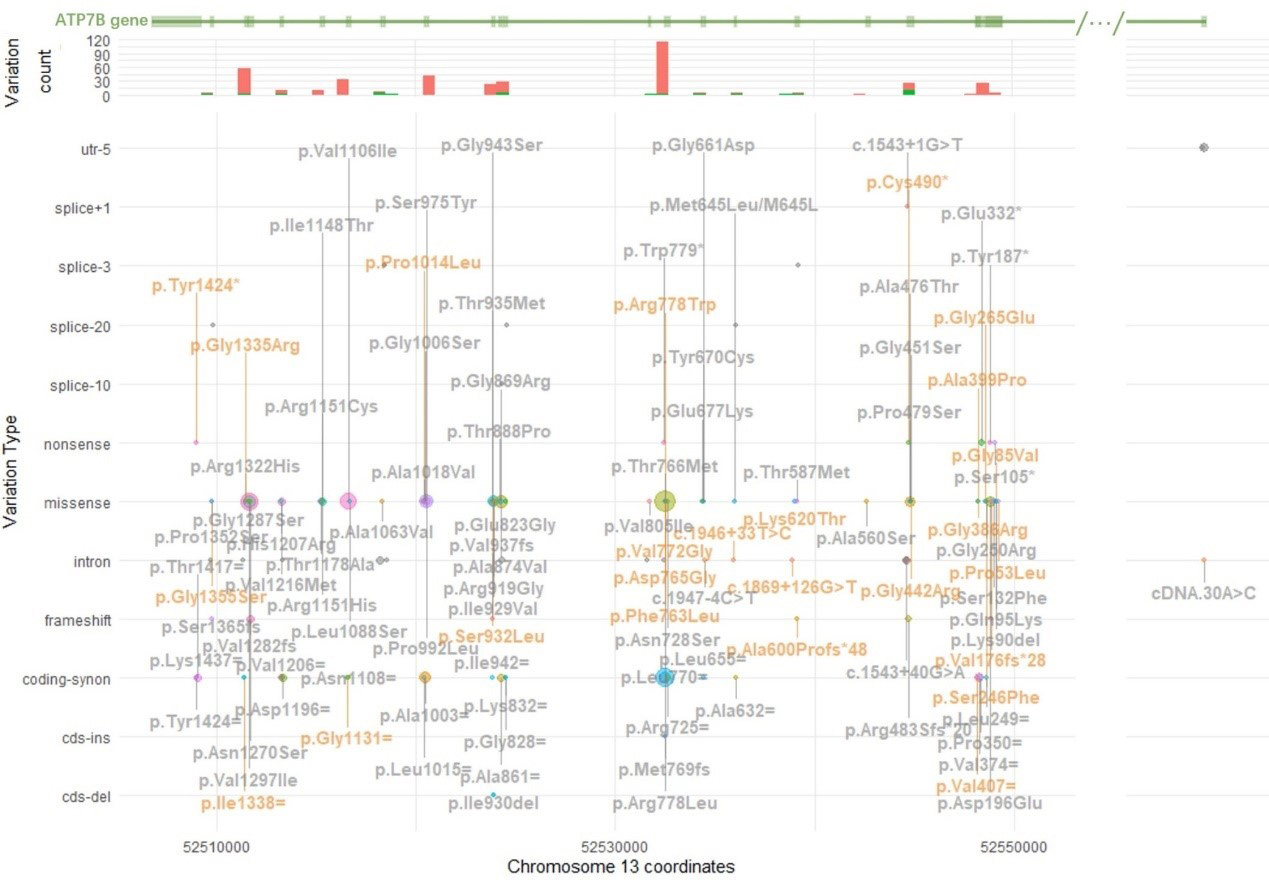
Figure 2. Variation spectrum, including counts and functional categorizations. Variation spectrum of ATP7B in this cohort. This figure illustrates the distribution and genomic locations of genetic variants in the ATP7B gene on chromosome 13. It consists of three panels. The x-axis represents chromosomal coordinates. The top panel, shown in green, depicts the structure of the ATP7B gene, with exons represented as boxes and introns, untranslated regions (UTRs), and non-coding regions as lines. Ellipses between slashes indicate omitted long intronic regions where no variants were detected. The second panel is a histogram, with the y-axis indicating the number of variants; red bars represent exonic variants, while green bars indicate intronic variants. The third and largest panel uses the y-axis to classify variation types, including 5’UTR (utr-5), splice sites (+1 to -20), nonsense, missense, intron, frameshift, synonymous coding (coding-synon), coding insertion (cds-ins), and coding deletion (cds-del). The number of each variation is represented by a circle, with size proportional to frequency - larger circles correspond to more frequent variants. HGVS annotations for each variant are shown in bold gray adjacent to the corresponding circle; when space is limited, vertical lines connect the labels to their respective circles. Novel variants are in orange. Due to space constraints, all 79 VUS, including allele counts, zygosity, and gnomAD East Asian frequencies, are listed in Supplementary Table 1. VUS: Variants of unknown significance.


