


Intermittent fasting-induced amelioration of thyroid hormone sensitivity was associated with improvements in insulin sensitivity independent of weight loss in steatotic liver disease
 0
0 Abstract
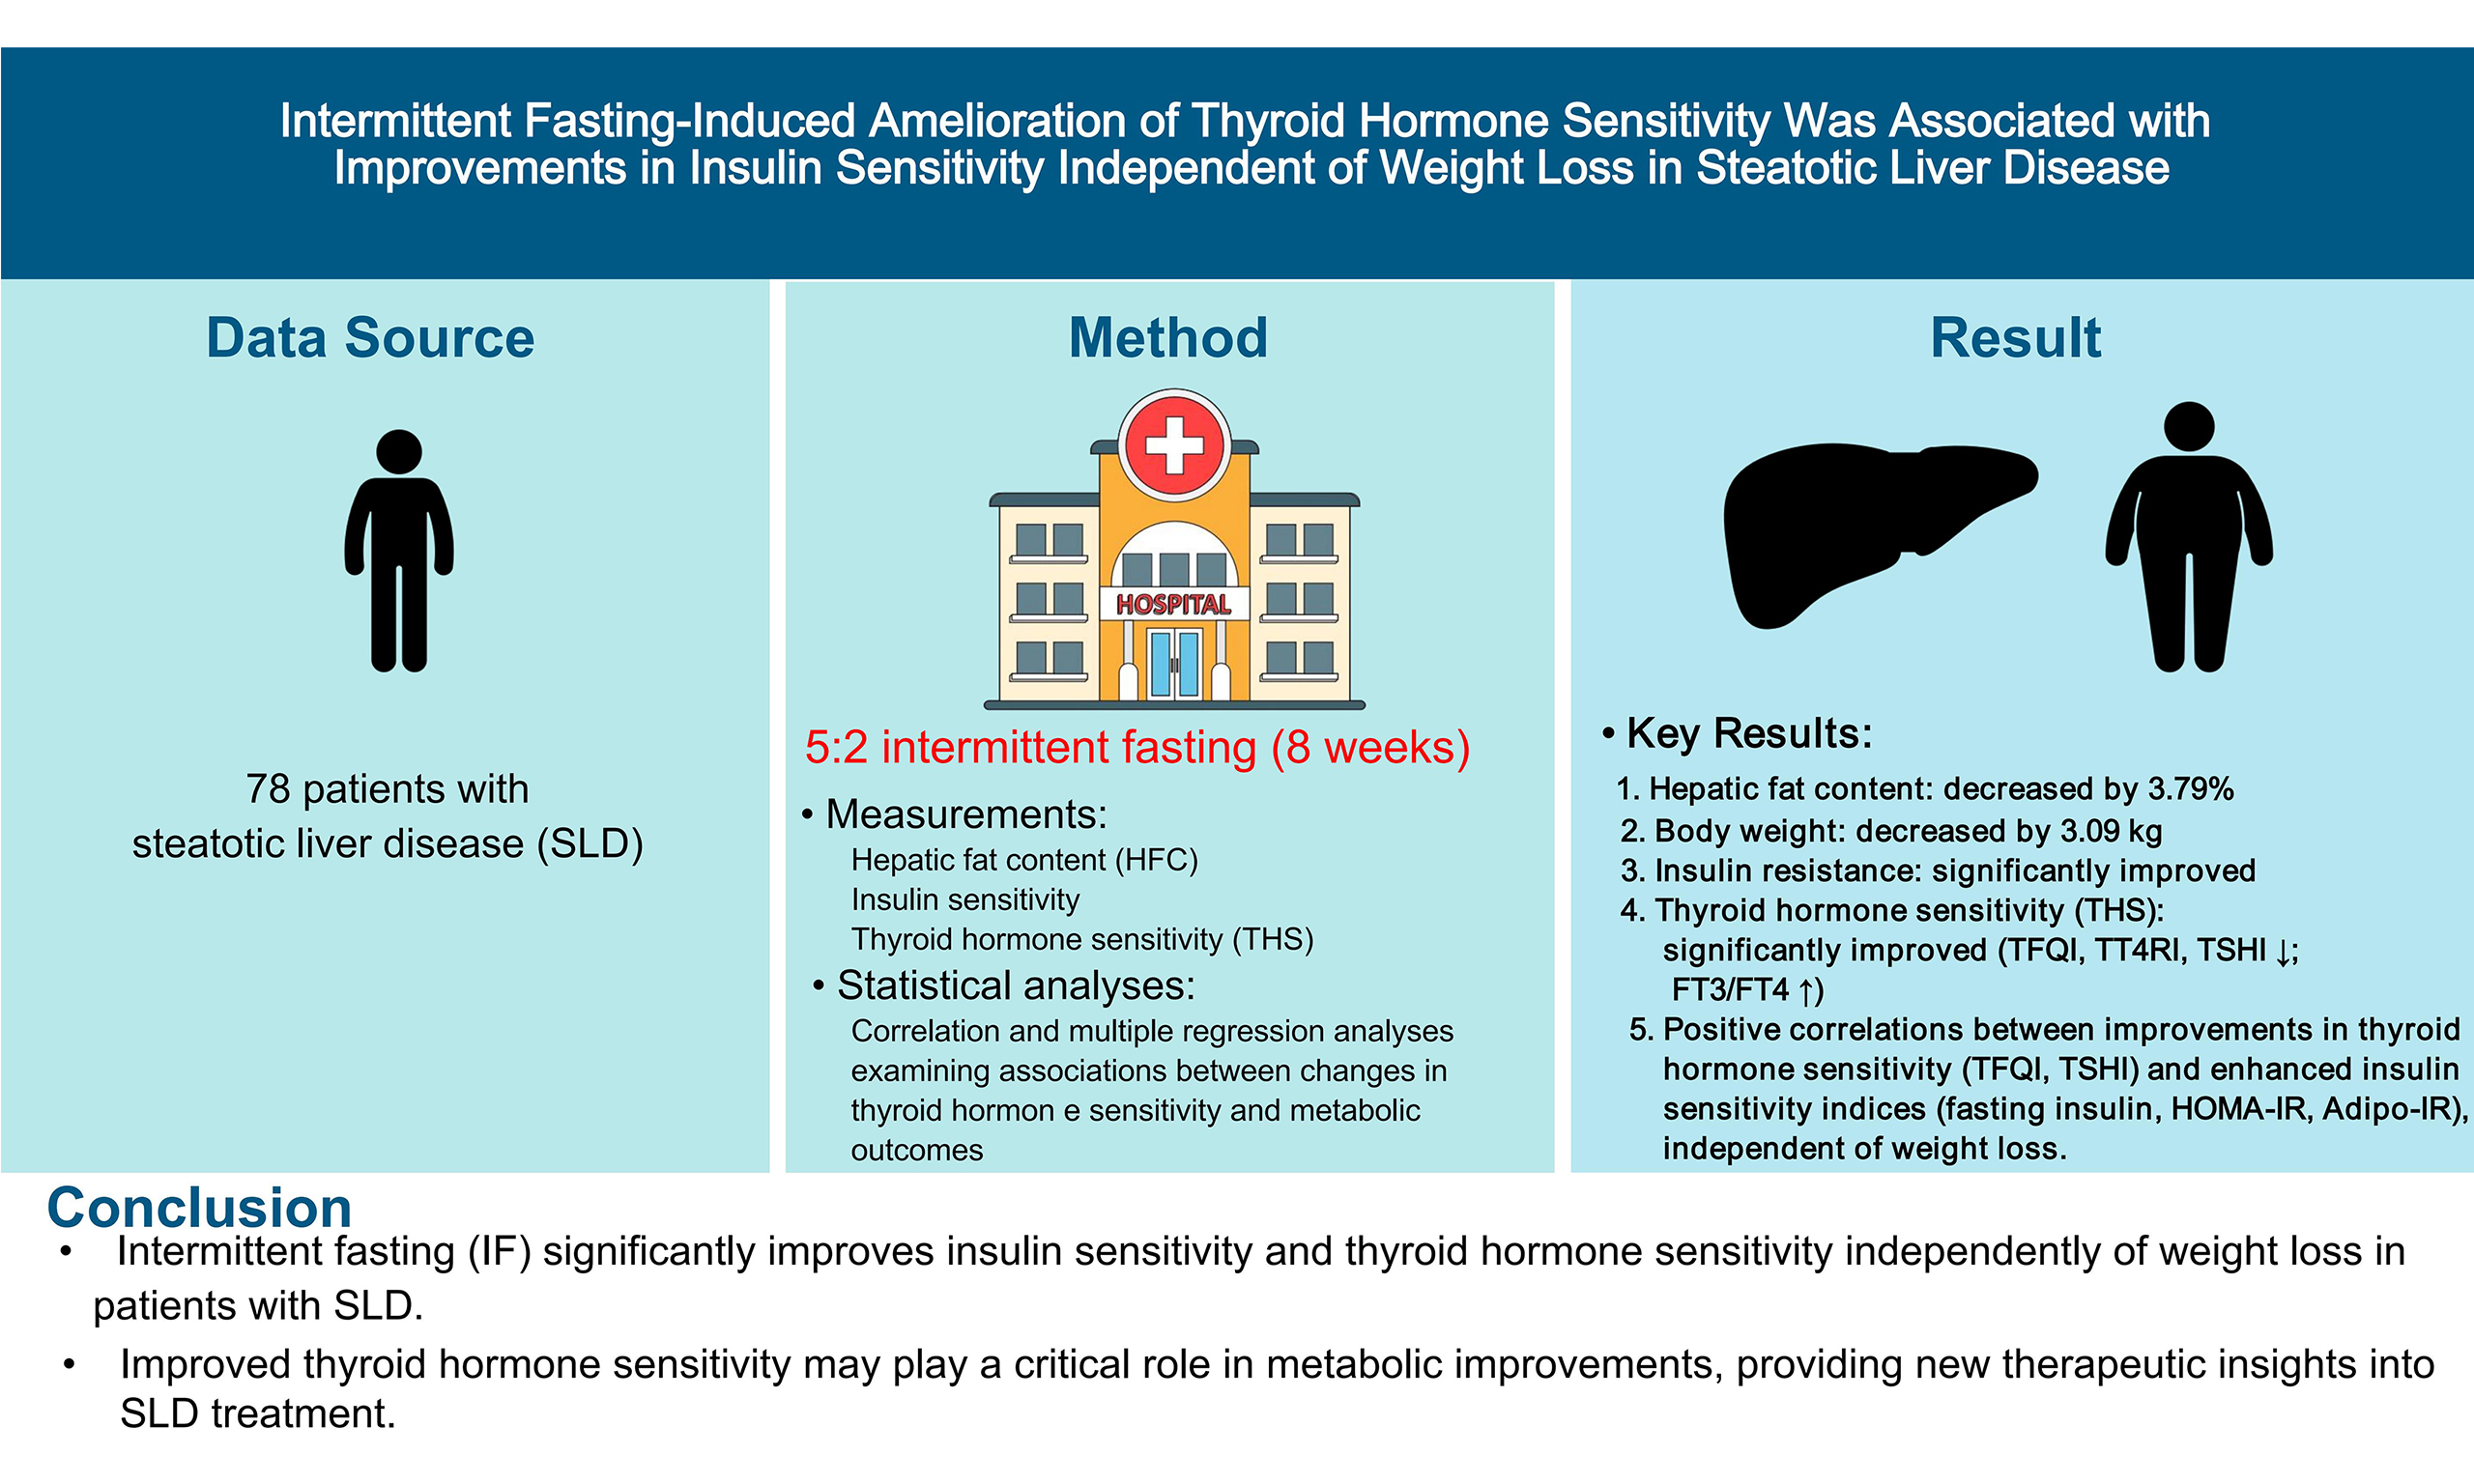
Aim: This study aimed to evaluate the effect of the intermittent fasting (IF) intervention on metabolism and thyroid hormone sensitivity (THS) in patients with steatotic liver disease (SLD) and to further investigate the association between changes in THS and alterations in metabolic parameters during the intervention.
Methods: A total of 78 patients with SLD underwent a 5:2 IF intervention for 8 weeks. Metabolic outcomes and THS, measured by the thyroid feedback quantile-based index (TFQI), thyrotroph thyroxine resistance index, thyroid-stimulating hormone index (TSHI), and free triiodothyronine to free thyroxine ratio (FT3/FT4), were assessed at baseline and after the intervention. Multiple regression analysis was performed to examine relationships between changes in THS and metabolic parameters during the intervention.
Results: Average hepatic fat content was 15.02% at baseline and decreased by 3.79% after the 8-week IF intervention, accompanied by significant reductions in body weight, blood glucose, serum lipids, fasting insulin, homeostatic model assessment of insulin resistance (HOMA-IR), and adipose tissue insulin resistance index (Adipo-IR). After the intervention, THS improved: TFQI, thyrotroph thyroxine resistance index, and TSHI all decreased, while FT3/FT4 increased. Significant positive correlations were observed between ΔTFQI and ΔTSHI and changes in fasting insulin, HOMA-IR, and Adipo-IR. In multivariate models adjusted for age, sex, and weight loss, ΔTFQI and ΔTSHI remained significantly correlated with Δinsulin, ΔHOMA-IR, and ΔAdipo-IR.
Conclusion: IF-induced improvement in THS was associated with enhanced insulin sensitivity independent of weight loss in patients with SLD. These findings suggest that THS may play a role in metabolic improvements and could inform therapeutic strategies for SLD.
Keywords
INTRODUCTION
Steatotic liver disease (SLD) has become one of the most common chronic liver diseases. Patients with SLD often present with metabolic dysfunctions, such as obesity, dyslipidemia, and insulin resistance, which place a substantial burden on healthcare systems[1]. However, very few FDA-approved drugs are available specifically for the treatment of SLD. Therefore, understanding the pathogenesis and identifying new therapeutic targets for SLD is critically important.
Current evidence suggests a potential link between SLD and thyroid function. Thyroid hormones (THs) are proposed to influence hepatic lipid homeostasis through various mechanisms[2]. Researchers have suggested hypothyroidism as an independent risk factor for SLD[3]. However, current studies present conflicting findings regarding the association between thyroid dysfunction and SLD. D’Ambrosio et al. found no statistically significant association between hypothyroidism and simple hepatic steatosis and steatohepatitis[4].
There is a belief that THs alone may not fully explain the association between SLD and thyroid function. Laclaustra et al. proposed the thyroid feedback quantile-based index (TFQI), also known as the resistance to TH index, which more accurately reflects central sensitivity to TH[5]. This index presents greater stability than the thyrotrophin thyroxine resistance index (TT4RI) and thyroid-stimulating hormone index (TSHI) in abnormal thyroid gland responsiveness to thyroid-stimulating hormone (TSH). During the last few years, emerging clinical studies investigated the relationship between TH sensitivity (THS) and metabolic health and showed that impaired THS represented by increased levels of TFQI, TT4RI, and TSHI significantly correlated with diabetes, hypertension, metabolic syndrome, obesity, hyperuricemia, and cardiovascular disease risk[5]. The previous results in our research group also uncovered that reduced THS was associated with vitamin D deficiency, high remnant cholesterol levels, and elevated homocysteine levels[6]. As for SLD, Zhang et al. showed that among patients with newly diagnosed type 2 diabetes, TFQI and TT4RI were increased in patients with SLD than those without SLD, and the risk of SLD and liver fibrosis was increased as the THS indices rose[7]. Wan et al. also found that reduced central THS was associated with metabolic dysfunction-associated SLD and fibrosis in euthyroid populations[8]. However, whether impaired THS is an independent risk factor for metabolic disorders and SLD is not fully understood. Prospective studies examining the relationships among changes in THS, glucose and lipid metabolism, and SLD are scarce and would provide valuable evidence.
Intermittent fasting (IF) is characterized by recurring periods with little or no energy intake, resulting in weight loss, energy stress, and positive metabolic adaptations. Published evidence has demonstrated that 5:2 IF is a popular intervention used to fight against metabolic diseases[9]. An umbrella review of randomized clinical trials concluded that IF engaged benefits on weight loss, improved blood lipid profiles and glucose levels, increased insulin sensitivity, and decreased blood pressure in patients with overweight, obesity, or SLD[10]. Most previous IF studies in metabolic or liver disease have been conducted in relatively small cohorts. For example, an early time-restricted feeding study done in men with prediabetes only enrolled eight patients and demonstrated improvements in insulin sensitivity[11]; an alternate-day fasting randomized clinical trial enrolled 100 adults with obesity and reported significant reductions in body weight and fat mass, as well as improvements in cardiovascular risk markers[12]; a 4-h/6-h time-restricted feeding randomized trial in 58 participants showed reductions in body weight and systolic blood pressure, with favorable changes in insulin resistance[13]. An intermittent energy restriction trial in overweight women has typically included cohorts of roughly 100 participants and demonstrated decreases in body weight and improvements in insulin sensitivity comparable to those with continuous energy restriction[14]. However, the effects of IF on THS and whether changes in THS correlated with metabolic improvements in patients with SLD remain unknown.
In this 8-week 5:2 IF intervention study, we aim to investigate the influences of IF on metabolism and THS in patients with SLD and to further identify whether the changes in THS correlated with the metabolic benefits induced by IF, which may provide novel evidence for the treatment and management of SLD and related metabolic disturbances.
METHODS
Subjects
A total of 80 subjects with SLD were recruited from the endocrinology clinic at Beijing Chao-yang Hospital, Capital Medical University, China, between September 22, 2020 and April 30, 2021. Inclusion criteria were hepatic fat content (HFC) > 5.0% as evaluated by upper abdominal magnetic resonance imaging-proton density fat fraction (MRI-PDFF) examinations[15]; age ≥ 18 years, body mass index (BMI)
This study was registered at ClinicalTrials.gov (NCT04795973) and conducted in accordance with the Declaration of Helsinki (as revised in 2013). The protocol was approved by the Ethics Committee of Beijing Chao-Yang Hospital, Capital Medical University (2021-KE-10), and informed consent was obtained from all participants.
Based on sample size calculations, we estimated that with 68 participants, the study would have more than 90% power to detect a significant difference, assuming a mean reduction in liver fat content of 2%, with a standard deviation (SD) of 5%, at an alpha level of 5%[16].
Study design
Participants underwent an 8-week 5:2 IF intervention. Metabolic parameters and THS indices were assessed at baseline and after intervention.
Intervention
All subjects received a 5:2 IF. They followed a normal diet for five days per week and practiced IF for two nonconsecutive days[17]. On normal eating days, women consumed 1,200-1,500 kcal/day and men consumed 1,500-1,800 kcal/day, with macro-nutrient distribution of 45%-50% carbohydrate, 20% protein, and 30%-35% fat. On fasting days, participants consumed 500 kcal, including at least 50 g of protein. Noncaloric beverages such as water and unsweetened tea were allowed without restriction. Participants received standardized training at baseline on portion-size estimation using visual aids (food models and household measures). They were instructed to keep daily food records on both fasting and non-fasting days. A registered dietitian reviewed the records weekly and provided individualized feedback. Any uncertainties were addressed via telephone or WeChat consultations. Adherence to the 5:2 protocol (fast-day caloric targets and non-fast-day guidance) was summarized weekly; deviations were logged and discussed at follow-up visits.
Compliance monitoring
Dietary compliance was objectively evaluated using daily food diaries, in which participants recorded all food intake on both fasting and non-fasting days. Compliance was quantified as the percentage of scheduled fasting days successfully completed over the 8-week intervention. Noncompliance was defined as energy consumption of 20% or less of the recommended diet on fasting days, failure to adhere to the IF schedules for over a week, and/or fasting days fewer than 8 (noncompliance ≥ 20%) during the intervention. Researchers closely monitored all potential adverse effects and participant responses throughout the intervention.
Study measurements
Trained investigators and doctors conducted baseline physical examinations including height, weight, and waist circumference (WC) on all participants following standard procedures. Measurements were repeated after the 8-week dietary intervention. After an overnight fasting, subjects were admitted to the endocrinology clinic at 8 a.m. Peripheral venous blood samples were collected at baseline and after the IF intervention.
The subjects visited the imaging center on a different day. HFC was assessed using MRI-PDFF following established protocols at baseline and after the dietary intervention[18].
Biochemical analysis
Blood samples were collected the day following a non-fasting day. Triglyceride (TG), total cholesterol (TC), high-density lipoprotein cholesterol (HDL), low-density lipoprotein cholesterol (LDL), free fatty acid (FFA), FBG, uric acid (UA), AST, ALT, γ-glutamyl transferase (GGT), total protein (TP), and albumin (ALB) were measured using routine automated laboratory methods (Hitachi 7060C automatic biochemistry analysis system) at Beijing Chao-yang Hospital.
Free triiodothyronine (FT3), free thyroxine (FT4), and TSH were measured using a lectrochemiluminescence immunoassay on an Abbott Architect i2000 (Abbott Diagnostics, Abbott Park, IL, USA). The reference ranges were 0.55-4.78 μIU/mL for TSH, 3.28-6.47 pmol/L for FT3, and 7.64-
TFQI, TT4RI, and TSHI were calculated to assess central THS. TFQI was assessed as cdf FT4 - (1 - cdf TSH)[5]; TSHI was determined using lnTSH (mIU/L) + 0.1345 × FT4 (pmol/L); TT4RI was computed as FT4 (pmol/L) × TSH (mIU/L). The increase in TFQI, TT4RI, and TSHI indices indicates a decrease in central sensitivity to TH. Peripheral THS was assessed by FT3/FT4. The lower values represent the poorer peripheral THS. Insulin resistance was assessed using the homeostatic model assessment of insulin resistance (HOMA-IR): HOMA-IR = fasting insulin (µU/mL) × FBG (mmol/L)/22.5. Adipose tissue insulin resistance index (Adipo-IR) was calculated as fasting insulin (µU/mL) × FFA level (mmol/L). The percentage of excessive weight loss (%EWL) was evaluated using %EWL = (baseline weight - follow-up weight)/(baseline weight - ideal weight) × 100[19]. BMI was calculated as weight (kg)/height (m2).
MRI examination and image post-processing
All subjects underwent upper abdominal examinations using a 3-Tesla whole-body MRI scanner (MAGNETOM Prisma System; Siemens Medical Solutions, Erlangen, Germany) to estimate HFC. Subjects who completed the intervention were reassessed eight weeks later. Subjects experienced a 10-12 h fasting before imaging. Breath-hold scans were done at the end-expiratory phase, covering all upper abdominal organs. The scanning protocol included localizer images followed by a T1 volumetric interpolated breath-hold examination (VIBE) Dixon sequence. The imaging parameters include TE1 1.23 ms, TE2 2.46 ms, TR 3.97 ms, 9° flip angle, 1,040 Hz/Px bandwidth, and 3.0 mm slice thickness.
Post-image processing was performed using Siemens Synovia to acquire the fat fraction images. Hepatic PDFF was estimated by calculating the signal intensity from the regions of interest (ROI) of the liver in a fat fraction image. The measurements were conducted by an experienced radiologist, and the imaging analysis was performed by a senior doctor.
Statistical analysis
Statistical analysis was conducted using IBM SPSS (version 27.0). Continuous data were controlled for normal distribution, with non-normally distributed data log-transformed prior to analysis. Normally distributed data are presented as mean ± SD and categorical variables are shown as frequency (percentage). All variables were calculated with a delta (Δ) value to show the post-intervention differences from baseline. A paired t-test was used to analyze differences between baseline and eight weeks post-intervention. The post-hoc statistical power was derived from the noncentral t distribution for a two-sided paired t-test at α = 0.05. Pearson correlation analysis was performed to evaluate associations between changes in THS indices and changes in metabolic parameters after interventions. Multiple linear regression analysis was conducted to better understand the relationships between THS and metabolic disturbances at baseline and their changes during the intervention after adjusting for age, sex, and other confounding factors. A two-tailed P-value < 0.05 was considered statistically significant.
RESULTS
Changes in metabolic parameters and THS indices after the 8-week IF intervention
Of the 80 subjects with SLD, one was excluded at week 1 for not adhering to the dietary protocol, and another withdrew at week 2 for personal reasons. A total of 78 subjects completed the 8-week 5:2 IF intervention and were included in the data analysis. As shown in Table 1, the average HFC was 15.02% at baseline and reduced by 3.79% after the 8-week intervention, accompanied by significant reductions in AST, ALT, and GGT (all P < 0.05). The dietary intervention significantly decreased body weight (3.09 ± 2.23 kg) and WC (2.55 ± 3.68 cm), with a corresponding BMI decrease of 1.09 ± 0.75 kg/m2 (all P < 0.001). Insulin sensitivity significantly improved, as represented by an 11% reduction in fasting insulin levels, 13.3% in HOMA-IR, and 17.5% in Adipo-IR from baseline. Meanwhile, all glucose metabolism variables showed significant improvements: FBG decreased from 5.38 ± 0.70 to 5.21 ± 0.70 mmol/L (P = 0.012) and HbA1c reduced from 5.78 ± 0.37 to 5.71 ± 0.43 % (P = 0.003). Significant improvements were also observed in TG (P < 0.001), TC (P = 0.027), HDL (P = 0.002), and LDL (P = 0.047). FFA showed a trend towards an improvement (0.59 ± 0.20 mmol/L vs. 0.64 ± 0.15 mmol/L, P = 0.054). UA was also significantly decreased from baseline (P < 0.001).
Baseline characteristics and changes after the 8-week 5:2 IF intervention
| Variables | Baseline | 8 weeks | Changes | % Δ from baseline | P | Post-hoc power (%) |
| n | 78 | 78 | NA | NA | NA | NA |
| Sex (male, %) | 35 (44.9%) | 35 (44.9%) | NA | NA | NA | NA |
| Age (yr) | 42.13 ± 11.81 | 42.13 ± 11.81 | NA | NA | NA | NA |
| Weight (kg) | 81.40 ± 15.31 | 78.31 ± 14.65 | -3.09 ± 2.23 | -3.8 | < 0.001 | 100.0 |
| BMI (kg/m2) | 28.95 ± 4.53 | 27.86 ± 4.38 | -1.09 ± 0.75 | -3.8 | < 0.001 | 100.0 |
| WC (cm) | 97.41 ± 10.50 | 94.86 ± 10.19 | -2.55 ± 3.68 | -2.6 | < 0.001 | 100.0 |
| HFC (%) | 15.02 ± 9.47 | 11.23 ± 8.56 | -3.79 ± 5.72 | -25.2 | < 0.001 | 100.0 |
| FBG (mmol/L) | 5.38 ± 0.70 | 5.21 ± 0.70 | -0.17 ± 0.59 | -3.2 | 0.012 | 72.1 |
| HbA1c (%) | 5.78 ± 0.37 | 5.71 ± 0.43 | -0.07 ± 0.20 | -1.2 | 0.003 | 87.1 |
| Insulin (μU/mL) | 18.54 ± 10.33 | 16.51 ± 8.07 | -2.04 ± 6.25 | -11.0 | 0.005 | 82.2 |
| HOMA-IR (mg/dL·µU/mL) | 4.44 ± 2.57 | 3.85 ± 2.00 | -0.59 ± 1.67 | -13.3 | 0.002 | 87.7 |
| TG (mmol/L) | 2.15 ± 1.25 | 1.46 ± 0.50 | -0.68 ± 1.08 | -31.6 | < 0.001 | 100 |
| TC (mmol/L) | 5.15 ± 0.94 | 4.90 ± 0.99 | -0.25 ± 0.98 | -4.9 | 0.027 | 61.5 |
| HDL (mmol/L) | 1.03 ± 0.16 | 1.10 ± 0.17 | 0.07 ± 0.19 | -6.8 | 0.002 | 90.2 |
| LDL (mmol/L) | 3.28 ± 0.79 | 3.10 ± 0.66 | -0.18 ± 0.78 | -5.5 | 0.047 | 53.1 |
| FFA (mmol/L) | 0.64 ± 0.15 | 0.59 ± 0.20 | -0.05 ± 0.22 | -7.8 | 0.054 | 51.9 |
| Adipo-IR (mmol/L·µU/mL) | 12.04 ± 8.36 | 9.93 ± 6.14 | -2.11 ± 6.43 | -17.5 | 0.005 | 82.6 |
| UA (μmol/L) | 367.91 ± 81.69 | 355.40 ± 81.08 | -12.51 ± 31.65 | -3.4 | < 0.001 | 93.7 |
| ALT (U/L) | 37.14 ± 28.35 | 31.36 ± 24.83 | -5.78 ± 23.25 | -15.6 | 0.031 | 59.3 |
| AST (U/L) | 31.11 ± 16.80 | 25.20 ± 12.61 | -5.91 ± 13.59 | -19.0 | < 0.001 | 97.0 |
| GGT(U/L) | 42.15 ± 22.18 | 34.77 ± 19.08 | -7.39 ± 15.72 | -17.5 | < 0.001 | 98.6 |
| TP (g/L) | 74.76 ± 5.17 | 75.29 ± 3.87 | 0.54 ± 4.55 | 0.7 | 0.301 | 18.1 |
| ALB (g/L) | 47.84 ± 3.04 | 47.12 ± 3.14 | -0.71 ± 4.00 | -1.5 | 0.120 | 34.7 |
| FT3 (pmol/L) | 4.96 ± 0.59 | 5.09 ± 0.53 | 0.13 ± 0.52 | 2.6 | 0.029 | 59.8 |
| FT4 (pmol/L) | 16.57 ± 2.10 | 16.21 ± 2.23 | -0.35 ± 1.58 | -2.1 | 0.051 | 49.9 |
| LnTSH | 0.80 ± 0.46 | 0.49 ± 0.34 | -0.30 ± 0.30 | -37.5 | < 0.001 | 100.0 |
| TFQI | 0.107 ± 0.355 | -0.173 ± 0.354 | -0.281 ± 0.243 | -262.6 | < 0.001 | 100.0 |
| TT4RI | 40.45 ± 19.26 | 28.11 ± 10.45 | -12.35 ± 14.00 | -30.5 | < 0.001 | 100.0 |
| TSHI | 3.03 ± 0.48 | 2.68 ± 0.45 | -0.35 ± 0.35 | -11.6 | < 0.001 | 100.0 |
| FT3/FT4 | 0.30 ± 0.05 | 0.32 ± 0.05 | 0.02 ± 0.05 | 6.7 | 0.004 | 94.2 |
During eight weeks, the IF intervention significantly reduced the TSH level (LnTSH, P < 0.001) and showed a trend toward decreased FT4 levels (16.21 ± 2.23 vs. 16.57 ± 2.10 pmol/L, P = 0.051), while significantly increasing FT3 levels (5.09 ± 0.53 vs. 4.96 ± 0.59 pmol/L, P = 0.029). Correspondingly, THS improved: TFQI, TT4RI, and TSHI all decreased and FT3/FT4 increased (-0.173 ± 0.354 vs. 0.107 ± 0.355, P < 0.001; 28.11 ± 10.45 vs. 40.45 ± 19.26, P < 0.001; 2.68 ± 0.45 vs. 3.03 ± 0.48, P < 0.001; 0.32 ± 0.05 vs. 0.30 ± 0.05, P = 0.004, respectively).
Associations between changes in THS and changes in metabolic variables during the intervention
At baseline, we evaluated whether THS was an independent risk factor for SLD and related metabolic disorders. HFC and HOMA-IR were significantly positively correlated with TFQI and TG was positively correlated with TT4RI after adjusting for age, sex, BMI, and HbA1c (all P < 0.05) [Supplementary Table 1].
Thereafter, we examined the correlations between changes in metabolic variables and alterations in THS indices [Table 2]. ΔBMI, ΔWC, and EWL were significantly correlated with alterations in THS indices
Univariate correlation analysis between changes in THS indices and changes in metabolic parameters after the 8-week 5:2 IF intervention
| Variables | ΔTFQI | ΔTT4RI | ΔTSHI | ΔFT3/FT4 | ||||
| r | P | r | P | r | P | r | P | |
| ΔBMI (kg/m2) | 0.326 | 0.004 | 0.148 | 0.197 | 0.253 | 0.026 | -0.253 | 0.025 |
| ΔWC (cm) | 0.278 | 0.014 | 0.136 | 0.234 | 0.244 | 0.031 | -0.170 | 0.136 |
| ΔHFC (%) | 0.157 | 0.169 | 0.081 | 0.480 | 0.129 | 0.260 | -0.165 | 0.148 |
| EWL (%) | 0.221 | 0.052 | 0.146 | 0.203 | 0.232 | 0.041 | -0.179 | 0.116 |
| ΔFBG (mmol/L) | 0.067 | 0.560 | 0.072 | 0.530 | 0.045 | 0.693 | 0.053 | 0.647 |
| ΔHbA1c (%) | 0.212 | 0.063 | 0.173 | 0.131 | 0.187 | 0.101 | -0.182 | 0.110 |
| ΔInsulin (μU/mL) | 0.272 | 0.016 | 0.133 | 0.244 | 0.242 | 0.033 | -0.167 | 0.143 |
| ΔHOMA-IR (mg/dL·µU/mL) | 0.272 | 0.016 | 0.147 | 0.200 | 0.232 | 0.041 | -0.145 | 0.206 |
| ΔTG (mmol/L) | -0.036 | 0.756 | 0.221 | 0.052 | 0.072 | 0.522 | -0.065 | 0.569 |
| ΔTC (mmol/L) | 0.018 | 0.878 | -0.027 | 0.812 | -0.073 | 0.525 | 0.115 | 0.315 |
| ΔHDL (mmol/L) | -0.097 | 0.397 | -0.026 | 0.824 | -0.042 | 0.712 | 0.038 | 0.743 |
| ΔLDL (mmol/L) | 0.245 | 0.031 | 0.161 | 0.159 | 0.236 | 0.038 | -0.178 | 0.118 |
| ΔFFA (mmol/L) | 0.101 | 0.377 | 0.122 | 0.287 | 0.053 | 0.647 | 0.109 | 0.341 |
| ΔAdipo-IR (mmol/L·µU/mL) | 0.314 | 0.005 | 0.205 | 0.017 | 0.249 | 0.028 | -0.087 | 0.449 |
| ΔUA (μmol/L) | 0.201 | 0.078 | 0.095 | 0.408 | 0.137 | 0.231 | -0.027 | 0.812 |
| ΔALT (U/L) | 0.091 | 0.428 | 0.013 | 0.910 | 0.099 | 0.388 | -0.030 | 0.793 |
| ΔAST (U/L) | 0.074 | 0.522 | 0.161 | 0.160 | 0.101 | 0.378 | -0.002 | 0.984 |
| ΔGGT (U/L) | 0.074 | 0.520 | 0.097 | 0.397 | 0.047 | 0.680 | -0.083 | 0.471 |
Significant positive correlations were observed between ΔTFQI and ΔTSHI and changes in insulin sensitivity indices, including fasting insulin, HOMA-IR, and Adipo-IR, after adjusting for sex, age, and EWL during the intervention (all P < 0.05) [Figure 1A-L]. In a multivariate model adjusted for age, sex, and EWL, ΔTFQI and ΔTSHI were still significantly associated with Δinsulin (β = 0.265, P = 0.017; β = 0.245, P = 0.028, respectively), ΔHOMA-IR (β = 0.262, P = 0.019; β = 0.232, P = 0.040, respectively), and ΔAdipo-IR (β = 0.312, P = 0.004; β = 0.257, P = 0.019, respectively). ΔTFQI explained 18%, 17%, and 23% of the variance in insulin, HOMA-IR, and Adipo-IR, respectively, across the models. ΔTSHI explained 17%, 16%, and 20% of the variance in insulin, HOMA-IR, and Adipo-IR, respectively [Table 3]. ΔFT3/FT4 was negatively correlated with Δinsulin after adjusting for age, sex, and EWL, explaining 17% of the variance in insulin in the full model.
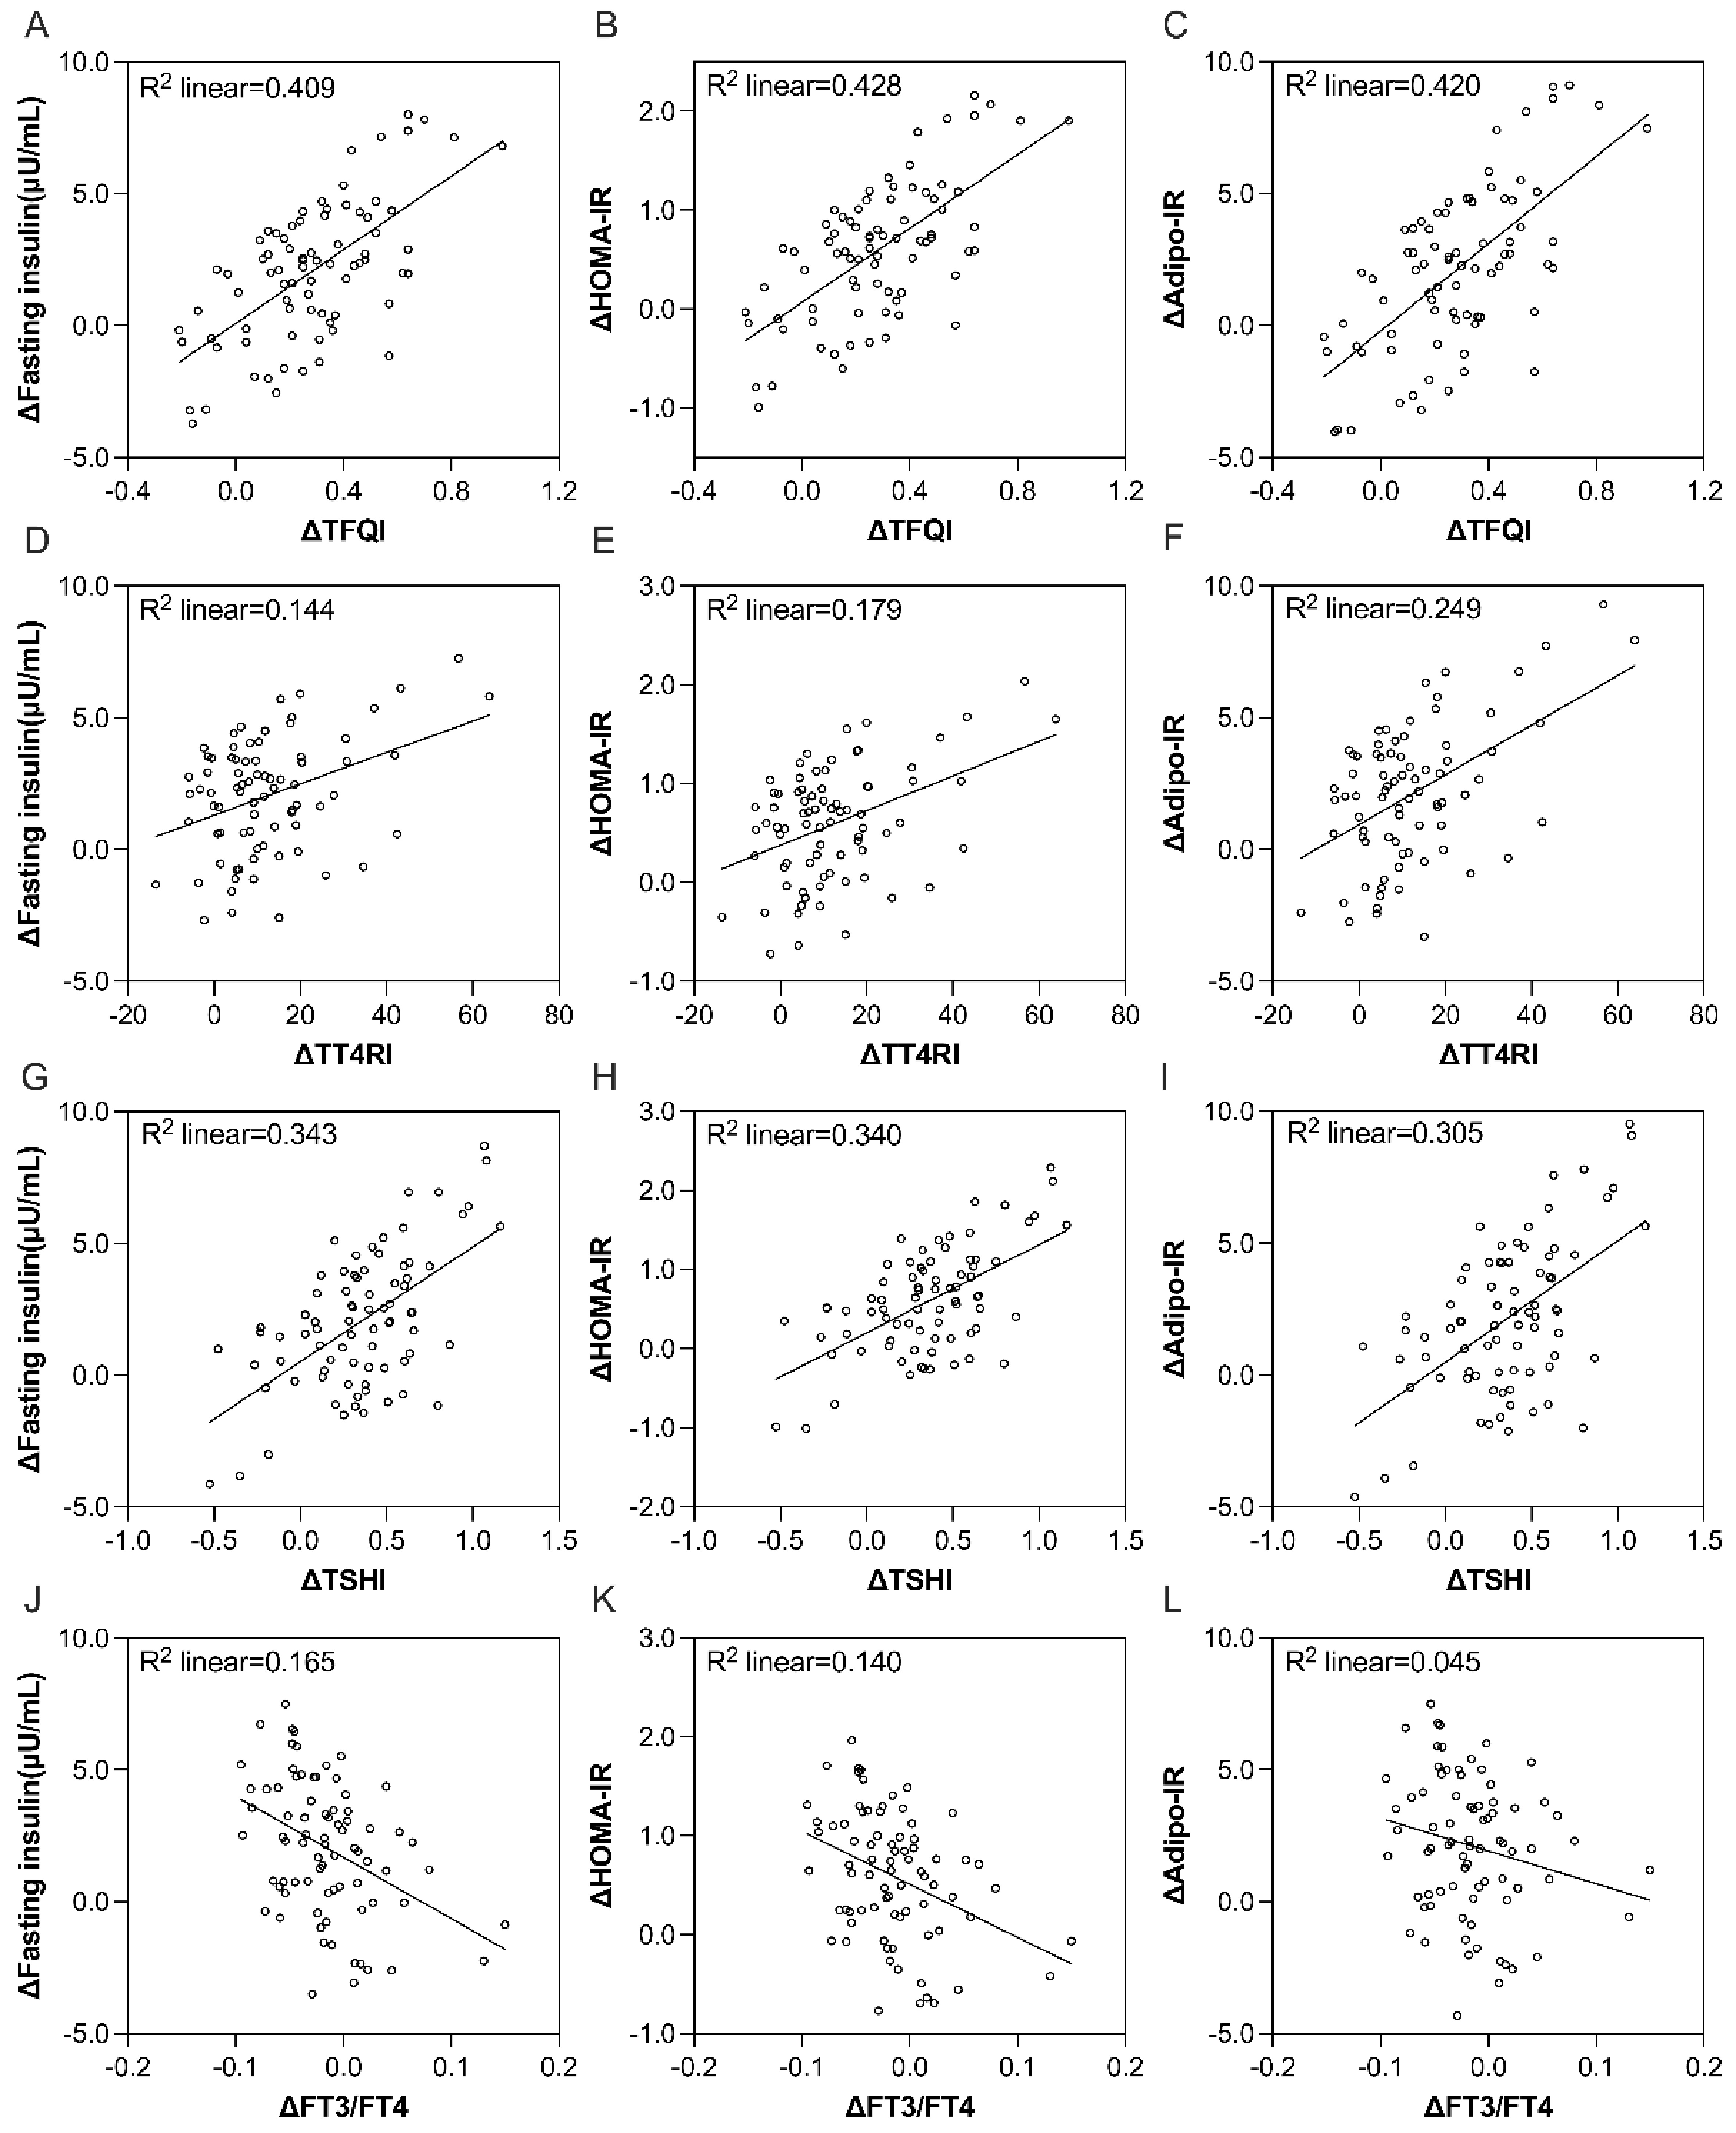
Figure 1. Correlations between in-patient changes in insulin sensitivity indices and THS indices during an 8-week 5:2 IF intervention after adjusting for age, sex, and EWL. (A) ΔTFQI and Δfasting insulin; (B) ΔTFQI and ΔHOMA-IR; (C) ΔTFQI and ΔAdipo-IR; (D) ΔTT4RI and Δfasting insulin; (E) ΔTT4RI and ΔHOMA-IR; (F) ΔTT4RI and ΔAdipo-IR; (G) ΔTSHI and Δfasting insulin; (H) ΔTSHI and ΔHOMA-IR; (I) ΔTSHI and ΔAdipo-IR; (J) ΔFT3/FT4 and Δfasting insulin; (K) ΔFT3/FT4 and ΔHOMA-IR; (L)ΔFT3/FT4 and ΔAdipo-IR. Δ shows the post-intervention differences from baseline. THS: Thyroid hormone sensitivity; IF: intermittent fasting; EWL: excessive weight loss; TFQI: thyroid feedback quantile-based index; HOMA-IR: homeostatic model assessment of insulin resistance; Adipo-IR: adipose tissue insulin resistance index; TT4RI: thyrotroph thyroxine resistance index; TSHI: thyroid-stimulating hormone index; FT3: free triiodothyronine; FT4: free thyroxine.
Multiple regression analysis with changes in fasting insulin, HOMA-IR, or Adipo-IR as the dependent variable and changes in THS indices as independent variables after controlling for age, sex, and EWL in patients with fatty liver disease undergoing an 8-week IF intervention
| Variables | ΔInsulin | ΔHOMA-IR | ΔAdipo-IR | |||
| β | P | β | P | β | P | |
| ΔTFQI | 0.265 | 0.017 | 0.262 | 0.019 | 0.312 | 0.004 |
| EWL | 0.143 | 0.205 | 0.149 | 0.189 | 0.134 | 0.219 |
| R2 = 0.181 | R2 = 0.173 | R2 = 0.234 | ||||
| ΔTT4RI | 0.099 | 0.378 | 0.114 | 0.311 | 0.170 | 0.123 |
| EWL | 0.184 | 0.111 | 0.187 | 0.106 | 0.174 | 0.121 |
| R2 = 0.124 | R2 = 0.120 | R2 = 0.169 | ||||
| ΔTSHI | 0.245 | 0.028 | 0.232 | 0.040 | 0.257 | 0.019 |
| EWL | 0.146 | 0.195 | 0.155 | 0.175 | 0.145 | 0.190 |
| R2 = 0.171 | R2 = 0.158 | R2 = 0.204 | ||||
| ΔFT3/FT4 | -0.246 | 0.031 | -0.215 | 0.062 | -0.172 | 0.131 |
| EWL | 0.170 | 0.128 | 0.179 | 0.113 | 0.181 | 0.107 |
| R2 = 0.169 | R2 = 0.150 | R2 = 0.168 | ||||
DISCUSSION
In this prospective 5:2 IF intervention study, we demonstrated that an 8-week IF regimen significantly decreased HFC and improved glucose and lipid metabolism and THS in patients with SLD, with amelioration of THS being associated with improvements in insulin sensitivity independent of weight loss. Our findings provide additional support for refining therapeutic strategies for SLD, suggesting that appropriate dietary interventions could help improve TH resistance in individuals with SLD, thereby contributing to improved insulin resistance. Notably, the present trial enrolled 78 patients, a relatively large sample compared with most previous IF studies in metabolic or liver disease populations[11-14], which strengthens the reliability of our findings and highlights the novelty of investigating THS in this clinical context.
THs participate in regulating glucose and lipid metabolism, including modulating hepatic insulin sensitivity, inhibiting hepatic gluconeogenesis, and promoting lipolysis, lipid exportation, and lipogenesis. It is plausible and well-known that thyroid dysfunctions are closely correlated with metabolic disturbances and SLD. The proposal of THS indices and acquired resistance to TH by Laclaustra et al. partially explains the previous controversy about abnormal thyroid function and SLD and related metabolic disorders[5]. With Dr. Laclaustra first proposing the association between THS and diabetes and metabolic syndrome, a growing body of studies in the past five years have revealed that impaired THS correlated with visceral adiposity, insulin resistance, dyslipidemia, and SLD in euthyroid populations or patients with subclinical hypothyroidism[20]. Lai et al. explored the relationship between THS and non-alcoholic SLD in 4,610 Chinese subjects for the first time and discovered that THS indices positively correlated with dyslipidemia and SLD even after controlling for confounding factors[21]. Another cross-sectional study performed on euthyroid participants also reported a positive association between THS indices and the prevalence of metabolic dysfunction-associated SLD and indicated that the TG glucose index, a surrogate index of insulin sensitivity, partly mediated this relevance[22]. Zhang et al. revealed the same correlation between THS and metabolic dysfunction-associated SLD in patients with newly diagnosed type 2 diabetes; however, the relationship was not significant when they adjusted for BMI and HOMA-IR in euthyroid populations[7], which indicated that other metabolic factors might mediate the association between THS and SLD. However, evidence on the relationship between THS and metabolism in patients with SLD is limited. Only one cross-sectional study conducted in 129 Chinese subjects with biopsy-proven euthyroid SLD by Li et al. showed that resistance to TH assessed by FT3/FT4, TFQI, TT4RI, and TSHI correlated with advanced liver fibrosis[23]. To the best of our knowledge, this is the first study to demonstrate that reduced THS is associated with increased HFC, elevated TG levels, and decreased insulin sensitivity, even after adjusting for factors such as age, sex, BMI, and HbA1c in participants with SLD. Therefore, we propose that THS is an independent risk factor for HFC and insulin sensitivity in SLD patients.
Approved pharmacological agents for SLD are largely limited. Noninvasive weight-loss approaches, such as fasting-based dietary interventions, have gained considerable attention in the fields of obesity and metabolic diseases and have been effective in improving glucose and lipid metabolism, with the 5:2 IF regimen being among the most popular[10]. Only a few studies have investigated the benefits of 5:2 IF on SLD and related pathologies. Holmer et al. showed that 12-week 5:2 IF significantly reduced body weight, hepatic steatosis measured by magnetic resonance spectroscopy, liver stiffness, HOMA-IR, HbA1c, and serum TC and LDL in 74 participants with SLD for the first time[24]. Kord Varkaneh et al. performed a randomized controlled study to compare the effects of 12-week 5:2 IF (n = 21) and control diet (n = 23) on SLD. They also observed significant reductions in liver steatosis score and fibrosis score and dramatic decreases in serum TG, AST, ALT, insulin levels, and inflammatory biomarkers such as high-sensitivity C-reactive protein and cytokeratin-18 after 12-week IF intervention[25]. Gallage et al. recently validated the effects of 5:2 IF on SLD and steatohepatitis in a preclinical model induced by a Western diet and showed that fasted mice gained less body weight and presented improvements in fasting glucose levels and hepatic steatosis and inflammation, which is independent of the total calorie intake[26]. In line with the above studies, our study also found that 8-week 5:2 IF significantly reduced HFC assessed by MRI-PDFF, body weight, WC, serum lipid profiles, FBG, insulin, HOMA-IR, and Adipo-IR in patients with SLD. Meanwhile, we observed that serum FT3 and the FT3/FT4 ratio increased, whereas FT4, TSH, TFQI, TT4RI, and TSHI decreased following the 5:2 IF intervention.
Lines of evidence have demonstrated that fasting influences the hypothalamus-pituitary-thyroid (HPT) axis. Fasting-induced downregulation of hypothalamus thyrotropin-releasing hormone (TRH) and pituitary TSH has been shown in animal models, in which fasting-altered leptin and neuromedin B might play some roles. Meanwhile, animal studies also showed that serum T3 and T4 levels were decreased following 24-hour fasting[27]. However, few studies explored the effects of long-term IF on thyroid function, especially in humans. Moro et al. analyzed the changes in thyroid function after 8-week time-restricted fasting (8 h) in 34 resistance-trained men and showed that T3 significantly decreased but TSH did not change after IF intervention[28]. In animal experiments, a recent study suggested that 3-week IF decreased body weight, promoted white fat browning, and increased serum T3 levels along with elevated TRH expression in the hypothalamus in stressed rats[29]. Differences in IF intervention regimens, intervention duration, and study populations or animal models might contribute to the inconsistencies among the published studies. Moreover, we speculate that heterogeneity in THS may also partially decipher the different results among the studies. In our study, 8-week 5:2 IF elevated serum FT3 levels but reduced TSH and FT4 levels in SLD patients. Central THS measured by TFQI, TT4RI, and TSHI and peripheral THS assessed by FT3/FT4 were both improved by IF. More large-scale clinical studies and animal experiments were required to validate the results and our hypothesis and to reveal the involved biological mechanisms.
Interestingly, multiple regression analysis showed that ΔTFQI and ΔTSHI were significantly associated with Δinsulin, ΔHOMA-IR, and ΔAdipo-IR, and that ΔFT3/FT4 was correlated with Δinsulin in patients with SLD during the 8-week IF intervention, after adjusting for age, sex, and weight loss. Resistance to TH syndrome (RTH) is a rare disease caused by inherited mutations in TH receptor beta (THRβ) and characterized by both elevated FT4 and TSH levels. Patients exhibited higher levels of intrahepatic fat, HOMA-IR, and FFA. However, another study suggested no changes in skeletal insulin sensitivity evaluated by the hyperinsulinemic-euglycemic clamp in 16 patients with RTH compared with 28 age-, sex-, and BMI-matched controls[30]. These different manifestations might be induced by variable resistance to the action of THs in different peripheral tissues. Central THS pertains to the HPT axis’s responsiveness to variations in circulating FT4[5]. Participants with reduced central THS also displayed peripheral TH resistance[5]. A recent study from our research team showed that impaired THS correlated with increased HOMA-IR and Adipo-IR in obese populations, whereas the association between HOMA-IR and THS indices lost significance after adjusting for confounding factors[31]. THs regulate hepatic glucose output via modulating the expression of glucose-6-phosphatase involved in gluconeogenesis and glycogenolysis and glucose transporter 2 (GLUT2) and through a central sympathetic pathway from the hypothalamic paraventricular nucleus to the liver[32]. Additionally, resistance to TH was shown to correlate with visceral adiposity and insulin resistance resulting from the inhibition of catecholamine-stimulated lipolysis. Some adipokines such as leptin and inflammatory cytokines including interleukin 6 and tumor necrosis factor-alpha have been suggested to be mediators of the correlation between THS and adipose insulin resistance[31]. Liver-directed THRβ selective agonists resmetirom have gained growing popularity in the treatment of SLD. A randomized, double-blind, placebo-controlled study showed that resmetirom reduced hepatic fat by 37.3% and liver enzymes after a 36-week intervention in patients with non-alcoholic steatohepatitis[33]. The current study suggested that improvements in THS indices induced by noninvasive 5:2 IF positively correlated with increased insulin sensitivity in patients with SLD for the first time, which is also weight loss independent. Potential mechanisms linking IF to improved THS may involve alterations in peripheral deiodinase activity[34], changes in leptin signaling during energy restriction[35], and TH regulation of systemic energy homeostasis[36]. While speculative, these mechanisms highlight possible biological links between dietary restriction and thyroid-metabolic interactions and warrant further mechanistic investigation in future studies.
From a clinical perspective, these findings suggest that IF may be considered a non-pharmacological option for the management of SLD. Improvements in HFC, insulin sensitivity, and THS highlight its potential to complement existing lifestyle-based strategies[37]. For patients with concurrent thyroid dysfunction, careful monitoring of thyroid parameters during IF may be particularly important. Compared with other dietary interventions, such as continuous caloric restriction or the Mediterranean diet, the magnitude of metabolic improvements observed in this study is comparable or even greater for certain outcomes, underscoring the potential utility of IF in clinical practice[38].
Limitations
This study has several limitations that should be considered when interpreting the findings. First, this was a single-center, prospective intervention without a parallel control group or randomization. Accordingly, causal inference is limited, and regression to the mean or secular trends cannot be completely excluded[39]. Future randomized controlled trials with appropriate comparators are warranted to validate these findings in patients with SLD. Second, the 8-week duration of intervention may be insufficient to assess the sustainability of metabolic and THS improvements. Longer follow-up is required to determine the durability of improvements in HFC, THS, and insulin sensitivity, as well as to evaluate potential rebound after the intervention[40]. Third, although MRI-PDFF is a validated, noninvasive biomarker of hepatic steatosis, it does not capture histologic features such as inflammation or fibrosis; thus, we could not assess whether changes in THS were linked to histologic improvement[41]. Fourth, compliance with fasting days and prescribed macronutrient targets was monitored by dietitian coaching and self-report, which may introduce information bias[42]. Fifth, we did not collect thyroid autoantibodies, detailed hypothalamic–pituitary–thyroid axis function (e.g., TRH, leptin, neuromedin B), or thyroid imaging assessments (e.g., ultrasonography), which precludes mechanistic dissection of central vs. peripheral pathways and prevents a more comprehensive evaluation of thyroid status in patients with SLD[43]. This represents a notable limitation, and future studies incorporating comprehensive thyroid axis evaluations and thyroid imaging assessments are needed. Sixth, residual confounding cannot be ruled out despite multivariable adjustment for age, sex, and weight loss; unmeasured factors such as sleep, physical activity, medication changes, or baseline dietary patterns might have contributed to the metabolic responses[44]. In addition, IF may also influence the gut–liver axis through modulation of gut microbiota and microbial metabolites[45]. However, our study did not assess these pathways, and therefore we cannot determine whether such effects are independent of THS and insulin resistance. We acknowledge this as an additional potential mechanism, and emphasize that future multi-omics investigations are needed to disentangle the relative contributions of gut microbial pathways vs. THS/IR-mediated pathways. Finally, participants were Chinese outpatients with SLD managed at a tertiary hospital, which may limit generalizability to other populations, ethnicities, or care settings. Future randomized, controlled studies with longer duration, mechanistic profiling, and hard liver outcomes are warranted to validate and extend these results.
Conclusions
This prospective study demonstrated that improvement in THS following an 8-week 5:2 IF intervention was associated with enhanced insulin sensitivity independent of weight loss in patients with SLD. These findings provide new evidence for the metabolic benefits of IF in SLD and may help refine therapeutic strategies for this condition.
DECLARATIONS
Acknowledgments
We appreciate all participants’ dedication to this work.
Authors’ contributions
Methodology, data curation, and writing - original draft: Zhou L
Visualization, validation, and writing - original draft: Yu Y
Methodology: Jiang L
Resources, conceptualization, methodology, and supervision: Liu J
Funding acquisition, investigation, project administration, and writing - review and editing: Wang G
Availability of data and materials
All the data generated and analyzed during this study are included in our manuscript. The data that support the findings of this study are available from the corresponding author upon reasonable request.
Financial support and sponsorship
None.
Conflicts of interest
Liyuan Zhou serves as a Guest Editor for the Special Issue “Chrono-Nutrition and Metabolic Health and Dysfunction: From Mechanisms to Translational Science” in the journal Metabolism and Target Organ Damage. Liyuan Zhou was not involved in any part of the editorial processing of this manuscript, including reviewer selection and decision-making. The other authors declared that there are no conflicts of interest.
Ethical approval and consent to participate
This study was conducted in accordance with the Declaration of Helsinki and was approved by the Ethics Committee of Beijing Chao-yang Hospital affiliated with Capital Medical University (Approval No. 2021-KE-10). Written informed consent was obtained from all individual participants prior to enrollment.
Consent for publication
Not applicable.
Copyright
© The Author(s) 2025.
Supplementary Materials
REFERENCES
1. Eslam M, Newsome PN, Sarin SK, et al. A new definition for metabolic dysfunction-associated fatty liver disease: an international expert consensus statement. J Hepatol. 2020;73:202-9.
2. Chen YL, Tian S, Wu J, et al. Impact of thyroid function on the prevalence and mortality of metabolic dysfunction-associated fatty liver disease. J Clin Endocrinol Metab. 2023;108:e434-43.
3. Almomani A, Hitawala AA, Kumar P, et al. Prevalence of hypothyroidism and effect of thyroid hormone replacement therapy in patients with non-alcoholic fatty liver disease: a population-based study. World J Hepatol. 2022;14:551-8.
4. D’Ambrosio R, Campi I, Maggioni M, et al. The relationship between liver histology and thyroid function tests in patients with non-alcoholic fatty liver disease (NAFLD). PLoS One. 2021;16:e0249614.
5. Laclaustra M, Moreno-Franco B, Lou-Bonafonte JM, et al. Impaired sensitivity to thyroid hormones is associated with diabetes and metabolic syndrome. Diabetes Care. 2019;42:303-10.
6. Zhou L, Wang Y, Su J, An Y, Liu J, Wang G. Vitamin D deficiency is associated with impaired sensitivity to thyroid hormones in euthyroid adults. Nutrients. 2023;15:3697.
7. Zhang X, Chen Y, Ye H, et al. Correlation between thyroid function, sensitivity to thyroid hormones and metabolic dysfunction-associated fatty liver disease in euthyroid subjects with newly diagnosed type 2 diabetes. Endocrine. 2023;80:366-79.
8. Wan H, Yu G, Xu S, et al. Central sensitivity to free triiodothyronine with MAFLD and its progression to liver fibrosis in euthyroid adults. J Clin Endocrinol Metab. 2023;108:e687-97.
9. de Cabo R, Mattson MP. Effects of intermittent fasting on health, aging, and disease. N Engl J Med. 2019;381:2541-51.
10. Patikorn C, Roubal K, Veettil SK, et al. Intermittent fasting and obesity-related health outcomes: an umbrella review of meta-analyses of randomized clinical trials. JAMA Netw Open. 2021;4:e2139558.
11. Sutton EF, Beyl R, Early KS, Cefalu WT, Ravussin E, Peterson CM. Early time-restricted feeding improves insulin sensitivity, blood pressure, and oxidative stress even without weight loss in men with prediabetes. Cell Metab. 2018;27:1212-21.e3.
12. Trepanowski JF, Kroeger CM, Barnosky A, et al. Effect of alternate-day fasting on weight loss, weight maintenance, and cardioprotection among metabolically healthy obese adults: a randomized clinical trial. JAMA Intern Med. 2017;177:930-8.
13. Cienfuegos S, Gabel K, Kalam F, et al. Effects of 4- and 6-h time-restricted feeding on weight and cardiometabolic health: a randomized controlled trial in adults with obesity. Cell Metab. 2020;32:366-78.e3.
14. Harvie M, Wright C, Pegington M, et al. The effect of intermittent energy and carbohydrate restriction v. daily energy restriction on weight loss and metabolic disease risk markers in overweight women. Br J Nutr. 2013;110:1534-47.
15. Brunt EM. Nonalcoholic steatohepatitis: definition and pathology. Semin Liver Dis. 2001;21:3-16.
16. Jospe MR, Roy M, Brown RC, et al. Intermittent fasting, Paleolithic, or Mediterranean diets in the real world: exploratory secondary analyses of a weight-loss trial that included choice of diet and exercise. Am J Clin Nutr. 2020;111:503-14.
17. Dorling JL, Martin CK, Redman LM. Calorie restriction for enhanced longevity: the role of novel dietary strategies in the present obesogenic environment. Ageing Res Rev. 2020;64:101038.
18. Li X, Wu X, Jia Y, et al. Liraglutide decreases liver fat content and serum fibroblast growth factor 21 levels in newly diagnosed overweight patients with type 2 diabetes and nonalcoholic fatty liver disease. J Diabetes Res. 2021;2021:3715026.
19. Abu Dayyeh BK, Bazerbachi F, Vargas EJ, et al; MERIT Study Group. Endoscopic sleeve gastroplasty for treatment of class 1 and 2 obesity (MERIT): a prospective, multicentre, randomised trial. Lancet. 2022;400:441-51.
20. Lv F, Cai X, Li Y, et al. Sensitivity to thyroid hormone and risk of components of metabolic syndrome in a Chinese euthyroid population. J Diabetes. 2023;15:900-10.
21. Lai S, Li J, Wang Z, Wang W, Guan H. Sensitivity to thyroid hormone indices are closely associated with NAFLD. Front Endocrinol. 2021;12:766419.
22. Liu H, Xing Y, Nie Q, Li Z, Meng C, Ma H. Association between sensitivity to thyroid hormones and metabolic dysfunction-associated fatty liver disease in euthyroid subjects: a cross-sectional study. Diabetes Metab Syndr Obes. 2023;16:2153-63.
23. Li R, Zhou L, Chen C, et al. Sensitivity to thyroid hormones is associated with advanced fibrosis in euthyroid patients with non-alcoholic fatty liver disease: a cross-sectional study. Dig Liver Dis. 2023;55:254-61.
24. Holmer M, Lindqvist C, Petersson S, et al. Treatment of NAFLD with intermittent calorie restriction or low-carb high-fat diet - a randomised controlled trial. JHEP Rep. 2021;3:100256.
25. Kord Varkaneh H, Salehi Sahlabadi A, Găman MA, et al. Effects of the 5:2 intermittent fasting diet on non-alcoholic fatty liver disease: a randomized controlled trial. Front Nutr. 2022;9:948655.
26. Gallage S, Ali A, Barragan Avila JE, et al. A 5:2 intermittent fasting regimen ameliorates NASH and fibrosis and blunts HCC development via hepatic PPARα and PCK1. Cell Metab. 2024;36:1371-93.e7.
27. Boelen A, Wiersinga WM, Fliers E. Fasting-induced changes in the hypothalamus-pituitary-thyroid axis. Thyroid. 2008;18:123-9.
28. Moro T, Tinsley G, Bianco A, et al. Effects of eight weeks of time-restricted feeding (16/8) on basal metabolism, maximal strength, body composition, inflammation, and cardiovascular risk factors in resistance-trained males. J Transl Med. 2016;14:290.
29. García-Luna C, Prieto I, Soberanes-Chávez P, et al. Effects of intermittent fasting on hypothalamus-pituitary-thyroid axis, palatable food intake, and body weight in stressed rats. Nutrients. 2023;15:1164.
30. Domingues-Hajj PMS, Gomes PM, Magalhães PKR, Maciel LMZ. Assessment of cardiometabolic risk factors and insulin sensitivity by hyperinsulinemic-euglycemic clamp in resistance to thyroid hormone β syndrome. Thyroid. 2024;34:1038-46.
31. Wei Y, Li X, Cui R, Liu J, Wang G. Associations between sensitivity to thyroid hormones and insulin resistance in euthyroid adults with obesity. Front Endocrinol. 2024;15:1366830.
32. Brenta G. Why can insulin resistance be a natural consequence of thyroid dysfunction? J Thyroid Res. 2011;2011:152850.
33. Harrison SA, Bashir MR, Guy CD, et al. Resmetirom (MGL-3196) for the treatment of non-alcoholic steatohepatitis: a multicentre, randomised, double-blind, placebo-controlled, phase 2 trial. Lancet. 2019;394:2012-24.
34. Bianco AC, Kim BW. Deiodinases: implications of the local control of thyroid hormone action. J Clin Invest. 2006;116:2571-9.
35. Ahima RS, Prabakaran D, Mantzoros C, et al. Role of leptin in the neuroendocrine response to fasting. Nature. 1996;382:250-2.
36. Mullur R, Liu YY, Brent GA. Thyroid hormone regulation of metabolism. Physiol Rev. 2014;94:355-82.
37. Vilar-Gomez E, Martinez-Perez Y, Calzadilla-Bertot L, et al. Weight loss through lifestyle modification significantly reduces features of nonalcoholic steatohepatitis. Gastroenterology. 2015;149:367-78.e5; quiz e14.
38. Salas-Salvadó J, Bulló M, Estruch R, et al. Prevention of diabetes with Mediterranean diets: a subgroup analysis of a randomized trial. Ann Intern Med. 2014;160:1-10.
39. Schulz KF, Altman DG, Moher D; CONSORT Group. CONSORT 2010 statement: updated guidelines for reporting parallel group randomized trials. Ann Intern Med. 2010;152:726-32.
40. Patterson RE, Laughlin GA, LaCroix AZ, et al. Intermittent fasting and human metabolic health. J Acad Nutr Diet. 2015;115:1203-12.
41. Caussy C, Reeder SB, Sirlin CB, Loomba R. Noninvasive, quantitative assessment of liver fat by MRI-PDFF as an endpoint in NASH trials. Hepatology. 2018;68:763-72.
42. Althubaiti A. Information bias in health research: definition, pitfalls, and adjustment methods. J Multidiscip Healthc. 2016;9:211-7.
43. Fliers E, Klieverik LP, Kalsbeek A. Novel neural pathways for metabolic effects of thyroid hormone. Trends Endocrinol Metab. 2010;21:230-6.
44. Grimes DA, Schulz KF. Bias and causal associations in observational research. Lancet. 2002;359:248-52.
Cite This Article
How to Cite
Download Citation
Export Citation File:
Type of Import
Tips on Downloading Citation
Citation Manager File Format
Type of Import
Direct Import: When the Direct Import option is selected (the default state), a dialogue box will give you the option to Save or Open the downloaded citation data. Choosing Open will either launch your citation manager or give you a choice of applications with which to use the metadata. The Save option saves the file locally for later use.
Indirect Import: When the Indirect Import option is selected, the metadata is displayed and may be copied and pasted as needed.
About This Article
Special Issue
Copyright

Data & Comments
Data
0


Comments
Comments must be written in English. Spam, offensive content, impersonation, and private information will not be permitted. If any comment is reported and identified as inappropriate content by OAE staff, the comment will be removed without notice. If you have any queries or need any help, please contact us at [email protected].