


fig2
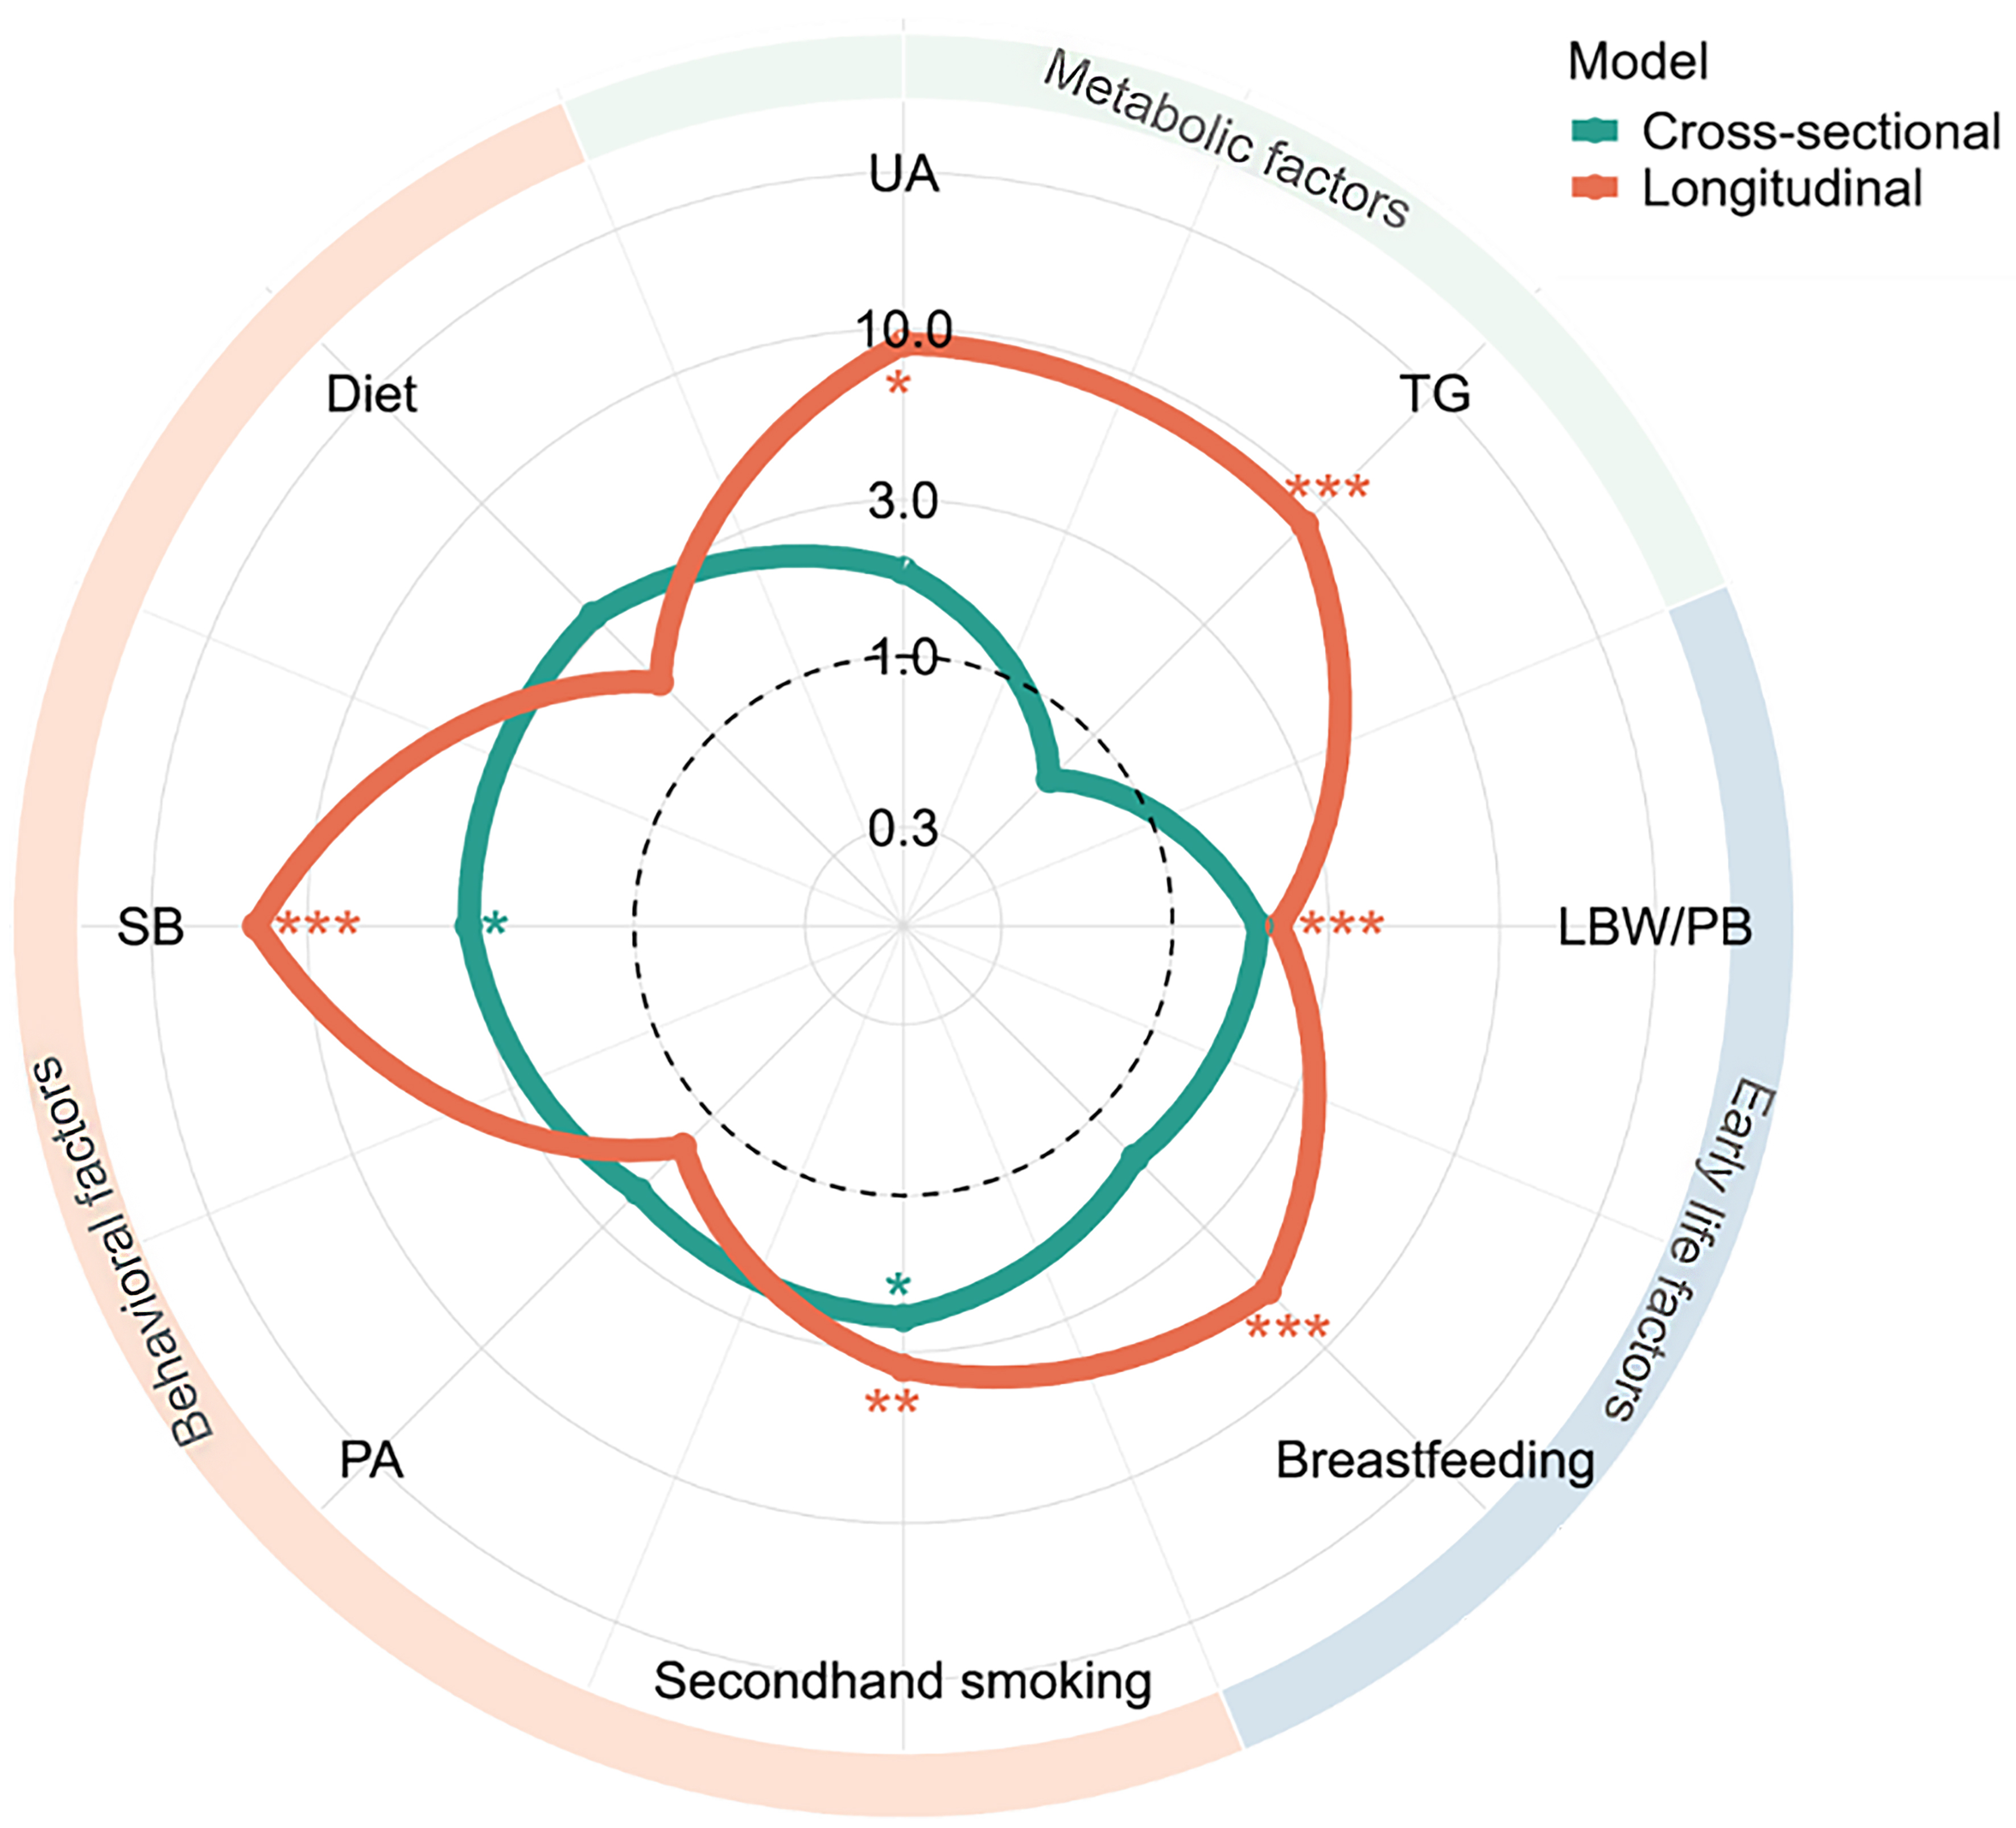
Figure 2. Independent effects of metabolic, behavioral, and early-life factors on baseline and follow-up MASLD. Numbers represent ORs for each factor. Models were adjusted for age, sex, WHtR group, and school clustering. Figure generated using R 4.2.1. UA: Uric acid; TG: triglyceride; LBW/PB: low birth weight/ preterm birth; PA: physical activity; SB: sedentary behavior; MASLD: metabolic dysfunction-associated steatotic liver disease; WHtR: waist-to-height ratio; OR: odds ratio. *P < 0.05; **P < 0.01; ***P < 0.001.


