


fig3
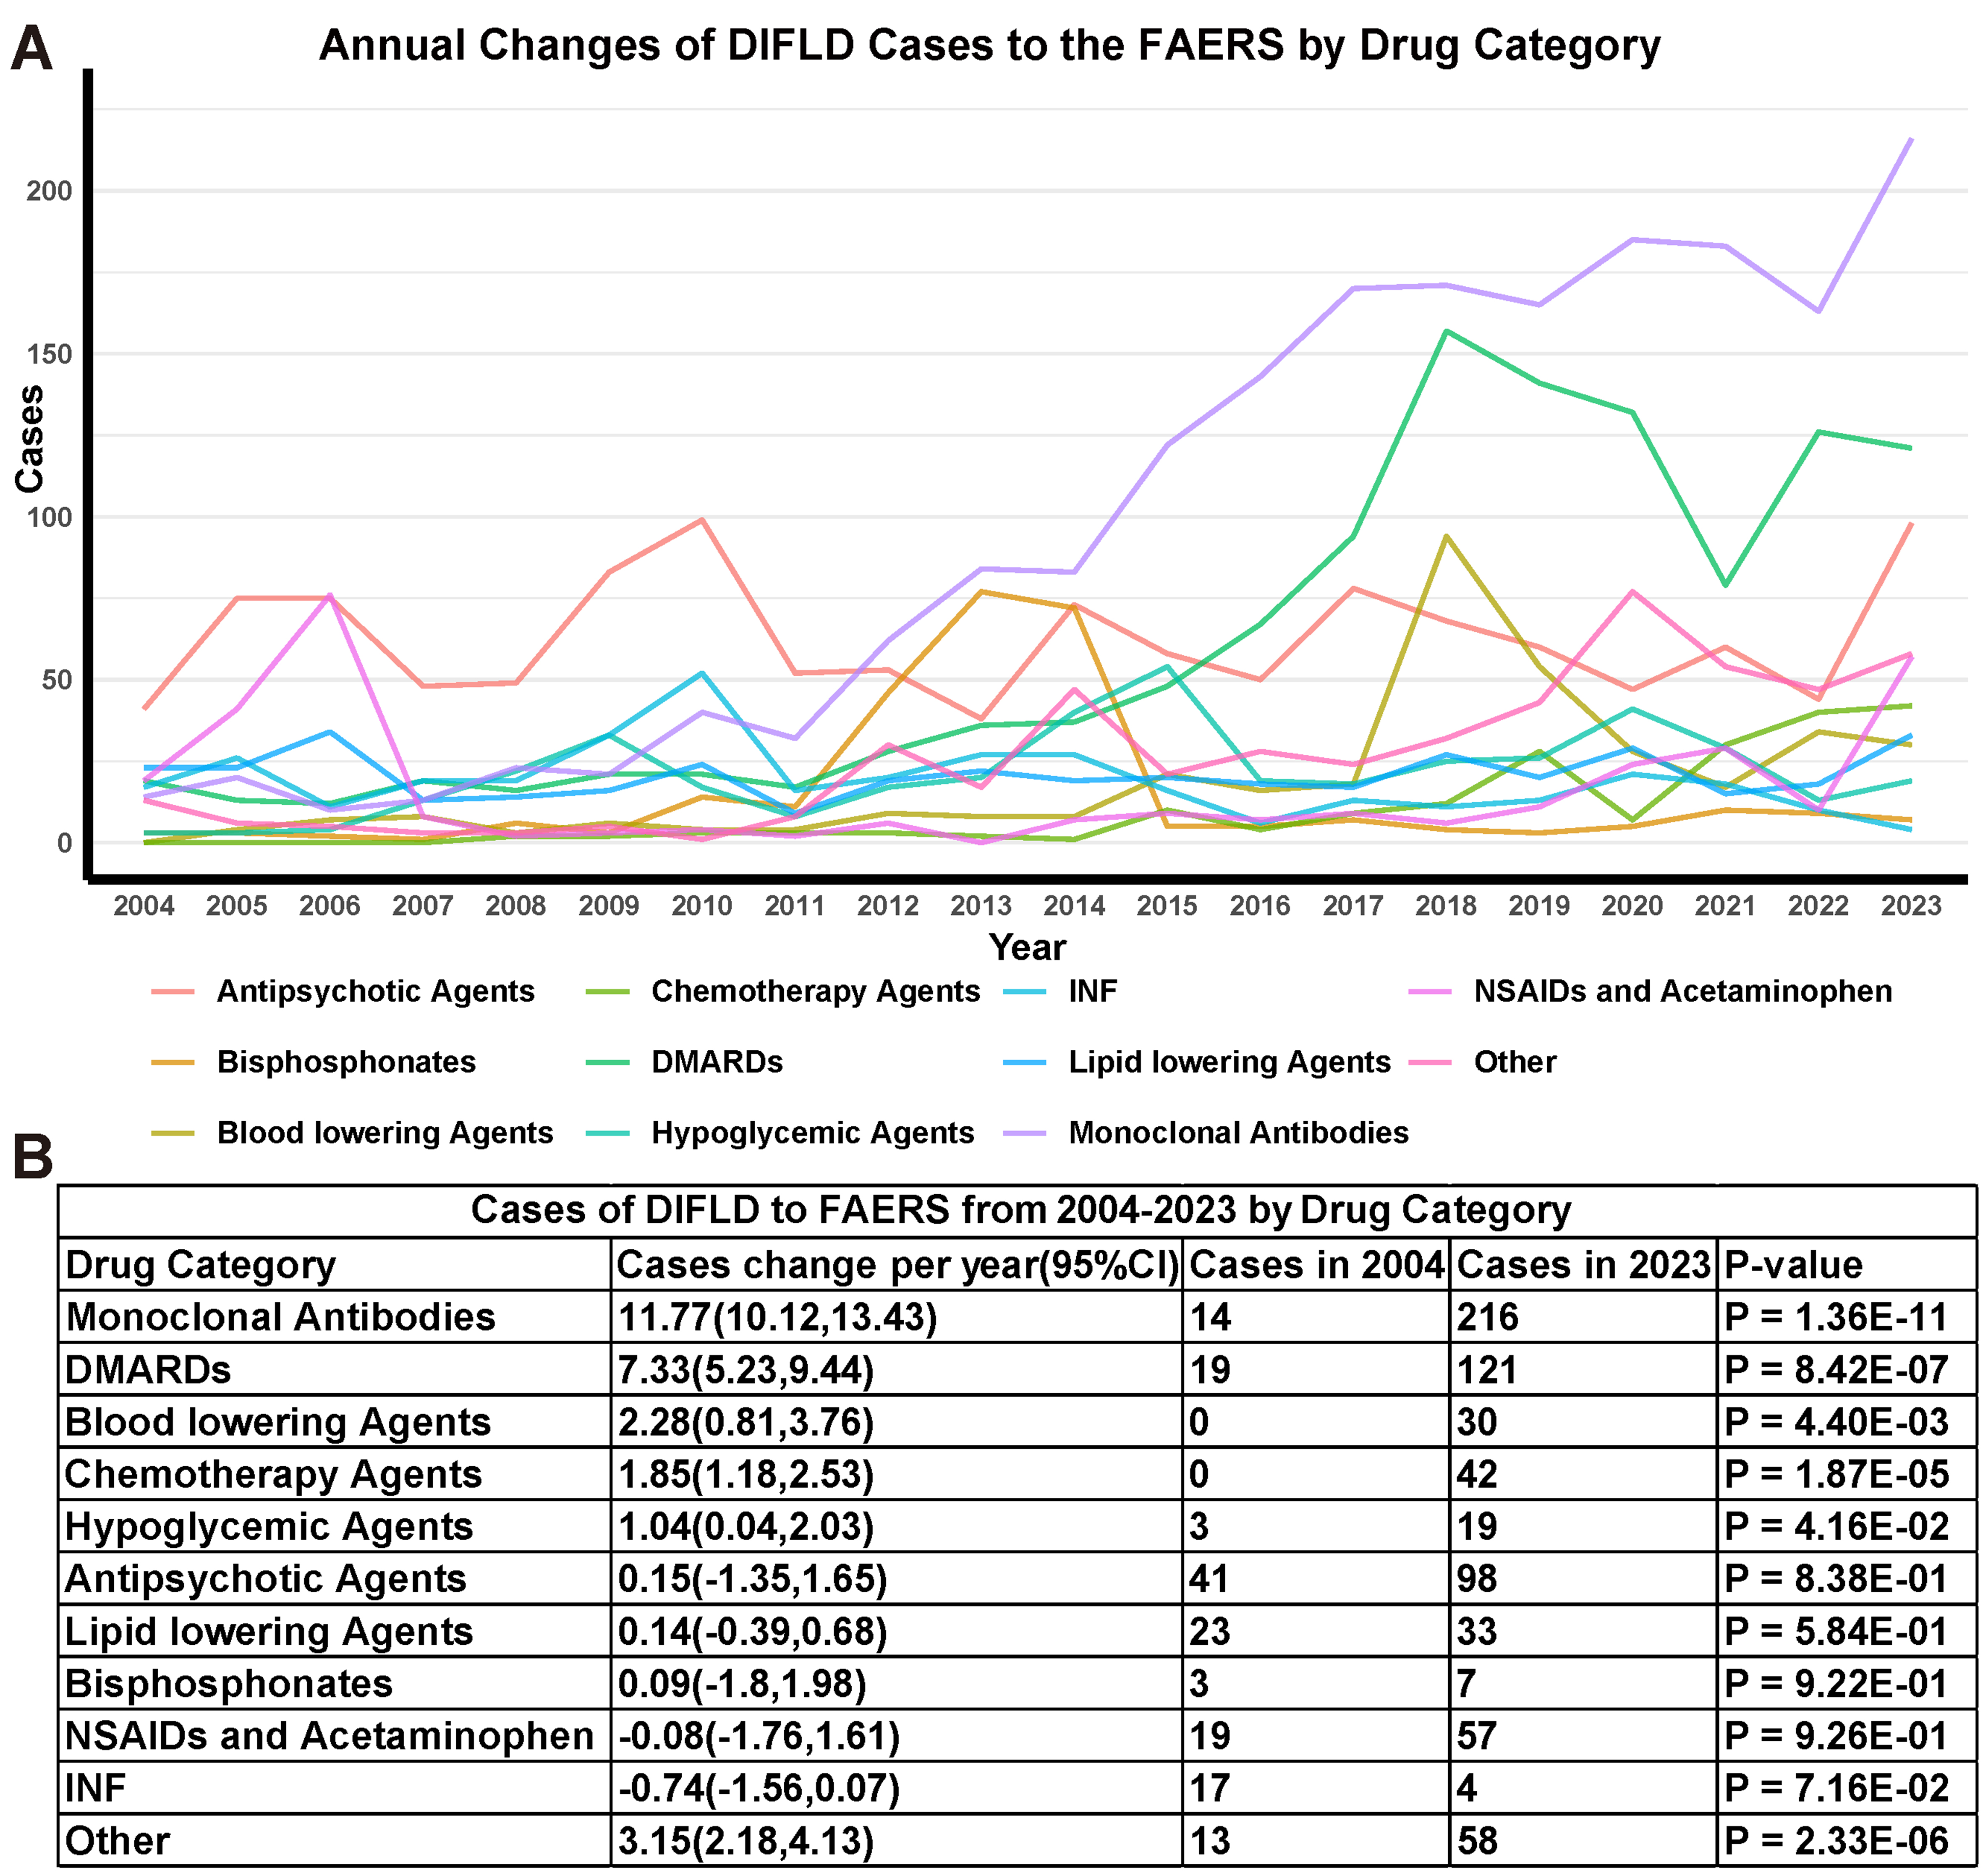
Figure 3. DIFLD reports linear regression analysis by drug classes. (A) Trends in the DIFLD reports associated with various drug categories from 2004 to 2023; (B) Summary table showing the average cases change per year in DIFLD reports across drug categories. The statistical significance of changes in each drug category is indicated by the P-value (P < 0.05 considered significant). We confirm that the figure is original and does not require external copyright permission. DIFLD: Drug-induced fatty liver disease; CI: confidence interval; DMARDs: disease-modifying antirheumatic drugs; FAERS: Food and Drug Administration’s Adverse Event Reporting System; INF: interferon; NSAIDs: nonsteroidal anti-inflammatory drugs.


