


fig1
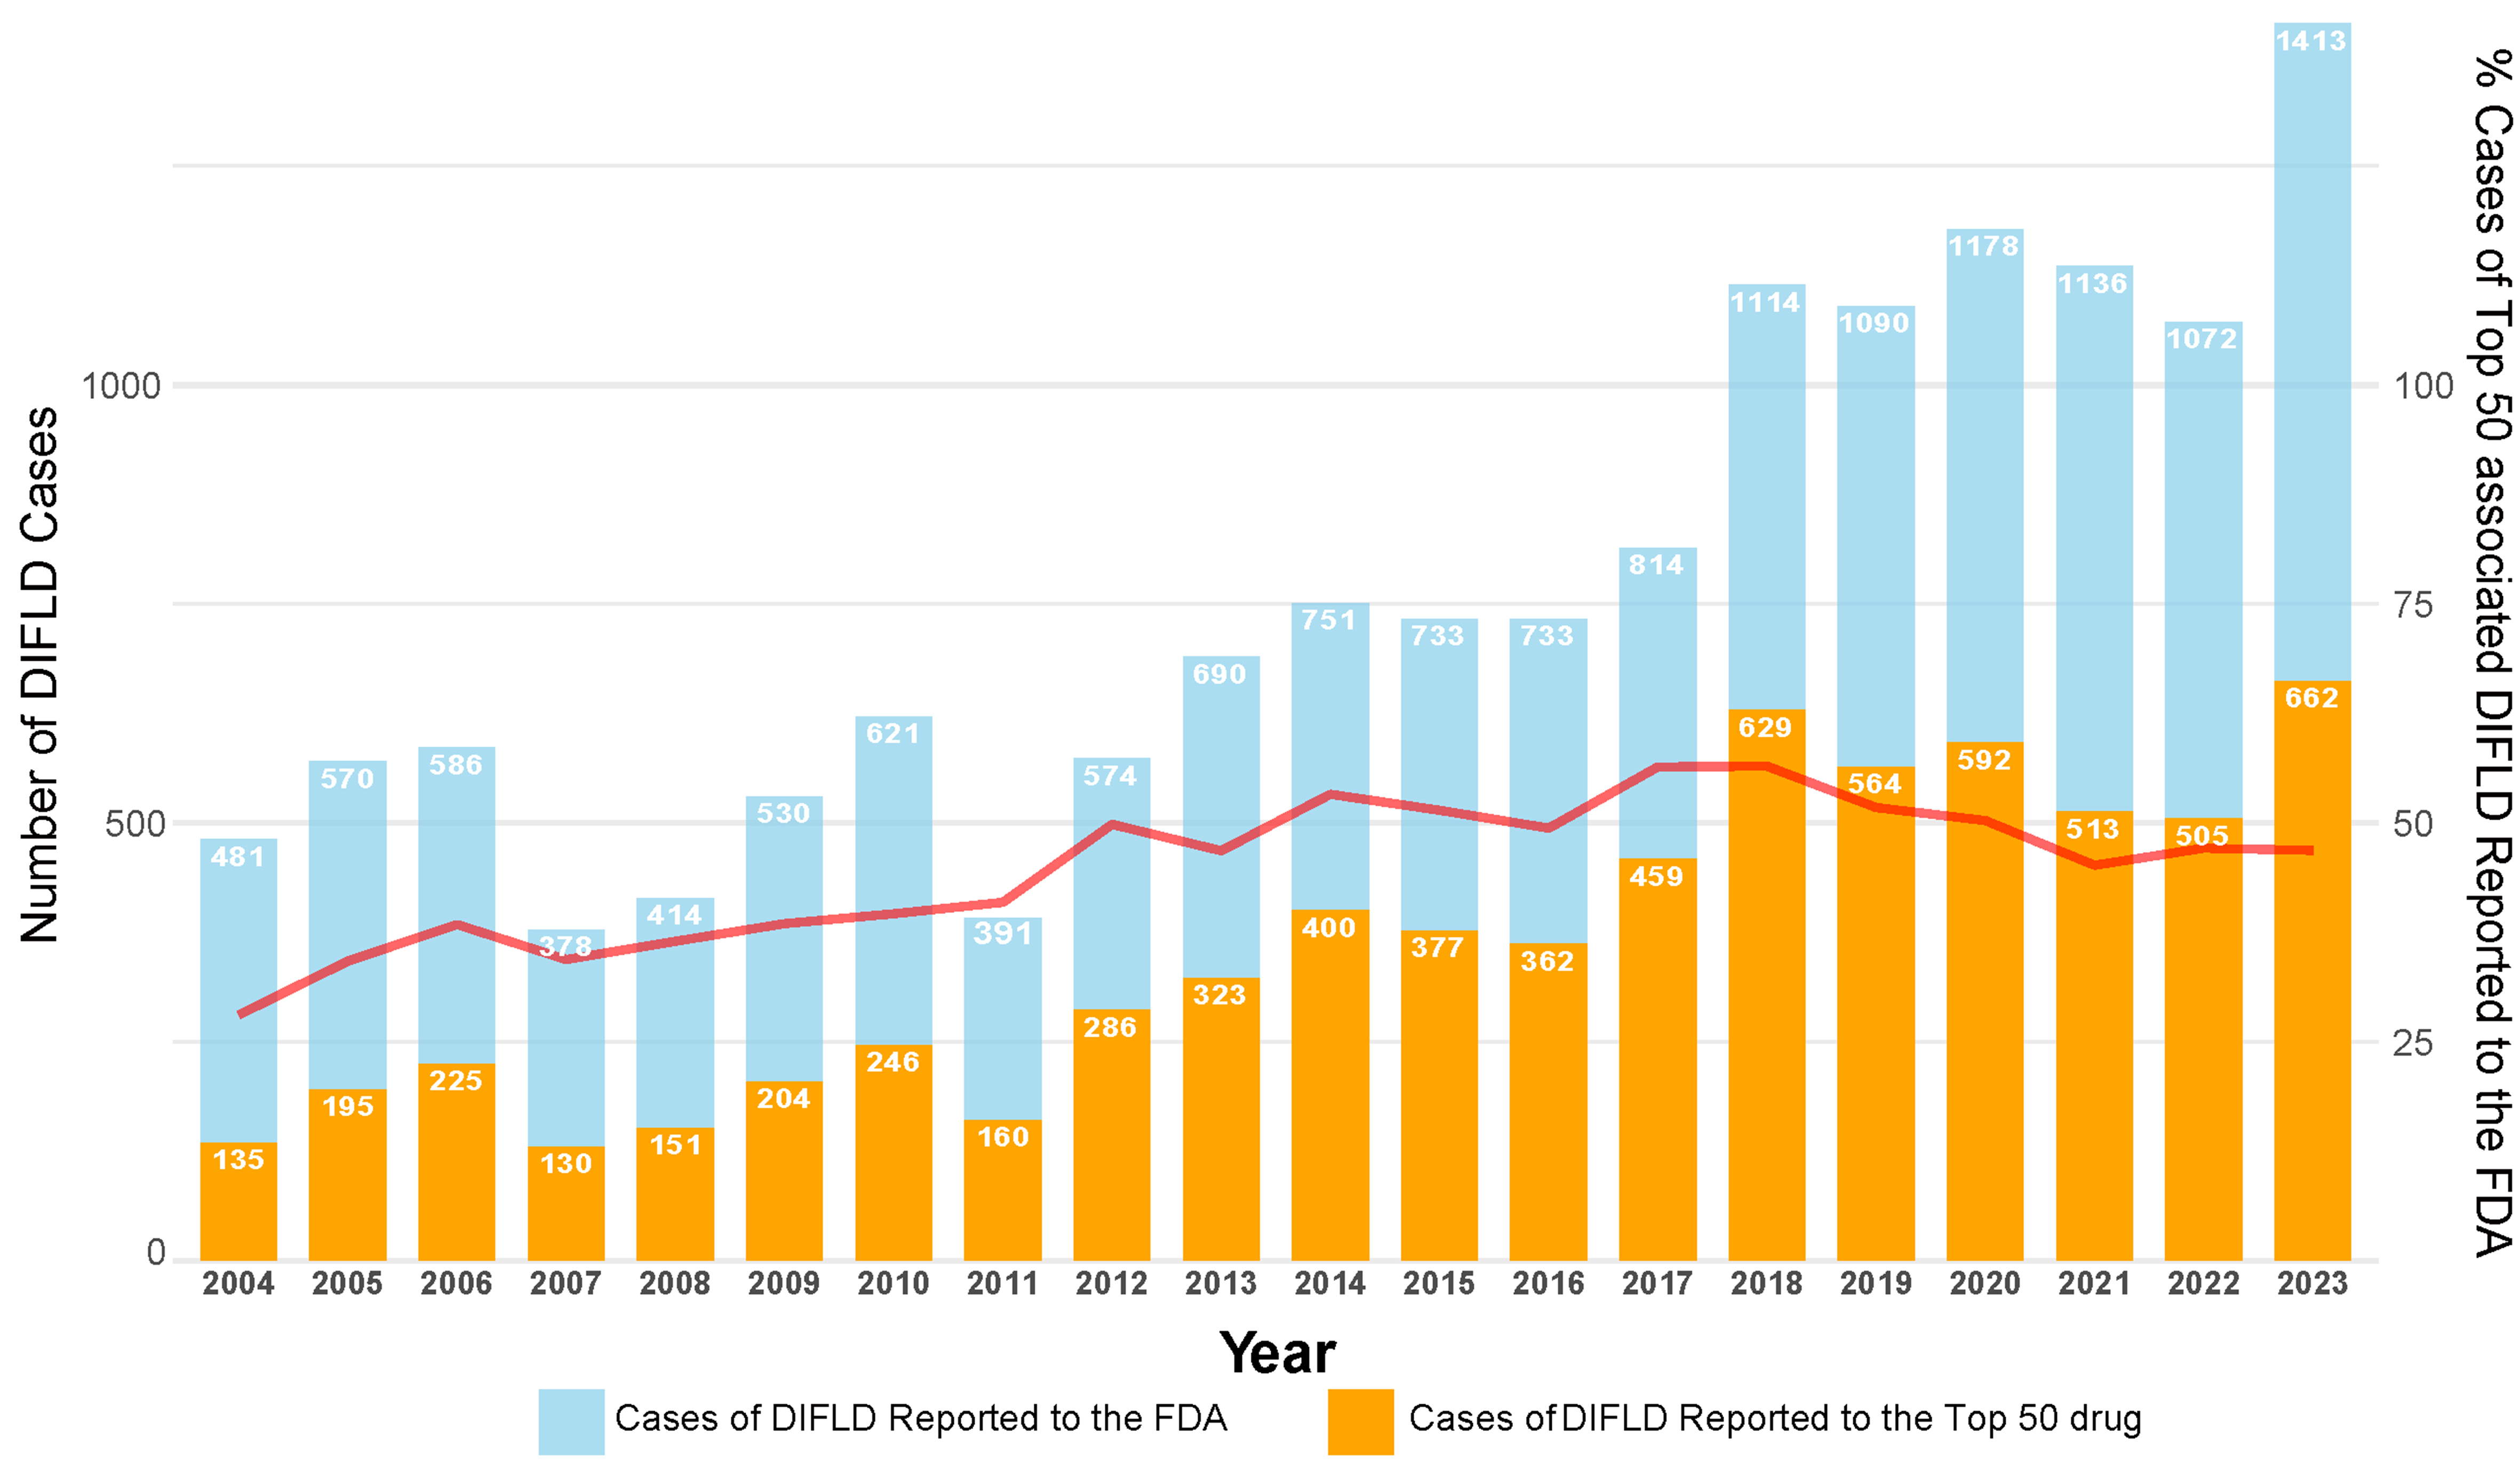
Figure 1. Trends in DIFLD cases reported to the FAERS and associated with top 50 drugs (2004-2023). The bar chart illustrates the total number of DIFLD cases reported to the FAERS (blue bars) and the cases associated with the top 50 drugs (orange bars) from 2004 to 2023. The red line represents the percentage of DIFLD cases caused by the top 50 drugs out of the total cases reported annually. We confirm the figure is original and does not require external copyright permission. DIFLD: Drug-induced fatty liver disease; FAERS: Food and Drug Administration’s Adverse Event Reporting System; FDA: U.S. Food and Drug Administration.


