

fig6
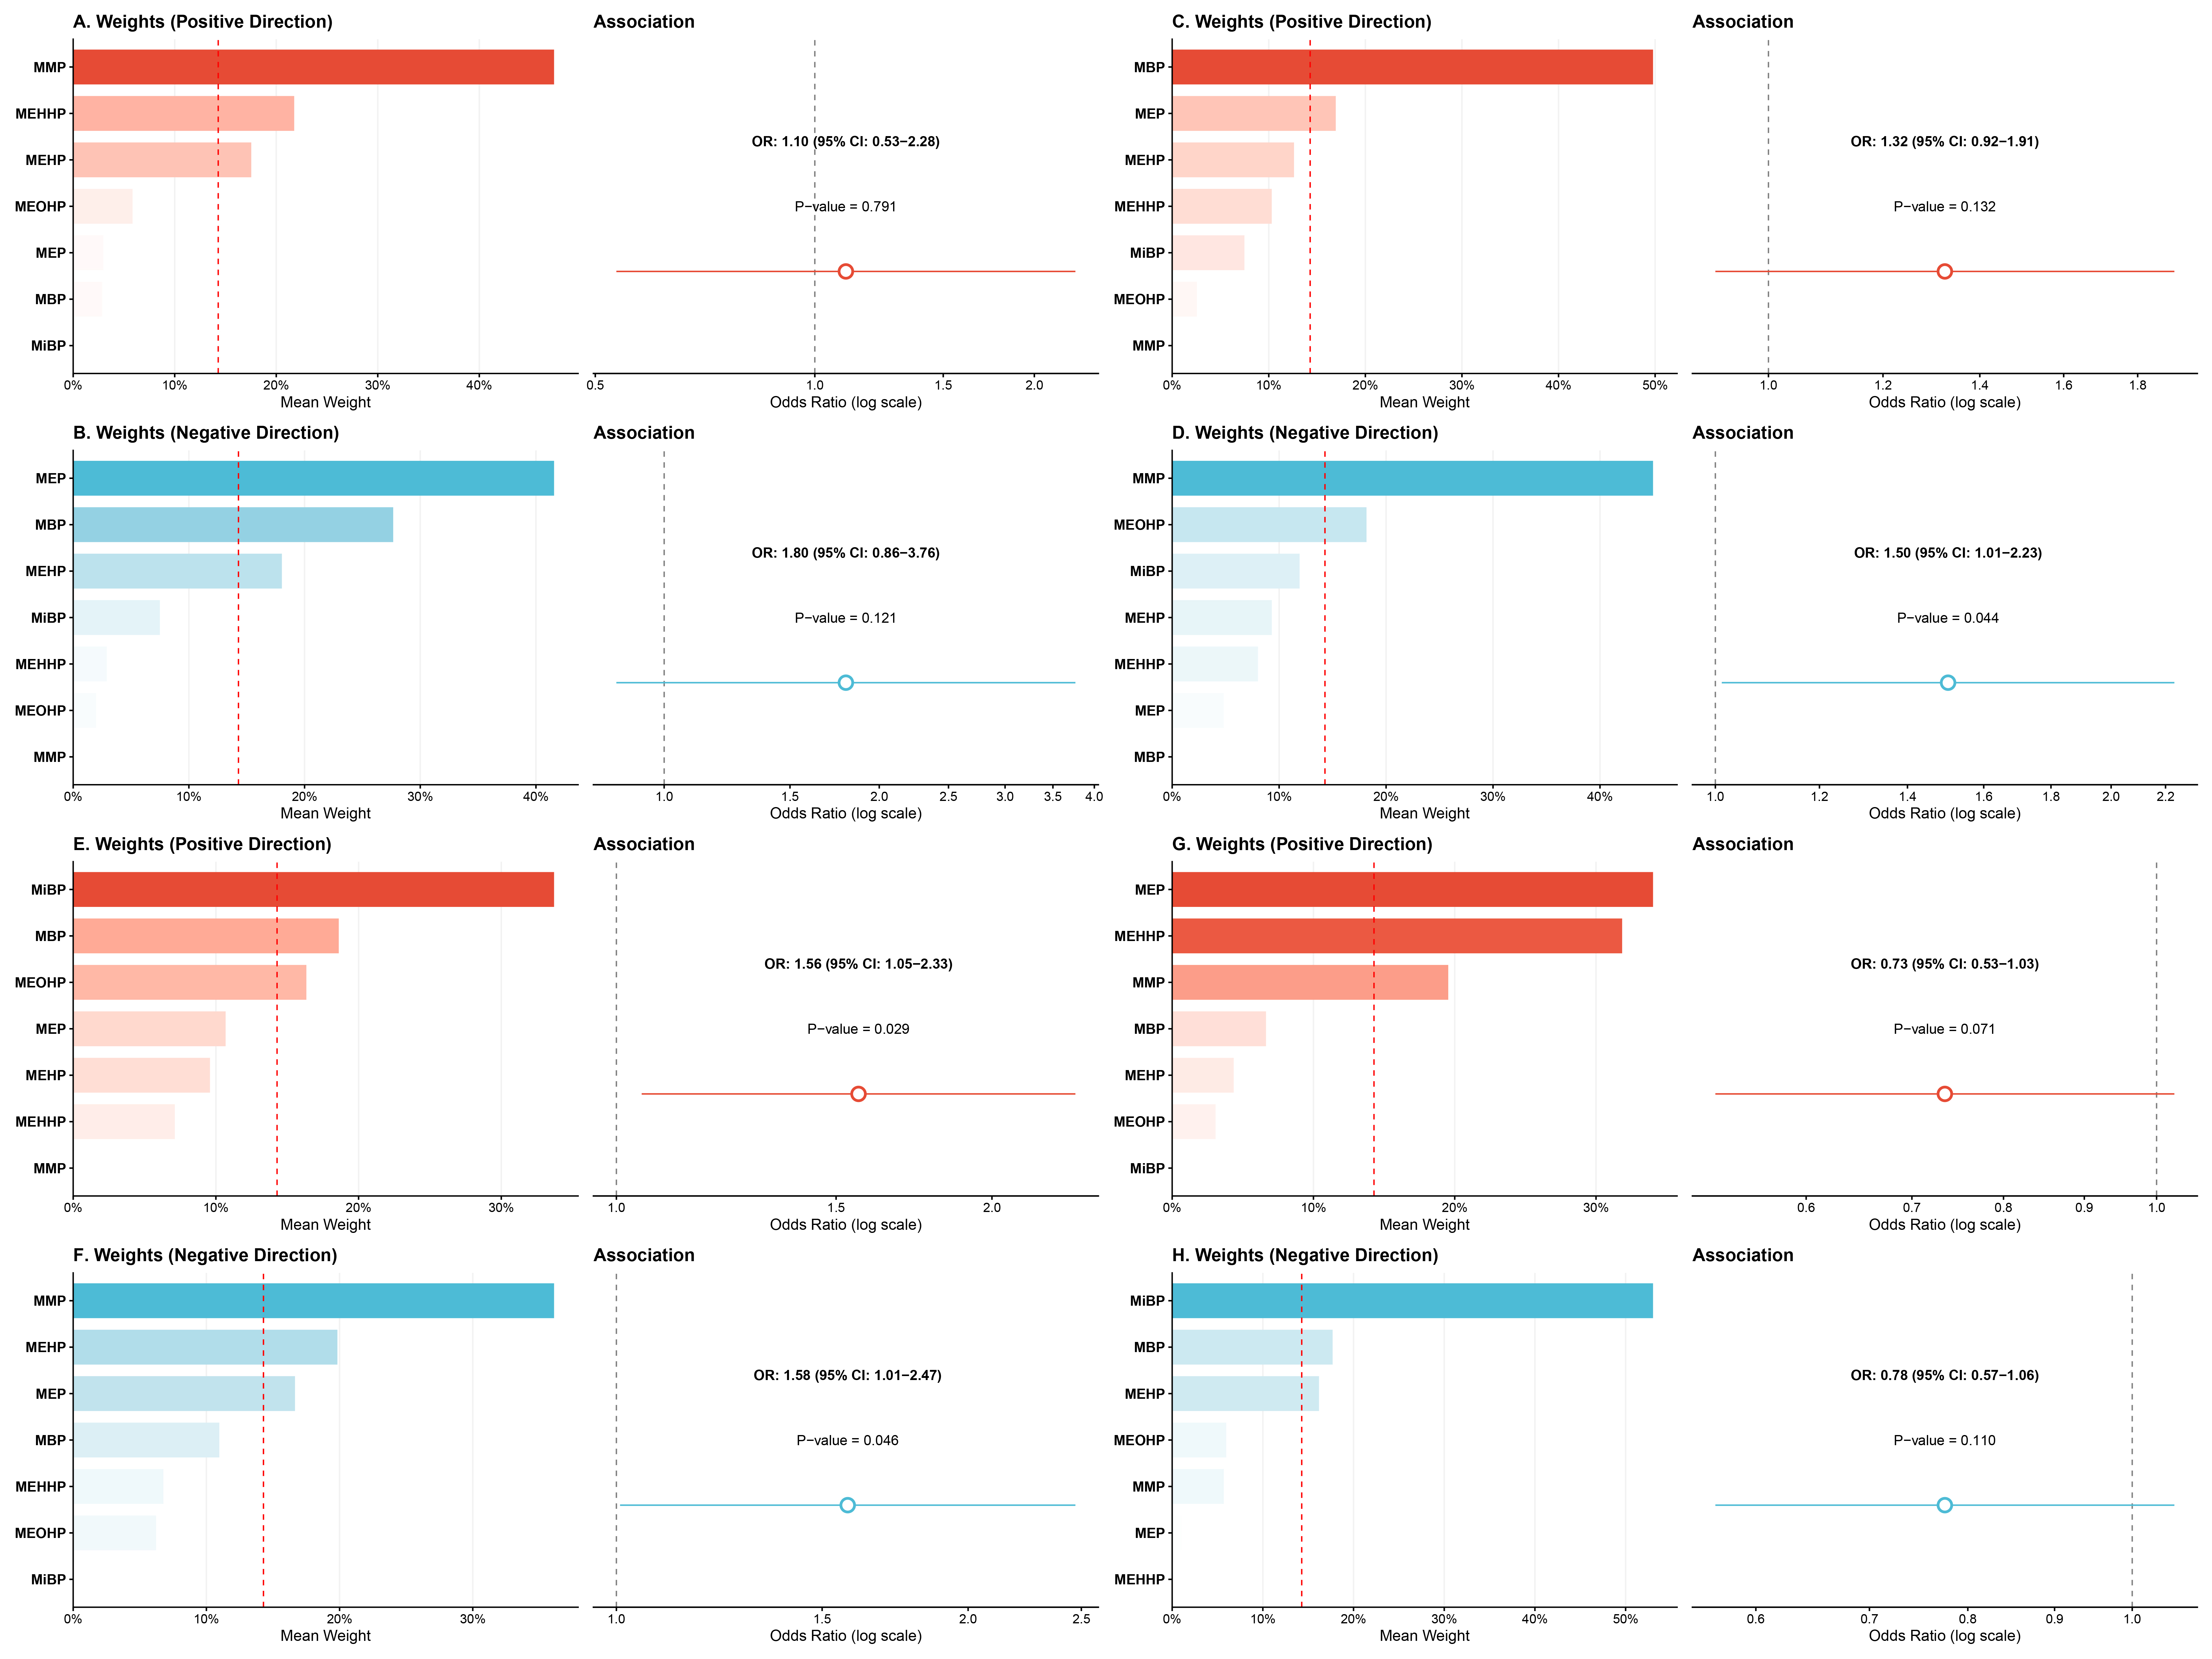
Figure 6. Weighted Quantile Sum (WQS) model of phthalate exposure and cardiometabolic risk progression patterns. Results from weighted quantile sum regression analyses are shown for both positive- and negative-direction models. (A) Positive-direction model for the improving pattern; (B) Negative-direction model for the improving pattern; (C) Positive-direction model for the fluctuating pattern; (D) Negative-direction model for the fluctuating pattern; (E) Positive-direction model for the persistently abnormal pattern; (F) Negative-direction model for the persistently abnormal pattern; (G) Positive-direction model for the worsening pattern; (H) Negative-direction model for the worsening pattern. In each panel, the left plot shows the WQS weights of individual phthalate metabolites, and the right plot shows the corresponding association estimate. Phthalate metabolites were categorized into quartiles and combined into a mixture index. The model was adjusted for the same covariates as Model 3. OR: Odds ratio; CI: confidence interval; MMP: monomethyl phthalate; MEP: monoethyl phthalate; MBP: mono-n-butyl phthalate; MEHP: mono-2-ethylhexyl phthalate; MEOHP: mono-2-ethyl-5-oxohexyl phthalate; MEHHP: mono-2-ethyl-5-hydroxyhexyl phthalate; MiBP: monoisobutyl phthalate.





