

fig3

Triglyceride-glucose waist-to-weight index and bone microarchitecture in type 2 diabetes: a machine-learning and regression analysis

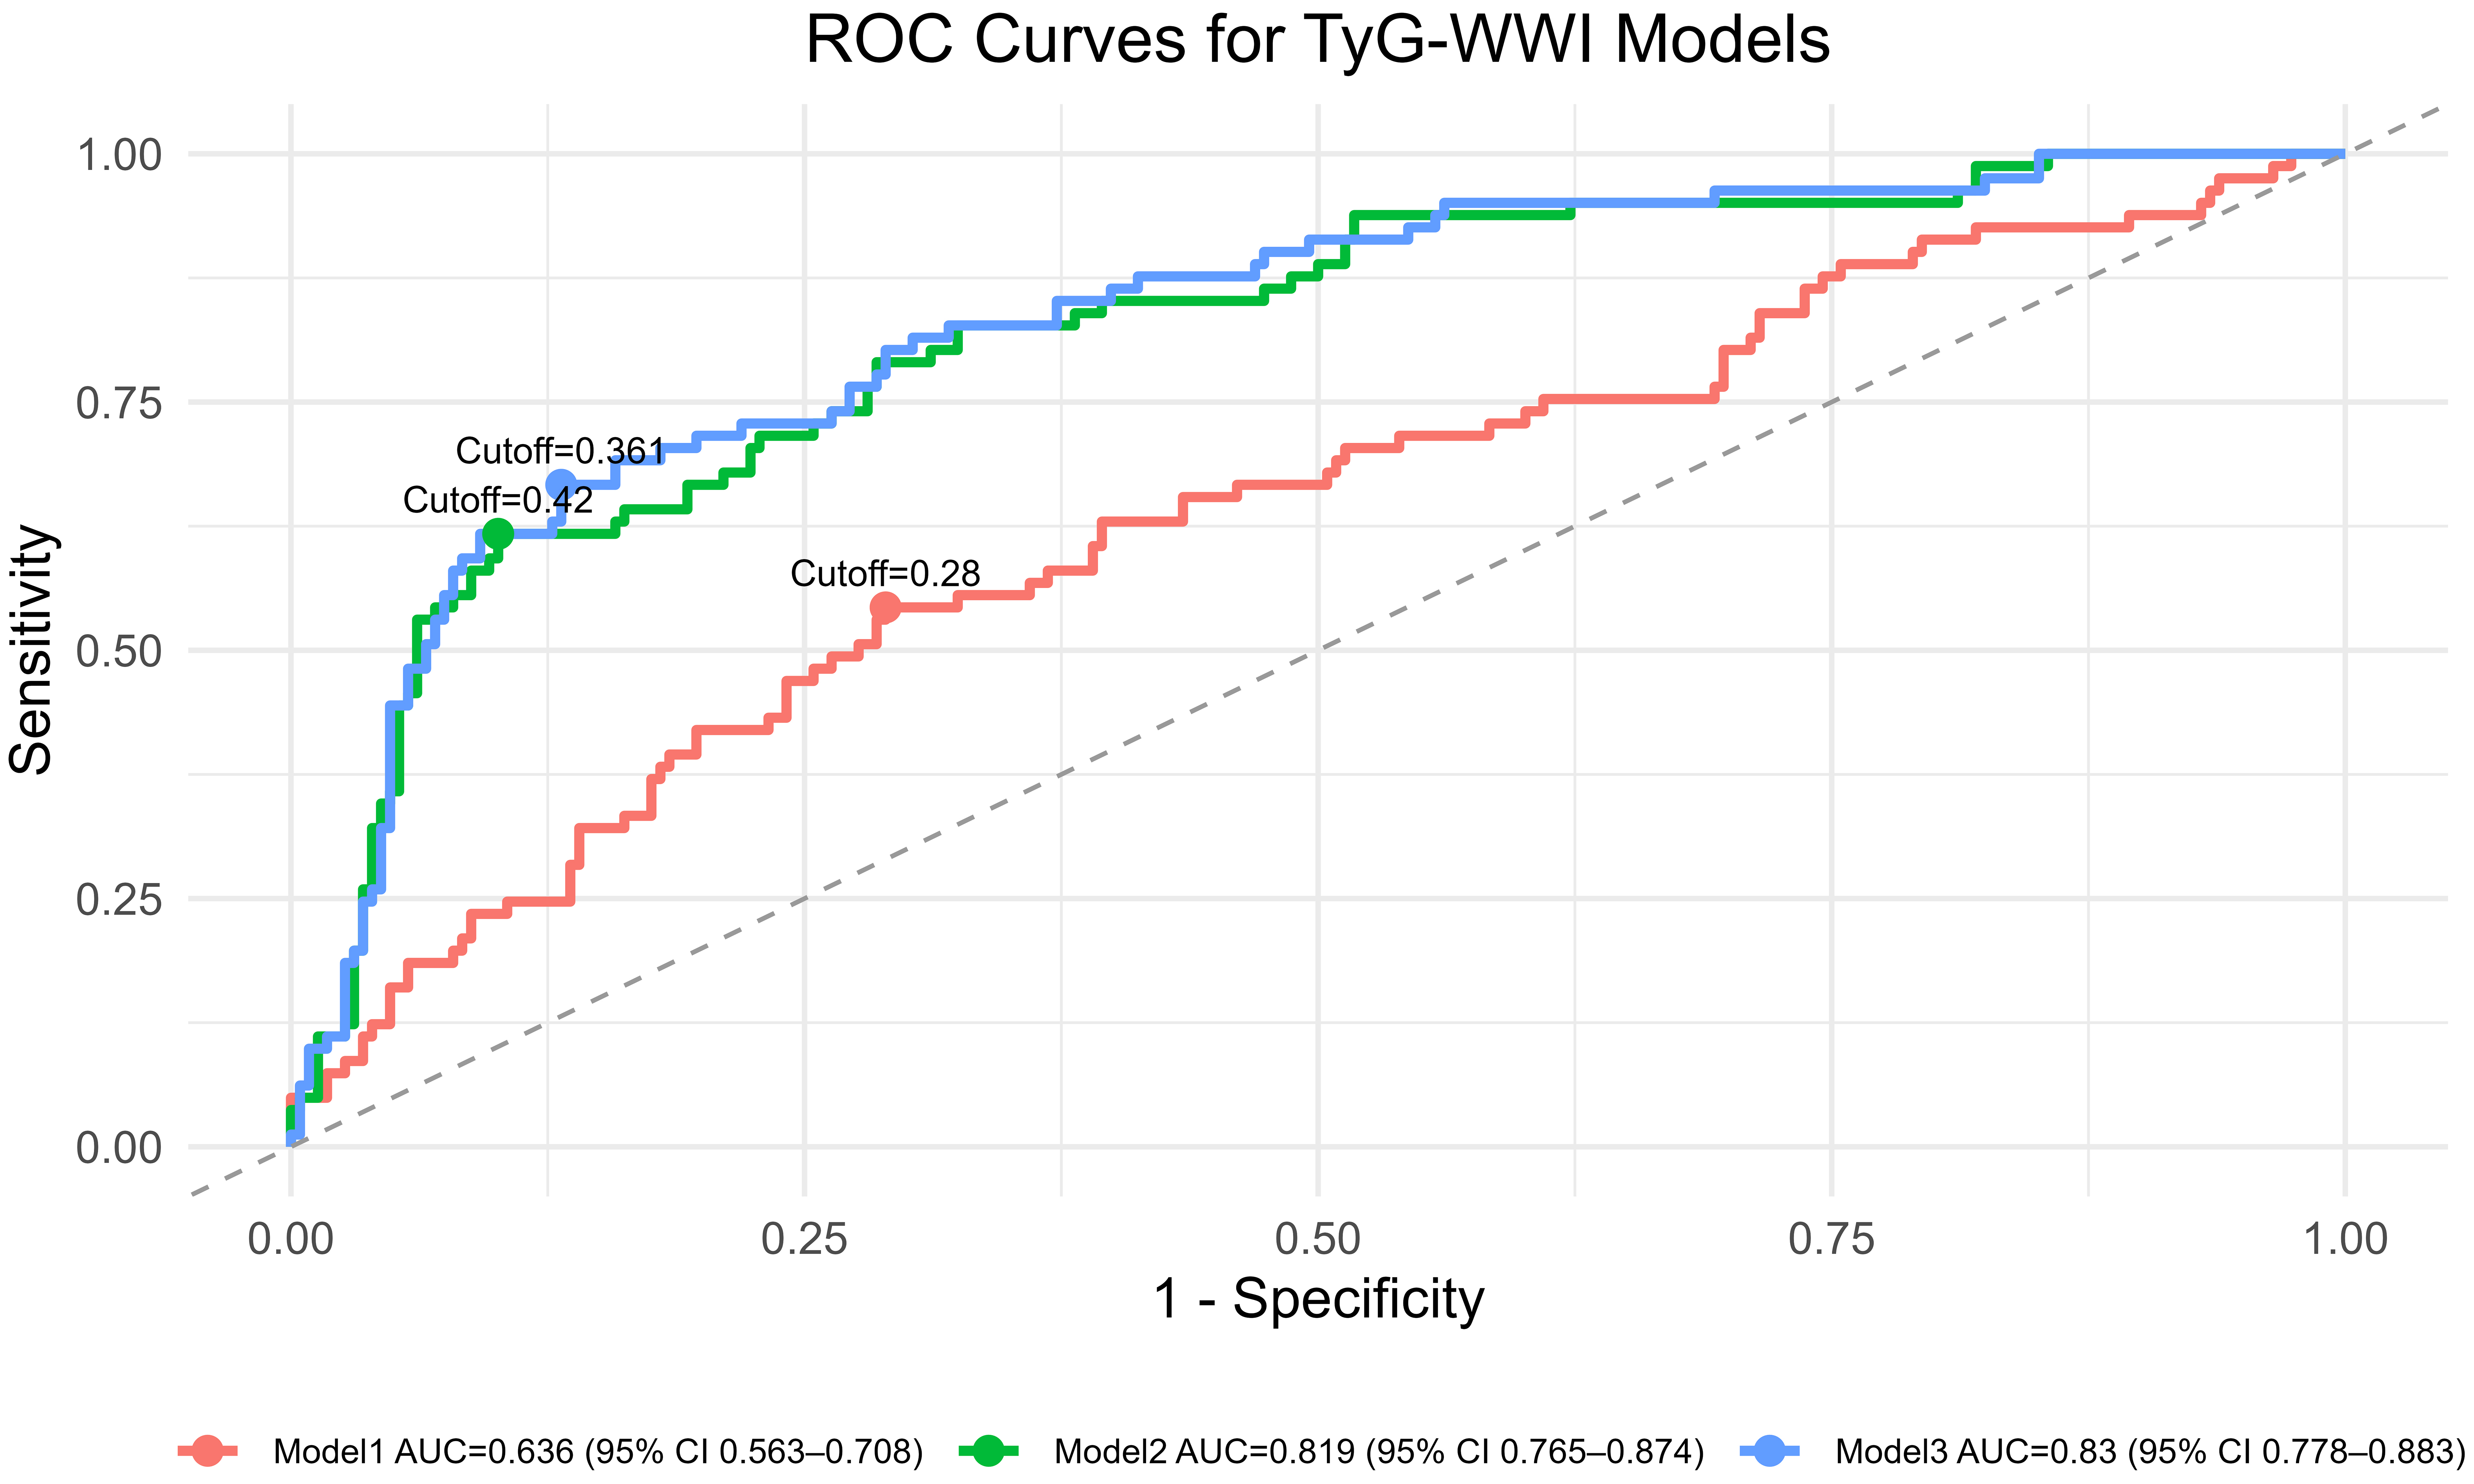
Figure 3. ROC curves of TyG-WWI-based models for discriminating TBS deterioration. Model 1 included TyG-WWI; Model 2 included TyG-WWI, age, and sex; Model 3 additionally included RF-selected covariates. RF: Random forest; ROC: receiver operating characteristic; TBS: trabecular bone score; TyG-WWI: triglyceride-glucose index combined with weight-adjusted waist index.


Metabolism and Target Organ Damage
ISSN 2769-6375 (Online)
Follow Us

Portico

All published articles are preserved here permanently:

https://www.portico.org/publishers/oae/

Portico

All published articles are preserved here permanently:

https://www.portico.org/publishers/oae/



