

fig2
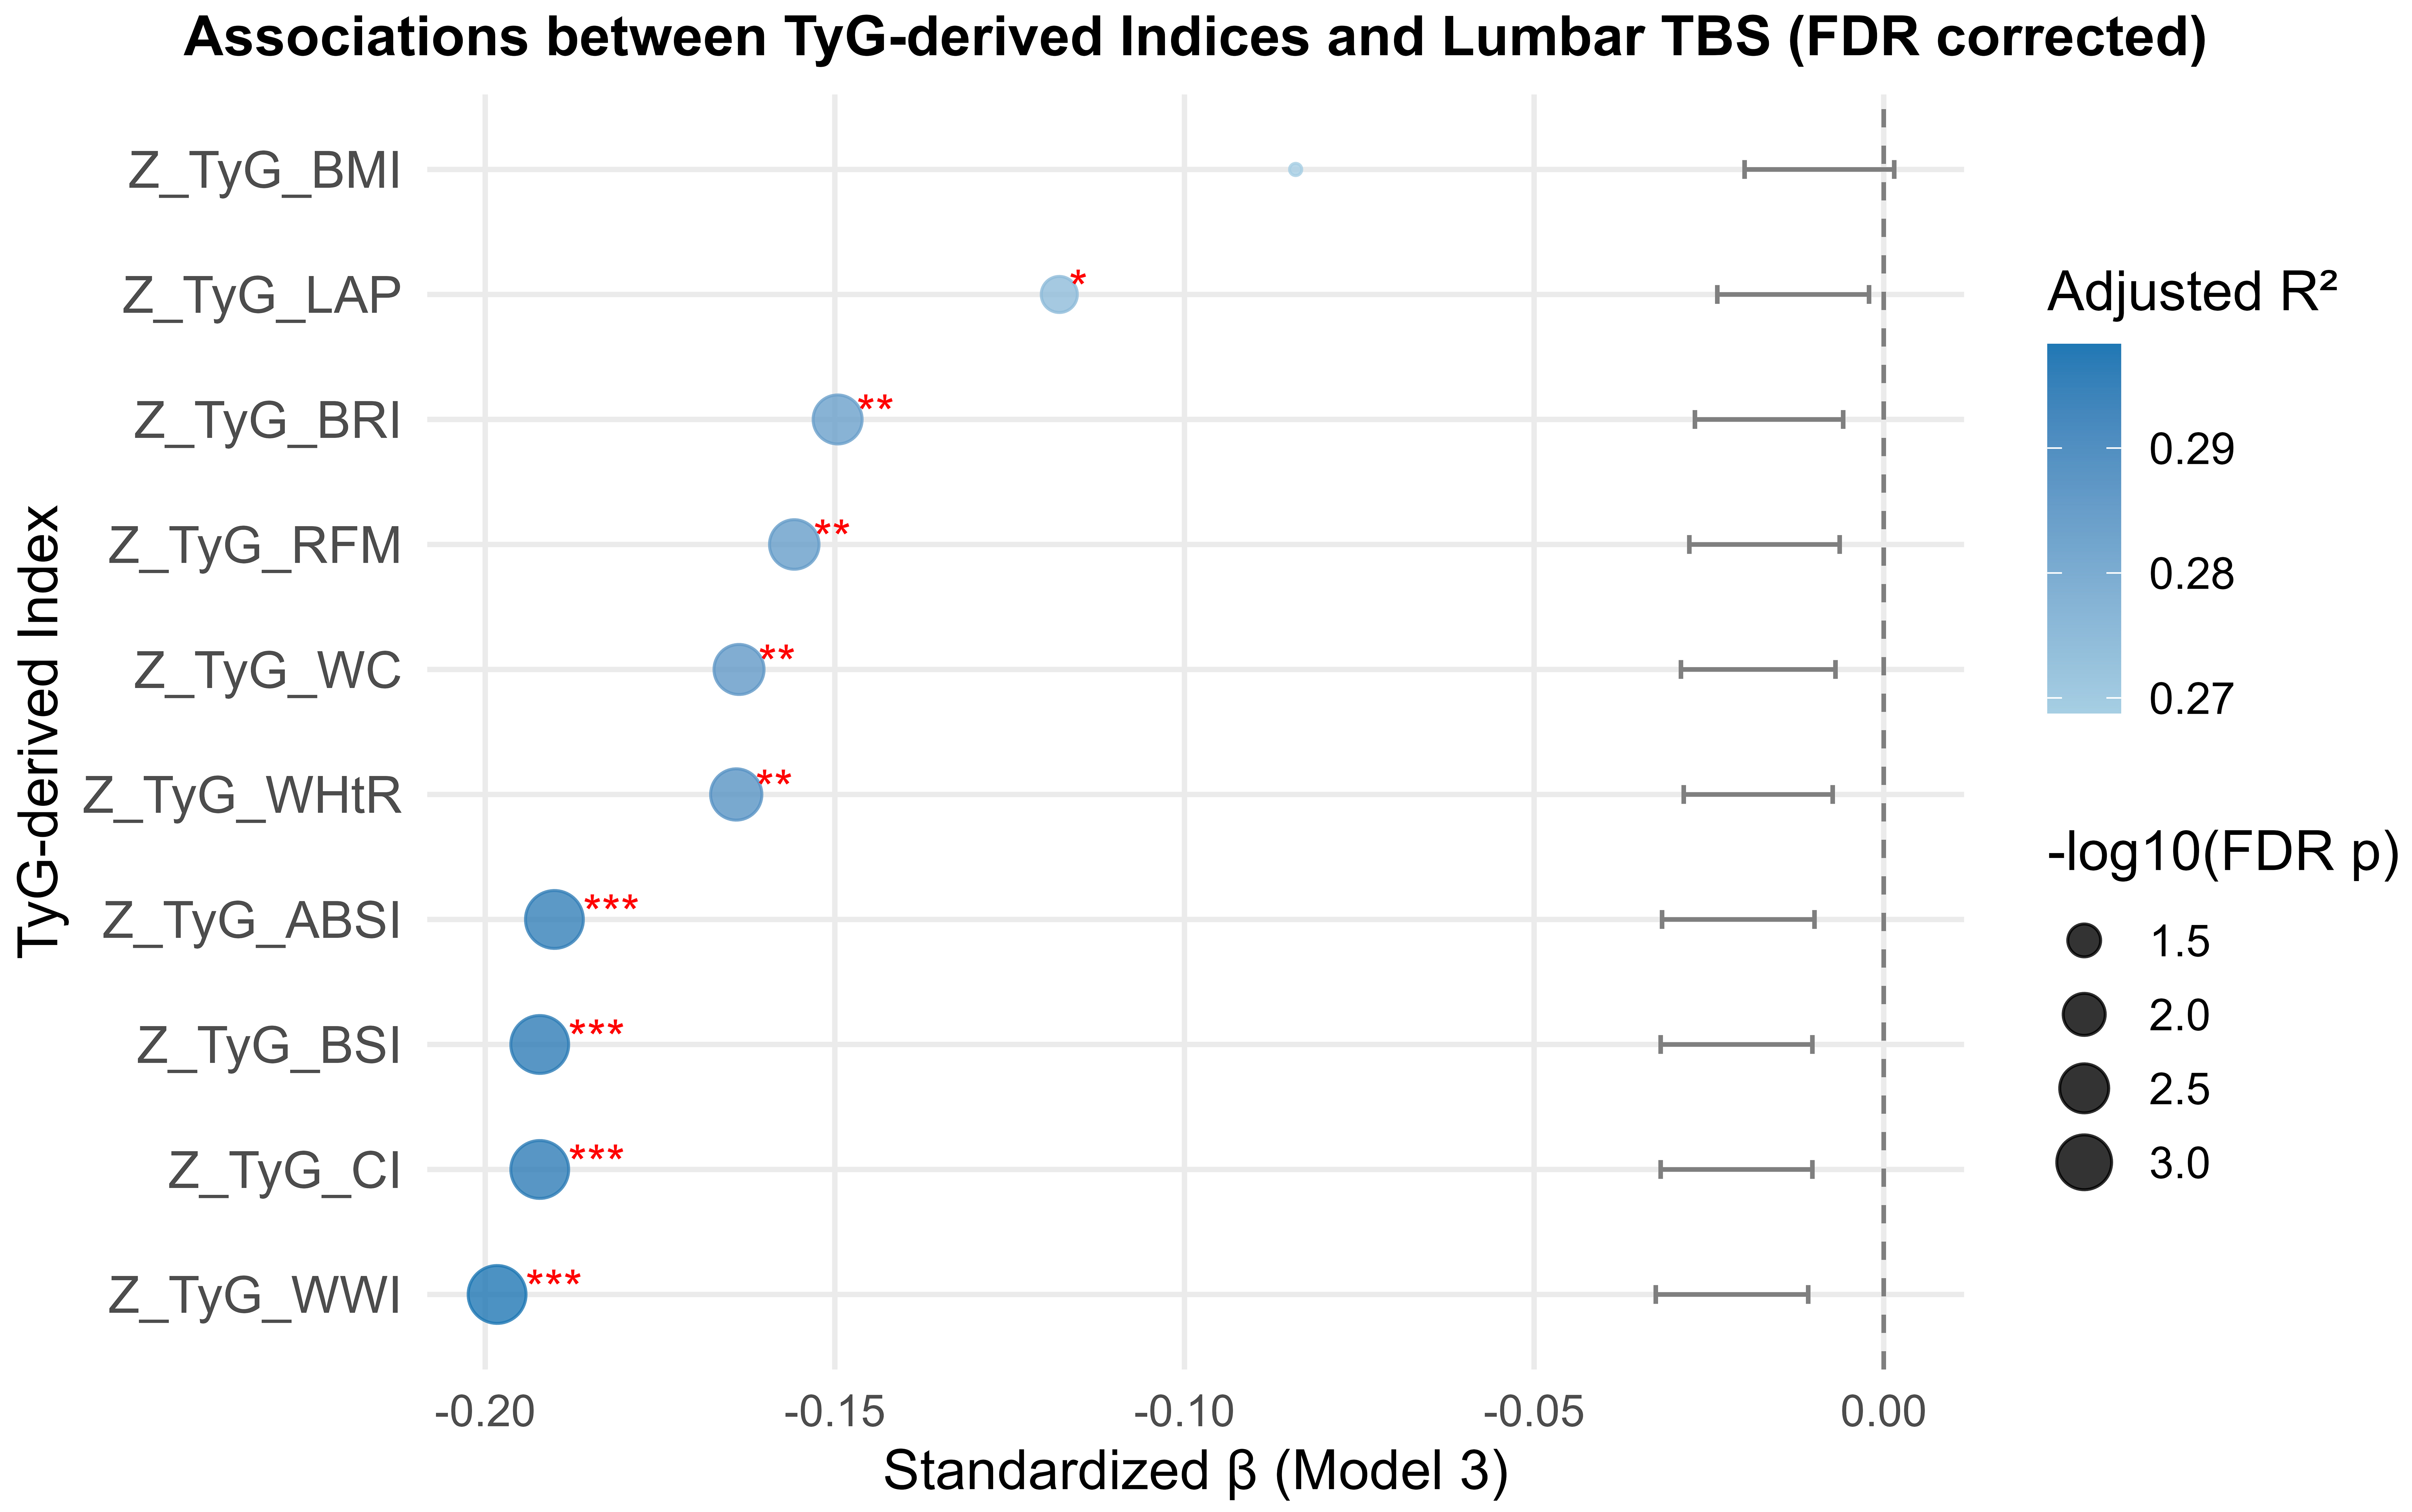
Figure 2. Standardized β coefficients of TyG-derived indices for TBS from multivariable linear regression in Model 3. *P < 0.05, **P < 0.01, and ***P < 0.001. Bubble size = -log10(P); color intensity = adjusted R2. A negative β indicates an inverse association between a TyG-derived index and TBS. Model 3 included each TyG-derived index, sex, age, and RF-selected covariates [SCr (μmol/L), 25-(OH)VitD (ng/mL), BUN (mmol/L), P1NP, albumin (g/L), PTH, smoking, γ-GGT, UACR (mg/g), and serum phosphorus]. BUN: Blood urea nitrogen; P1NP: procollagen type I N-terminal propeptide; PTH: parathyroid hormone; RF: random forest; SCr: serum creatinine; TBS: trabecular bone score; TyG: triglyceride-glucose index; UACR: urinary albumin-to-creatinine ratio; γ-GGT: gamma-glutamyl transferase.





