


fig3
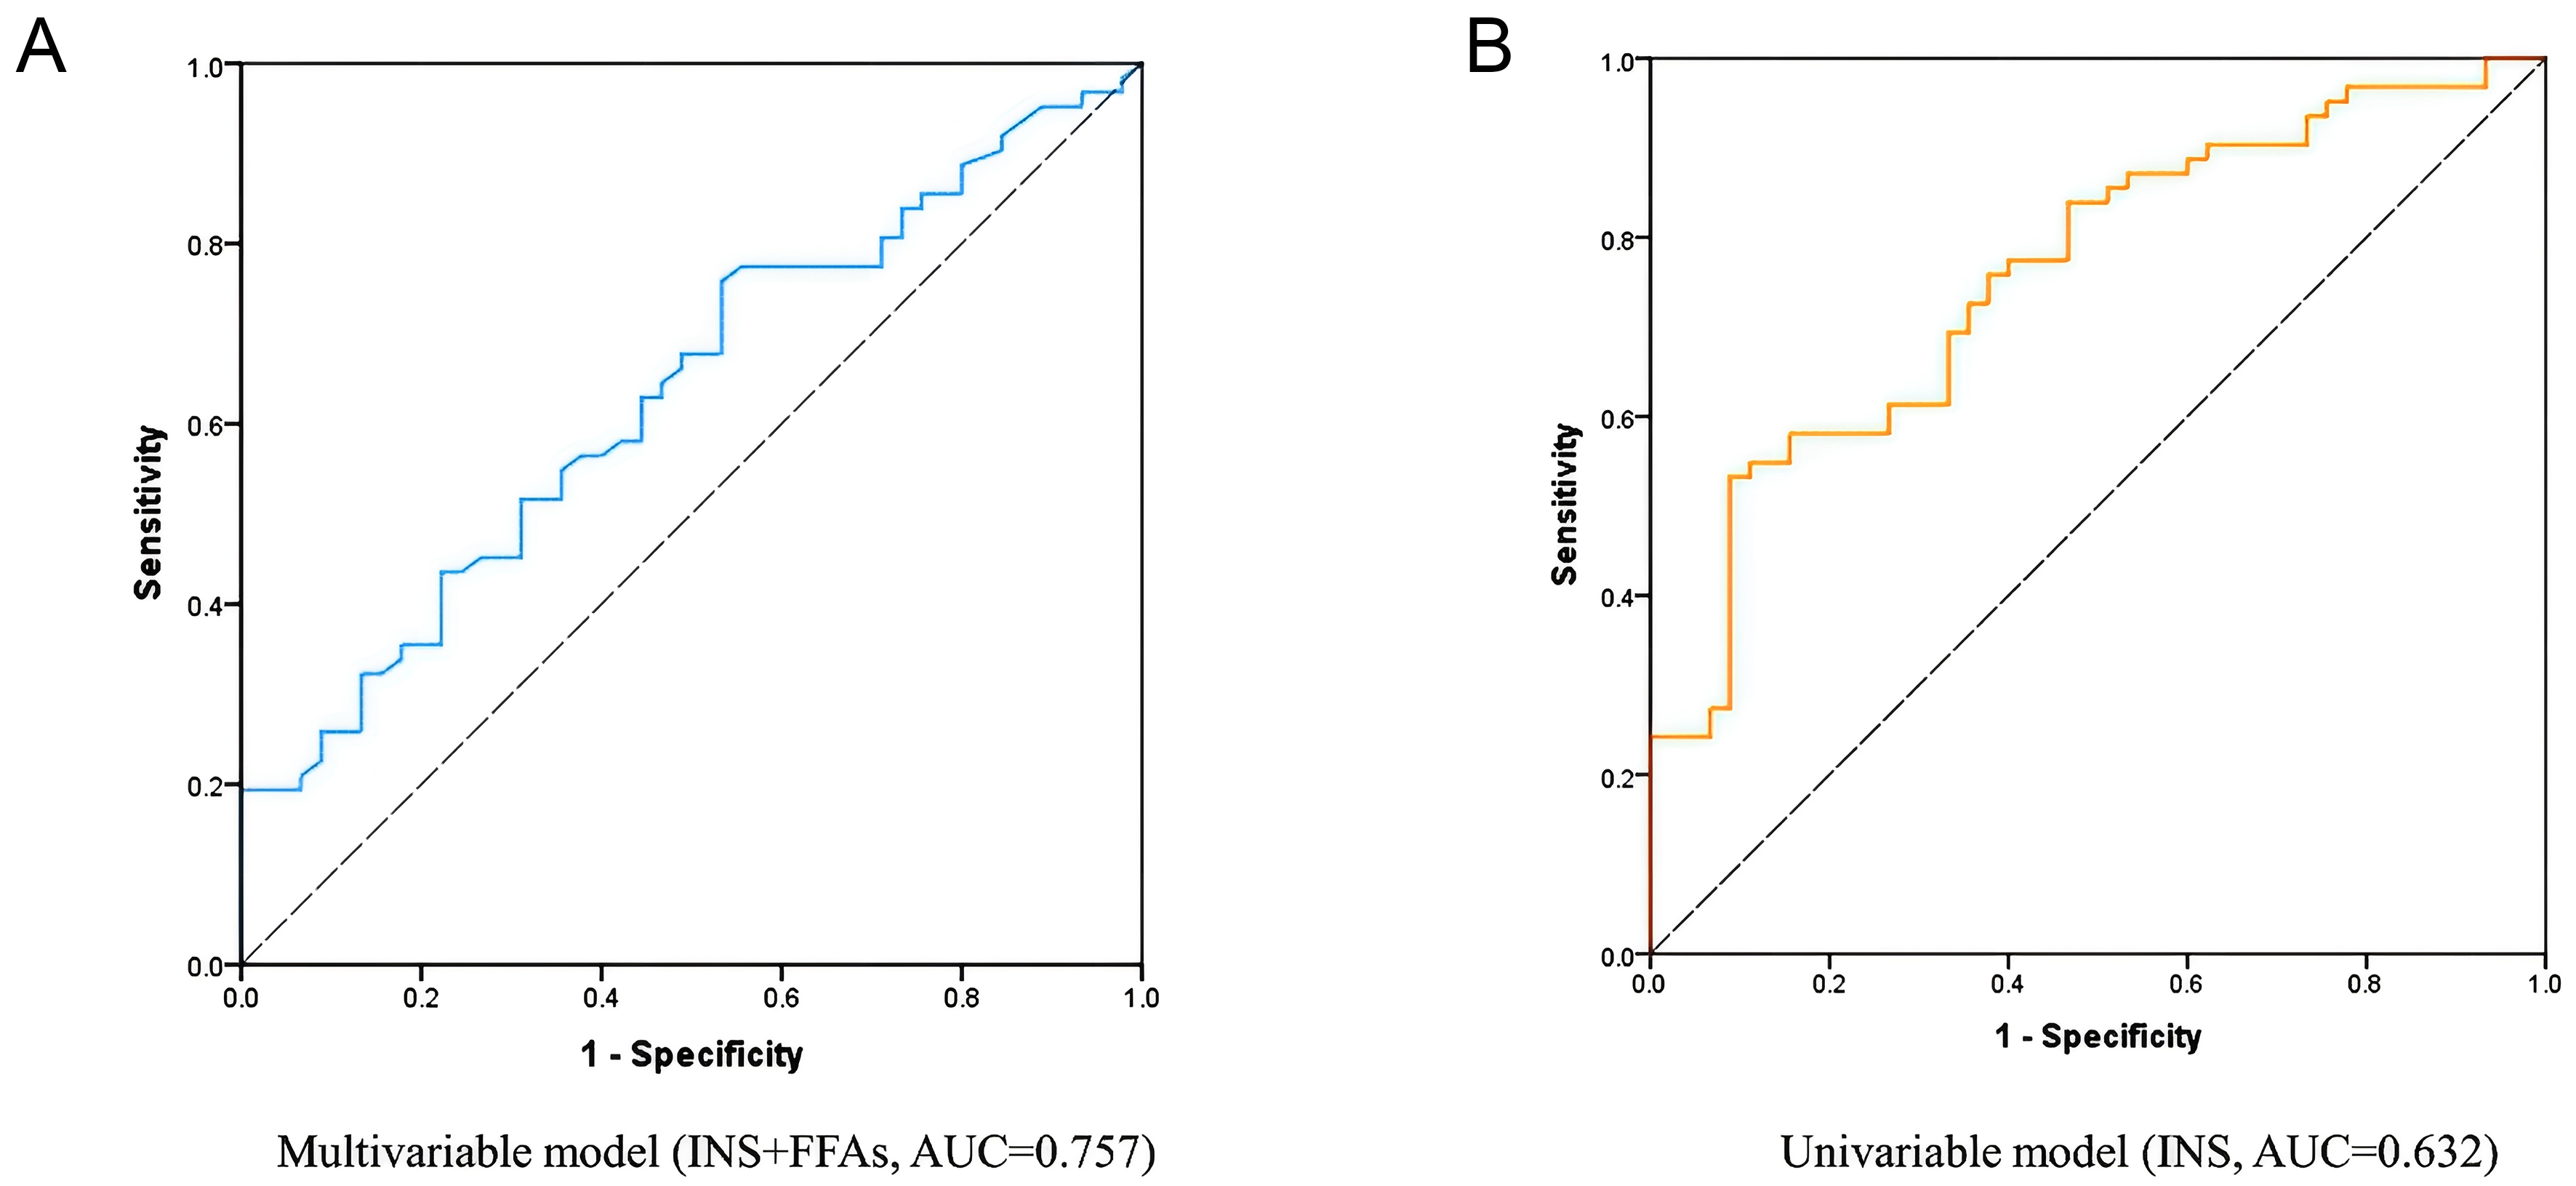
Figure 3. ROC curves for LVH prediction. (A) Combined model incorporating INS and FFAs; (B) INS-only model. The combined model yielded an AUC of 0.757 (95%CI: 0.667-0.848), compared with 0.632 (95%CI: 0.525-0.739) for the INS-only model. ROC: Receiver operating characteristic; LVH: left ventricular hypertrophy; INS: insulin; FFAs: free fatty acids; AUC: area under the curve; CI: confidence interval.


