


fig6
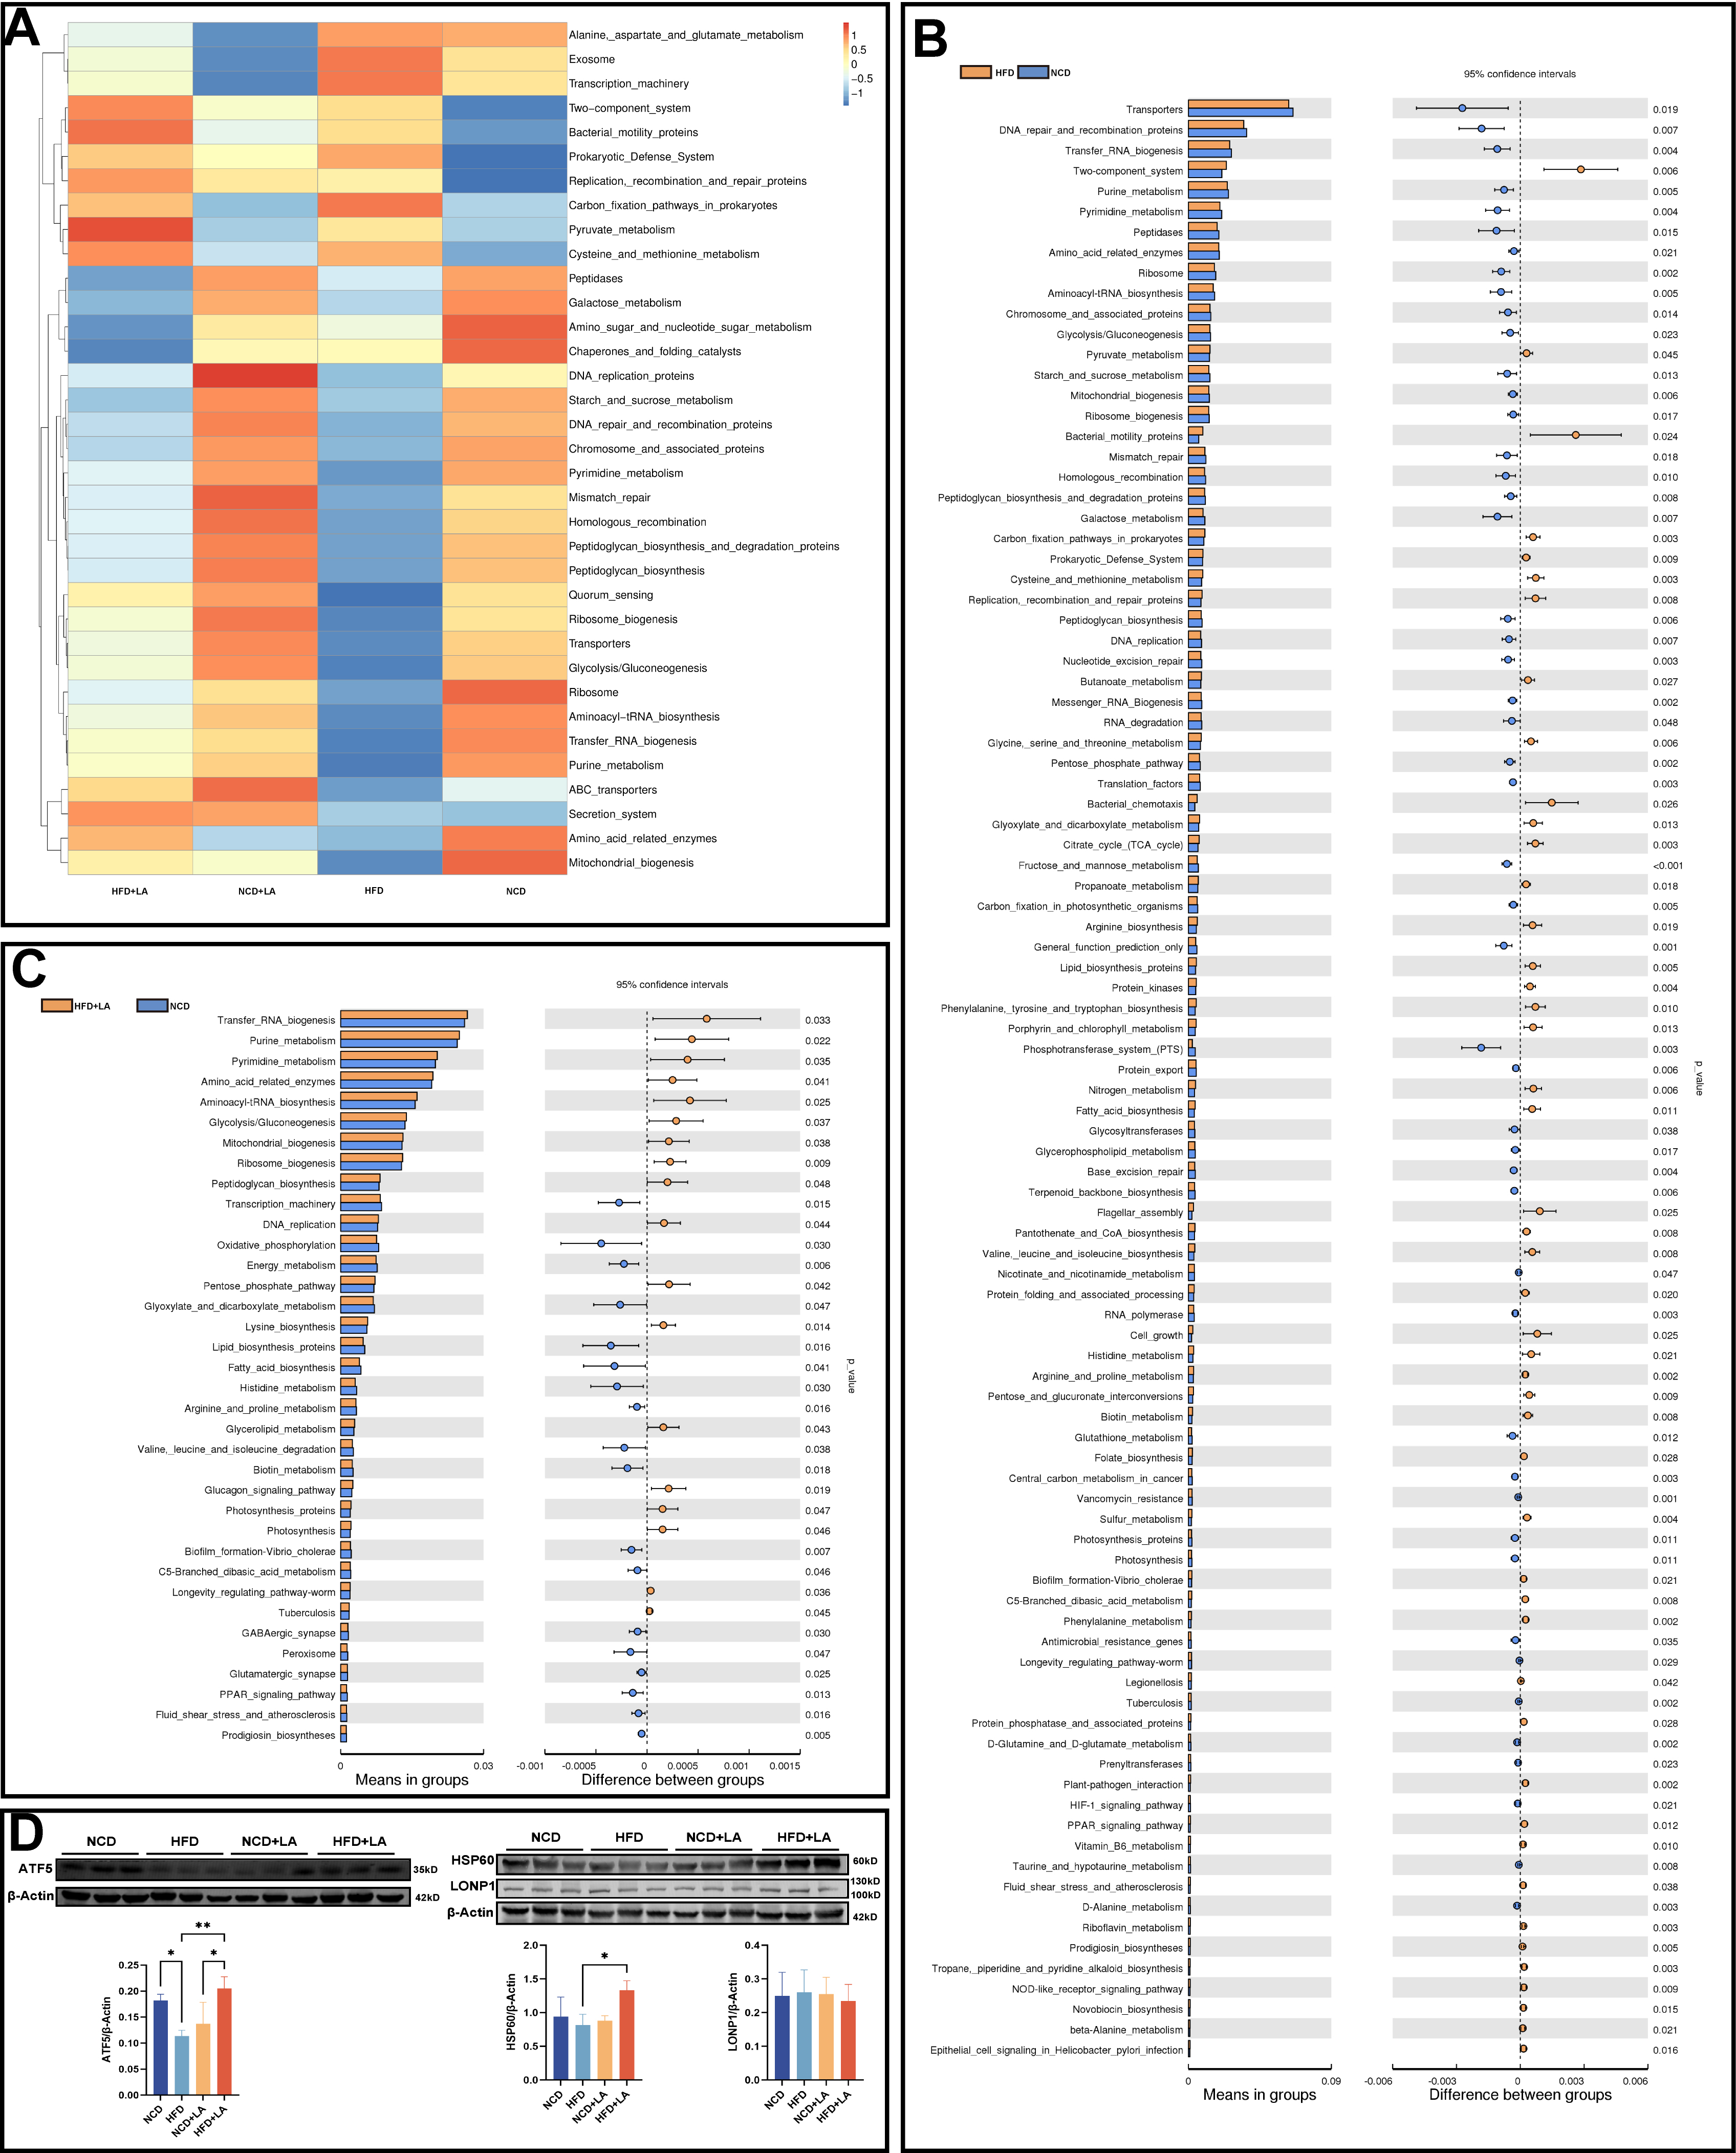
Figure 6. Functional prediction of gut microbiota. (A) Tax4Fun feature annotation clustering heatmap; (B) t-test analysis of functional differences between NCD and HFD groups and (C) between HFD and HFD + LA groups; (D) Western blotting of HSP60, ATF5, and LONP1 in the liver of 4 groups of mice. (****P < 0.0001, ***P < 0.001, **P < 0.01, and*P < 0.05.). NCD: Normal chow diet; HFD: high-fat diet; LA: L-arabinose; ATF5: transcription factor 5; HSP60: heat shock protein 60; LONP1: Lon protease 1.


