


fig5
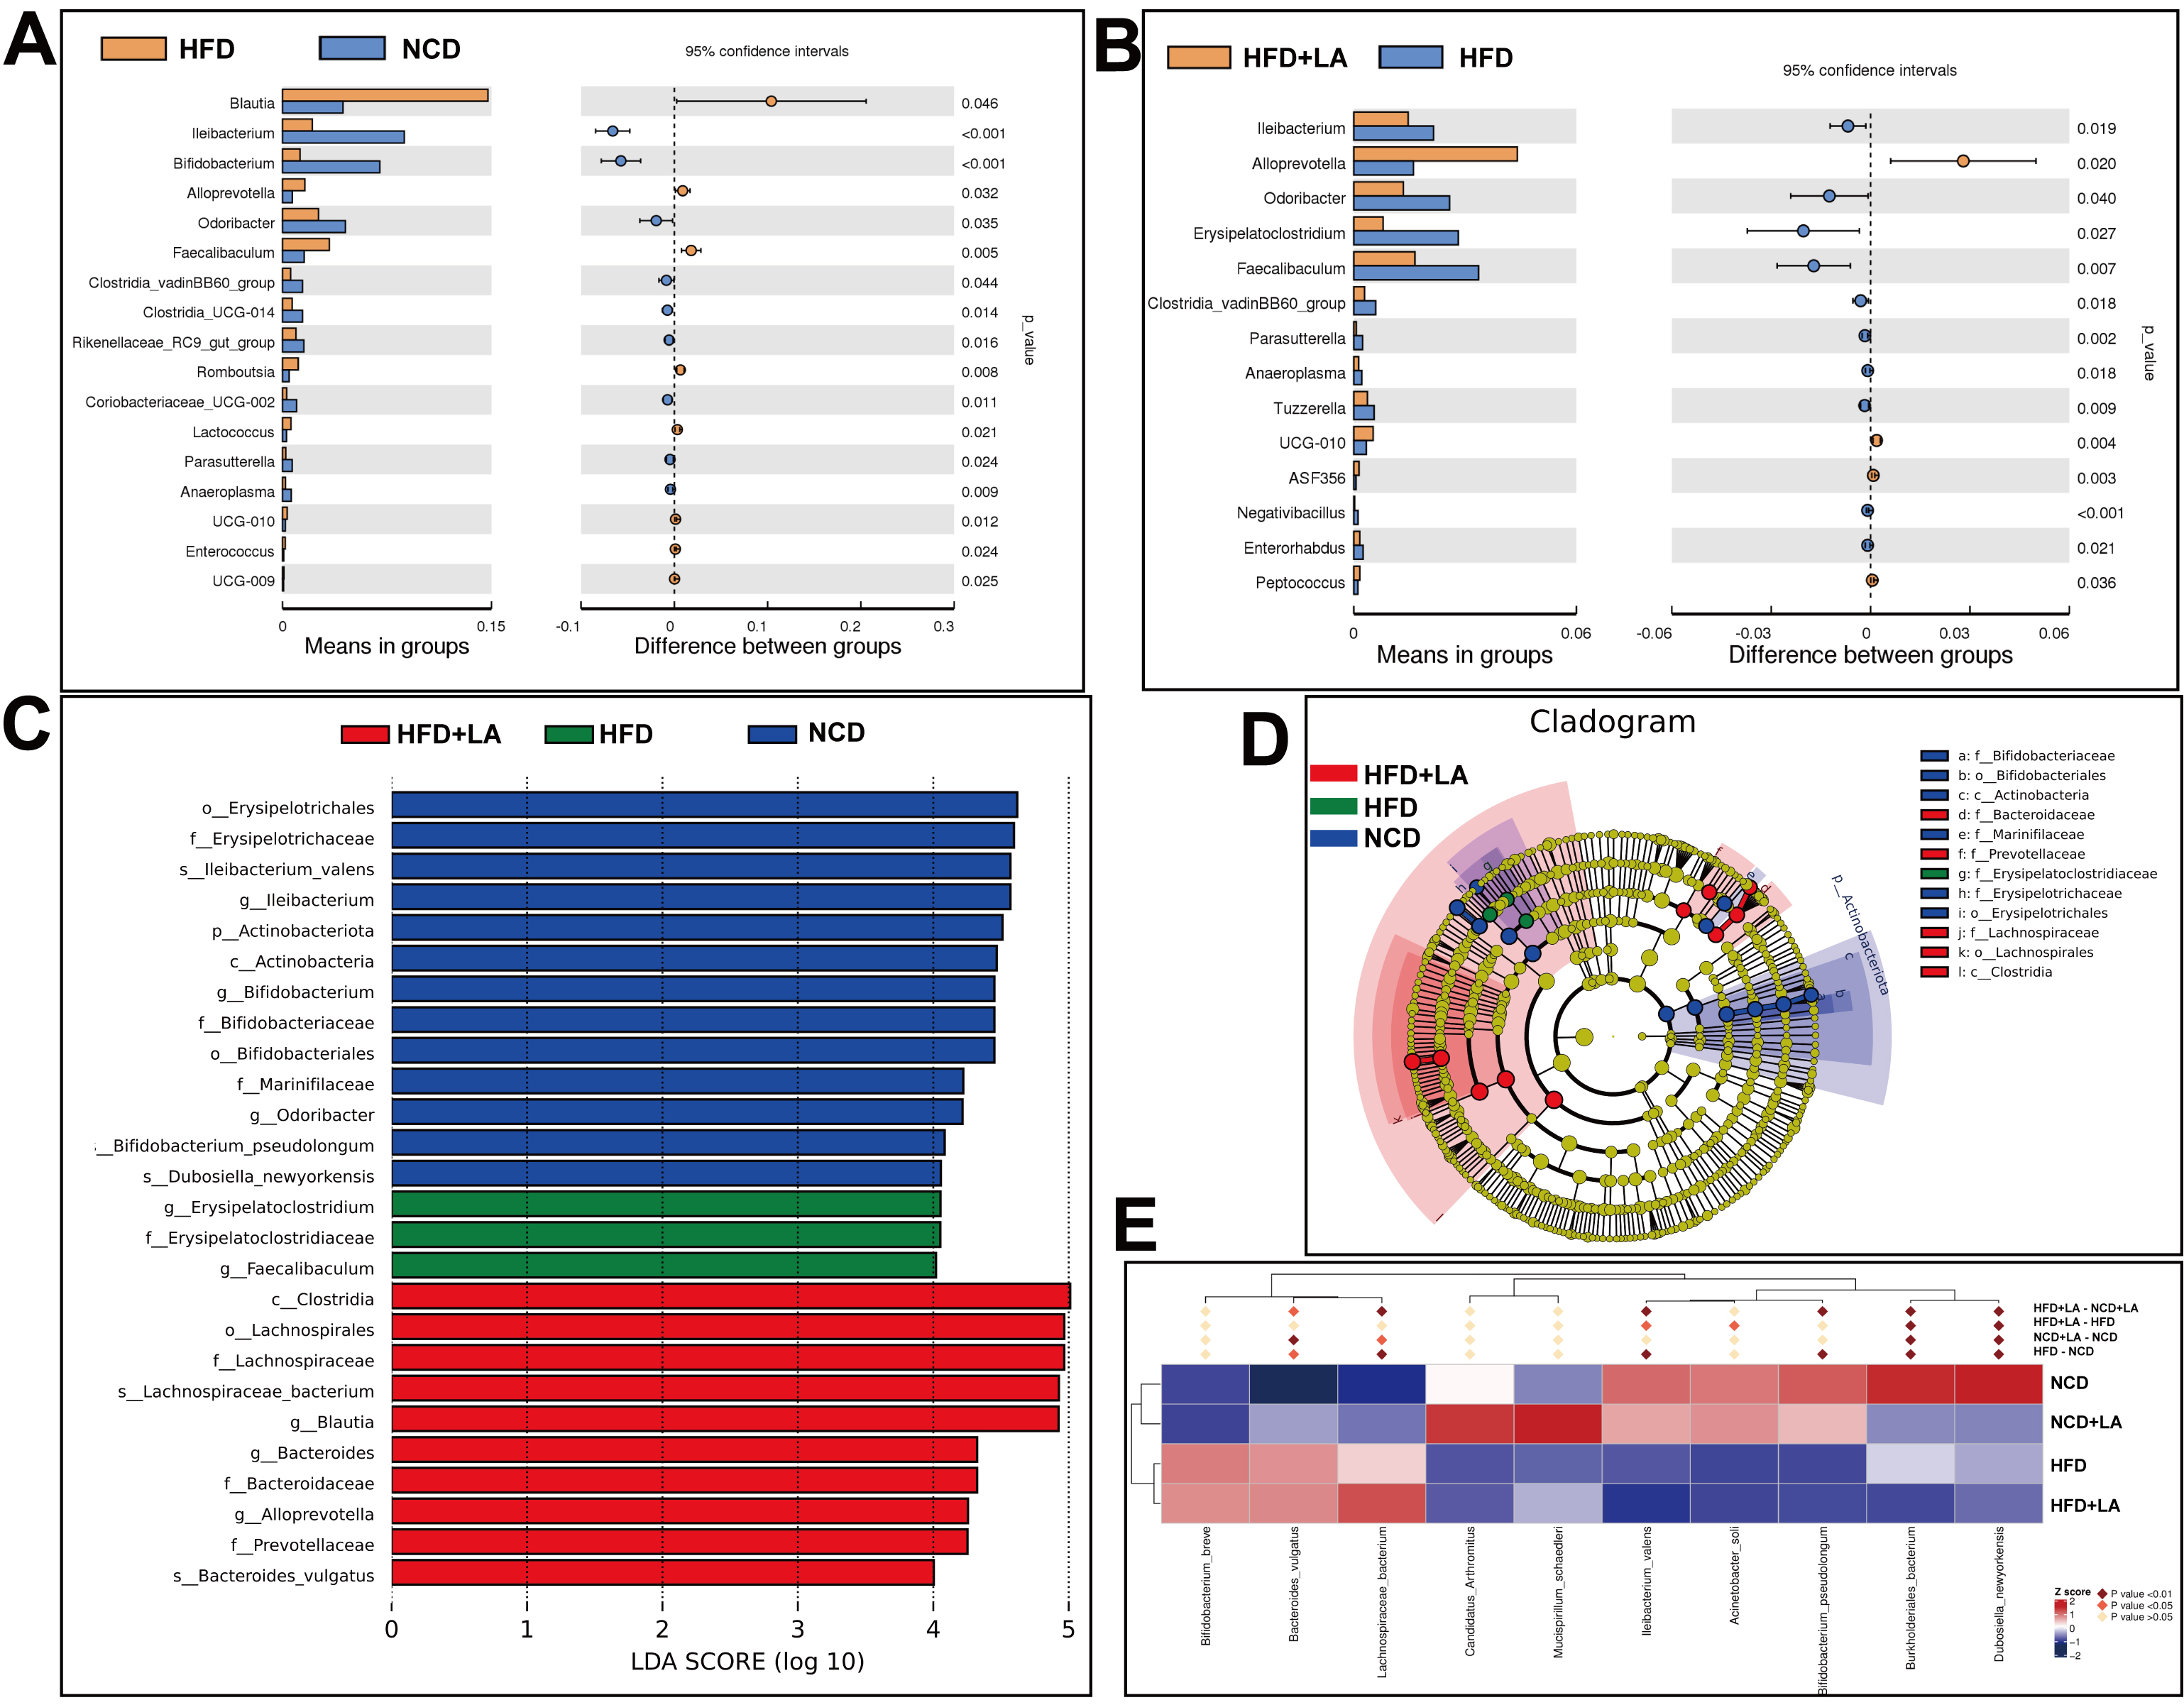
Figure 5. Statistical analysis of gut microbiota. (A) t-test between HFD and NCD (P < 0.05); (B) t-test between HFD and HFD + LA (P < 0.05); (C and D) Difference analysis of LEfSe (LDA effect size was used to compare the statistical significance and correlation of the 4 groups of bacteria) with the threshold set to 4; (E) Metastat heatmap. (n = 6 for each group). NCD: Normal chow diet; HFD: high-fat diet; LA: L-arabinose; LEfSe: linear discriminant analysis effect size; LDA: linear discriminant analysis.


