


Associations of estimated pulse wave velocity with cardiovascular-kidney-metabolic syndrome in U.S. adults: the role of sex and ethnicity (NHANES 1999-2018)
 0
0 Abstract
Background: Estimated pulse wave velocity (ePWV) is a surrogate marker of arterial stiffness and has been reported as an important risk factor for cardiovascular, kidney, and metabolic disorders. However, the associations of ePWV with cardiovascular-kidney-metabolic (CKM) multimorbidity are limited. We aim to examine the association between ePWV and CKM stages among adults in the United States (US).
Methods: Data were obtained from the National Health and Nutrition Examination Survey (NHANES) conducted between 1999 and 2018. CKM multimorbidity was defined as the concurrent presence of subclinical or clinical cardiovascular disease (CVD), chronic kidney disease (CKD), and metabolic disorders. Participants were classified into five CKM stages according to the clinical severity of these coexisting conditions. ePWV was calculated using a validated formula based on age and blood pressure. All analyses incorporated survey weights, strata, and primary sampling units to account for NHANES’s complex multistage sampling design. Survey-weighted multinomial logistic regression models were applied to evaluate the associations between ePWV and CKM stages.
Results: A total of 21,397 adults from the US aged 20 years or older were included in the analysis. Overall, 17.9% of participants (n = 5,406) had an ePWV ≥ 10 m/s. Higher ePWV was associated with more advanced CKM stages. In fully adjusted models, each 1 m/s increase in ePWV was associated with higher odds of CKM stage 1 [odds ratios (ORs) 1.50, 95% confidence interval (CI) 1.36-1.66], stage 2 (OR 3.04, 95% CI 2.73-3.38), stage 3 (OR 8.08, 95% CI 7.12-9.16), and stage 4 (OR 4.49, 95% CI 4.01-5.03), compared with CKM stage 0. Significant interactions by sex and ethnicity were observed. The associations between ePWV and advanced CKM stages (stages 3-4) were stronger in males than in females, and Black individuals had higher odds of advanced CKM stages compared with White or Mexican individuals (all P for interaction < 0.05).
Conclusions: Greater arterial stiffness, as indicated by higher ePWV, was associated with an increased risk of CKM multimorbidity after adjustment for sociodemographic characteristics, lifestyle factors, and CKM-related risk factors.
Keywords
INTRODUCTION
Cardiovascular-kidney-metabolic (CKM) syndrome is associated with premature mortality and increased morbidity in the United States (US), resulting in substantial social and economic burdens[1,2]. The shared mechanisms and interconnections among cardiovascular, renal, and metabolic disorders exacerbate the progression of CKM multimorbidity[3,4]. Arterial stiffness has been recognized as a common risk factor for cardiovascular disease (CVD), diabetes, and renal damage[5-7]. When cardiovascular, kidney, and metabolic conditions co-occur with arterial stiffness, the risks of CVD and all-cause mortality increase[8-10].
The carotid-femoral pulse wave velocity (cfPWV) is the gold standard to assess aortic stiffness[11]. However, its measurement requires specialized equipment and technical expertise, which limits its widespread use[12]. Estimated pulse wave velocity (ePWV), a surrogate marker calculated from age and mean blood pressure (BP), is widely used due to its accessibility[13]. Its predictive value is independent of both the Framingham Risk Score (FRS) and cfPWV, highlighting significant prognostic interactions between age and BP[14]. Prior studies found that ePWV was associated with multi-organ system disorders, metabolic syndrome (MetS), chronic kidney disease (CKD), CVD, and mortality[15-18]. However, evidence remains limited regarding the association between ePWV and CKM multimorbidity across severity levels. Screening for ePWV may help identify high-risk individuals and guide clinical care, promoting healthy vascular aging for the prevention and management of CKM multimorbidity.
In this study, we aim to investigate the association between ePWV and stages of CKM multimorbidity among US adults using data from the National Health and Nutrition Examination Survey (NHANES).
METHODS
Study population
Data were drawn from ten consecutive NHANES cycles conducted between 1999 and 2018, publicly available from the Centers for Disease Control and Prevention website (http://www.cdc.gov/nchs/nhanes.htm). NHANES uses a multistage, stratified probability sampling design to provide a cohort representative of the US civilian, noninstitutionalized population[19]. The survey was approved by the National Center for Health Statistics Research Ethics Review Board, and written informed consent was obtained from all participants or their parents/guardians[20]. For this analysis, we included nonpregnant adults aged ≥ 20 years who completed both the physical examination and fasting laboratory assessments at the Mobile Examination Center (MEC). Participants with missing ePWV values (n = 1,063) or incomplete information for CKM syndrome determination (n = 1,406) were excluded, resulting in 21,397 eligible individuals [Supplementary Figure 1].
Calculation of ePWV
BP was measured at the MEC by trained physicians following American Heart Association guidelines[21]. Three consecutive seated readings were obtained, and an additional measurement was taken if any reading was interrupted or incomplete. The final BP value was calculated as the average of the three complete readings.
The ePWV was calculated from the baseline age and BP: ePWV = 9.587 - (0.402 × age) + (4.560 × 10⁻³ × age2) - (2.621 × 10⁻⁵ × age2 × MAP) + (3.176 × 10⁻³ × age × MAP) - (1.832 × 10⁻² × MAP). Mean arterial pressure (MAP) was calculated from diastolic BP (DBP, mmHg) and systolic BP (SBP, mmHg) using MAP = DBP + 0.4 × (SBP - DBP)[22]. Higher ePWV values indicated greater arterial stiffness. We further stratified ePWV using a clinical cut-off of 10 m/s[23].
Assessments of CKM syndrome
Data were obtained through standardized questionnaires and physical examinations. Blood and random urine samples were processed and analyzed at a central laboratory. The estimated glomerular filtration rate (eGFR) was calculated using the 2021 ethnicity-neutral Chronic Kidney Disease Epidemiology Collaboration (CKD-EPI) creatinine equation[24].
CKM syndrome was defined as the co-existence of CKD, metabolic disorders, and either clinical or subclinical CVD [Supplementary Table 1]. Briefly, clinical CVD was defined as any self-reported history of chronic heart failure, coronary heart disease, heart attack, or stroke. Subclinical CVD was defined as a predicted 10-year CVD risk ≥ 20%, or the presence of very high-risk CKD. The 10-year CVD risk was estimated using a simplified CKM risk algorithm that incorporates age, sex, smoking status, BP, cholesterol levels, diabetes status, kidney function, and use of antihypertensive or statin medications (as given in Supplementary Table 2)[25]. CKD risk was categorized following the Kidney Disease: Improving Global Outcomes (KDIGO) guidelines, based on eGFR (< 30, 30-44, 45-59, ≥ 60 mL/min/1.73m2) and urinary albumin-to-creatinine ratio (UACR: < 30, 30-299, ≥ 300 mg/g)[26]. CKD was defined as moderate- or high-risk in this study[27]. Metabolic disorders included overweight or obesity, central obesity, prediabetes, diabetes, hypertension, dyslipidemia, and MetS.
To account for varying clinical severity among CKM manifestations, participants were categorized into five stages: Stage 0, all parameters normal; Stage 1, only obesity or prediabetes; Stage 2, metabolic disorders or CKD; Stage 3, subclinical CVD; and Stage 4, clinical CVD[28]. Detailed criteria for each stage are provided in Supplementary Table 3.
Assessments of other covariates
Demographic covariates included sex (male, female) and ethnicity [non-Hispanic White, non-Hispanic Black, Mexican, other Hispanic, and other ethnicities (including Asian or multiracial)]. Mexican and other Hispanic participants were analyzed separately because, before 2007, NHANES specifically oversampled Mexican individuals rather than the broader Hispanic population[29]. Socioeconomic covariates included the poverty-to-income ratio (PIR), educational attainment, and employment status. PIR was categorized as low (≤ 1), medium (1-4), or high (≥ 4)[30]. Education levels were classified as low (less than high school), medium (high school graduate or equivalent), and high (college or higher). Employment status was categorized as unemployed or employed (including retirees and students). An overall socioeconomic status (SES) variable was derived using latent class analysis integrating income, education, and employment, and classified into three levels: poor, medium, and good [Supplementary Figure 2][31,32].
Lifestyle characteristics were collected via self-reported questionnaires and included smoking status (never, former, or current), alcohol consumption (never, former, or current), physical activity level (inactive or active), and diet quality assessed using the Healthy Eating Index (HEI)-2010 (score range: 0-100) calculated from a 24-h dietary recall. The HEI reflects adherence to the Dietary Guidelines for Americans[33,34]. Physical inactivity was defined as the absence of self-reported moderate or vigorous activity in a typical week. CKM risk factors included body mass index (BMI), glycated hemoglobin (HbA1c), total cholesterol (TC), high-density lipoprotein cholesterol (HDL-C), eGFR, and self-reported histories of cancer, liver disease, and lung disease.
Statistical analysis
Following the analytic procedures recommended by the National Center for Health Statistics (NCHS), we accounted for the complex, multistage probability sampling design by incorporating survey strata and primary sampling units[35]. Examination sample weights were applied in all analyses to ensure representativeness of participants who completed the MEC assessments. Continuous variables were reported as weighted means ± standard errors (SEs), and categorical variables as weighted percentages with frequencies. Differences across ePWV categories were assessed using analysis of variance (ANOVA) for continuous variables and design-adjusted chi-square tests for categorical variables. To account for multiple comparisons of baseline characteristics, P values were adjusted using the Benjamini-Hochberg procedure to control the false discovery rate. Raw P values were ranked from smallest to largest, and adjusted P value was calculated by P*(m/i), where i is its rank and m is the total number of tests.
To examine the associations between ePWV and CKM stages, we used survey-weighted multinomial logistic regression to estimate odds ratios (ORs) and 95% confidence intervals (CIs) per 1 m/s increase in ePWV, with stage 0 as the reference. Ordinal logistic regression was not used because the proportional odds assumption was violated. We sequentially fitted four models: (1) a crude model including only ePWV; (2) an adjusted model adding socio-demographic covariates (sex, ethnicity, and SES levels); (3) a model further including lifestyle covariates (smoking, alcohol consumption, physical activity, and HEI-2010 score); and (4) a fully adjusted model incorporating socio-demographic, lifestyle, and CKM risk factors (BMI, HbA1c, TC, HDL-C, eGFR, and history of cancer, liver disease, or lung disease).
We also conducted additional analyses to assess the robustness of our findings. Because socio-demographics varied across ePWV and CKM stages, we performed subgroup analyses by age (20-64 years, ≥ 65 years), sex (female, male), ethnicity (White, Black, Mexican), and SES levels (poor, medium, good). We further repeated the main analysis after excluding participants with missing covariates. CKM conditions included CVD, CKD, and metabolic disorders (detailed in Supplementary Table 1). To evaluate the impact of ePWV on the number and patterns of CKM multimorbidity, we also estimated its associations with the counts and combinations of CKM conditions using the same models as the main analysis.
The proportion of missing covariates is presented in Supplementary Table 4. Missing data for continuous and categorical covariates were addressed using 10 multiple imputations by chained equations[36,37]. All analyses were conducted using Statistics Analysis System (SAS) version 9.4 (SAS Institute, Cary, NC, US) and R version 4.3.2 (R Foundation for Statistical Computing, Vienna, Austria), with statistical significance defined as a two-sided P value < 0.05.
RESULTS
Baseline characteristics
Our study included 21,397 participants aged ≥ 20 years, representing 90,770,061 noninstitutionalized US adults. The mean age was 47.1 years (SE 16.6), 50.7% (n = 10,888) were female, and 69.3% (n = 9,631) were non-Hispanic White [Table 1]. Compared with the included participants, those with missing ePWV or CKM stage information were more likely to be older, non-Hispanic Black, and have higher BMI, higher HbA1c, and lower eGFR [Supplementary Table 5]. A total of 17.9% (n = 5,406) of participants had an ePWV of 10 m/s or higher. Compared with those with ePWV < 10 m/s, participants with ePWV ≥ 10 m/s were more likely to be female, non-Hispanic White, have a history of cancer, be physically inactive, have higher HbA1c and TC, lower eGFR, and less likely to have a high SES level. These differences remained consistent after adjustment for false discovery rate.
Participant characteristics by ePWV subgroups
| Characteristica | Overall N = 21,397 | ePWV < 10 m/s N = 15,991 | ePWV ≥ 10 m/s N = 5,406 | P value | FDR-adjusted P value |
| Weighted percentage % | 21,397 (100.0) | 15,991 (82.1) | 5,406 (17.9) | ||
| Age (year) | 47.10 (16.64) | 41.82 (12.99) | 71.33 (7.66) | < 0.001 | < 0.001 |
| Female % | 10,888 (50.7) | 8,233 (50.0) | 2,655 (54.0) | < 0.001 | 0.001 |
| Ethnicity % | < 0.001 | < 0.001 | |||
| Non-Hispanic White | 9,631 (69.3) | 6,700 (67.3) | 2,931 (78.3) | ||
| Non-Hispanic Black | 4,201 (10.3) | 3,210 (10.6) | 991 (8.8) | ||
| Mexican | 3,804 (8.1) | 3,039 (9.0) | 765 (4.0) | ||
| Other Hispanic | 1,823 (5.6) | 1,461 (6.0) | 362 (3.6) | ||
| Otherb | 1,938 (6.7) | 1,581 (7.0) | 357 (5.3) | ||
| SES level % | < 0.001 | < 0.001 | |||
| Poor | 4,945 (15.5) | 3,820 (16.2) | 1,125 (12.6) | ||
| Medium | 11,201 (49.9) | 8,035 (48.1) | 3,166 (58.3) | ||
| Good | 5,251 (34.6) | 4,136 (35.8) | 1,115 (29.1) | ||
| Smoking % | < 0.001 | < 0.001 | |||
| Never | 11,488 (52.9) | 8,826 (53.7) | 2,662 (49.0) | ||
| Former | 5,434 (25.7) | 3,270 (22.3) | 2,164 (41.4) | ||
| Current | 4,475 (21.4) | 3,895 (24.0) | 580 (9.6) | ||
| Alcohol drinking % | < 0.001 | < 0.001 | |||
| Never | 2,780 (10.2) | 1,869 (9.2) | 911 (14.9) | ||
| Former | 3,628 (14.3) | 2,446 (12.8) | 1,182 (21.1) | ||
| Current | 14,989 (75.5) | 11,676 (78.0) | 3,313 (64.1) | ||
| Active physical activity % | 11,005 (58.0) | 8,794 (60.4) | 2,211 (47.1) | < 0.001 | < 0.001 |
| HEI-2010 score | 51.82 (14.42) | 50.44 (14.30) | 56.04 (14.08) | < 0.001 | < 0.001 |
| BMI (kg/m2) | 28.66 (6.57) | 28.66 (6.70) | 28.64 (5.90) | 0.886 | 0.886 |
| HbA1c (%) | 5.57 (0.91) | 5.49 (0.88) | 5.92 (0.96) | < 0.001 | 0.001 |
| TC (mg/dl) | 195.48 (41.83) | 194.76 (41.28) | 198.78 (44.14) | < 0.001 | < 0.001 |
| HDL-C (mg/dl) | 53.70 (16.15) | 53.04 (15.68) | 56.76 (17.83) | < 0.001 | < 0.001 |
| eGFR (mL/min/1.73 m2) | 96.75 (20.36) | 101.41 (17.56) | 75.32 (18.53) | < 0.001 | < 0.001 |
| Cancer % | 1,930 (9.2) | 834 (6.1) | 1,096 (23.5) | < 0.001 | < 0.001 |
| Liver diseases % | 848 (3.7) | 620 (3.6) | 228 (4.5) | 0.021 | 0.022 |
| Lung diseases % | 416 (1.8) | 201 (1.3) | 215 (4.2) | < 0.001 | 0.001 |
Prevalence and overlaps of CKM conditions in each ePWV level
The weighted prevalence of CKM stages is shown in Figure 1. Participants with ePWV ≥ 10 m/s had a higher prevalence of CKM stage 3 (25.3% vs. 0.6%) and stage 4 (24.5% vs. 4.9%), and a lower prevalence of stage 0 (0.9% vs. 14.1%), stage 1 (4.0% vs. 24.3%), and stage 2 (45.2% vs. 56.2%) compared with participants with ePWV < 10 m/s. Regarding the number of coexisting CKM conditions [Supplementary Figure 3], participants with ePWV ≥ 10 m/s were more likely to have 2 or 3 conditions than those with ePWV < 10 m/s. Specifically, participants with ePWV ≥ 10 m/s were more likely to have combinations including CVD and metabolic disorders, whereas those with ePWV < 10 m/s predominantly had only metabolic disorders [Supplementary Table 6].
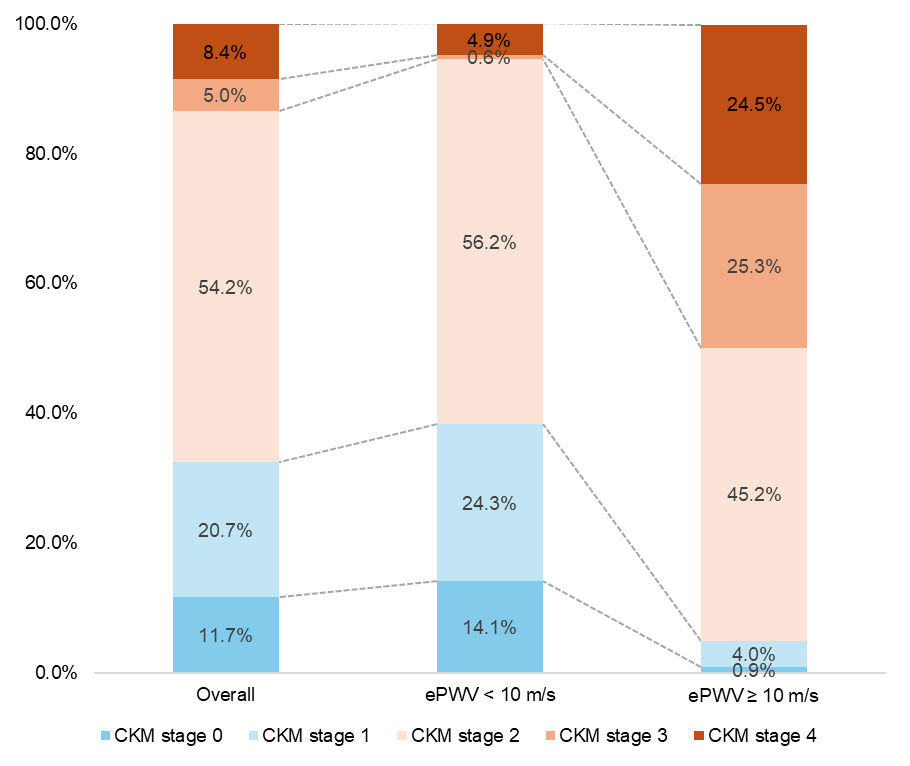
Figure 1. Weighted prevalence of CKM stages in the overall population and by ePWV subgroups. CKM: Cardiovascular-kidney-metabolic; ePWV: estimated pulse wave velocity.
Associations between ePWV and CKM Stages
Across both unadjusted and adjusted models [Table 2], participants with higher ePWV levels were more likely to have CKM syndrome (stages 1-4) compared with those with lower ePWV levels. In the fully adjusted models, each 1 m/s increase in ePWV was associated with higher odds of CKM stage 1 (OR: 1.50, 95% CI: 1.36-1.66), stage 2 (OR: 3.04, 95% CI: 2.73-3.38), stage 3 (OR: 8.08, 95% CI: 7.12-9.16), and stage 4 (OR: 4.49, 95% CI: 4.01-5.03), using stage 0 as the reference.
Associations of ePWV (per 1 m/s increase) with CKM stages
| CKM stages | Unadjusted OR (95% CI) | P value | Adjusteda OR (95% CI) | P value | Adjustedb OR (95% CI) | P value | Adjustedc OR (95% CI) | P value |
| CKM stage 0 | Reference | Reference | Reference | Reference | ||||
| CKM stage 1 | 1.73 (1.57, 1.91) | < 0.001 | 1.77 (1.60, 1.95) | < 0.001 | 1.73 (1.57, 1.90) | < 0.001 | 1.50 (1.36, 1.66) | < 0.001 |
| CKM stage 2 | 3.20 (2.91, 3.52) | < 0.001 | 3.37 (3.06, 3.70) | < 0.001 | 3.41 (3.10, 3.75) | < 0.001 | 3.04 (2.73, 3.38) | < 0.001 |
| CKM stage 3 | 9.06 (8.16, 10.05) | < 0.001 | 9.90 (8.90, 11.00) | < 0.001 | 10.10 (9.06, 11.26) | < 0.001 | 8.08 (7.12, 9.16) | < 0.001 |
| CKM stage 4 | 5.39 (4.86, 5.97) | < 0.001 | 5.80 (5.24, 6.42) | < 0.001 | 5.89 (5.32, 6.53) | < 0.001 | 4.49 (4.01, 5.03) | < 0.001 |
The results were consistent across participants aged ≤ 64 years and ≥ 65 years, and across SES levels (poor, medium, or good; Figure 2). However, significant interactions were observed in sex and ethnicity subgroups across CKM stages 1-4. Males with a 1 m/s increase in ePWV had higher odds of CKM stage 3 or 4 than females (stage 3: males 10.35 [8.40-12.75] vs. females 7.00 [5.95-8.25]; stage 4: males 5.89 [4.84-7.17] vs. females 3.70 [3.22-4.26], all P for interaction < 0.05). Black participants had the highest odds of CKM stage 2 (6.46 [4.70-8.87] vs. White 2.82 [2.51-3.17] vs. Mexican 3.45 [2.49-4.78], P for interaction < 0.001), stage 3 (15.10 [10.65–21.41] vs. White 7.81 [6.80-8.96] vs. Mexican 8.28 [5.18–13.22], P = 0.005), and stage 4 (8.60 [6.23-11.88] vs. White 4.34 [3.81-4.93] vs. Mexican 4.55 [3.25-6.37], P = 0.001). Excluding participants with missing covariates yielded results consistent with the main analysis [Supplementary Table 7].
The dose-response relationship was observed between ePWV and the number of CKM conditions [Supplementary Table 8]. In the fully adjusted model, a 1 m/s increase in ePWV was associated with the highest odds of having three CKM conditions (OR: 4.81, 95% CI: 4.34-5.32). Regarding combinations of CKM conditions, a 1 m/s increase in ePWV was associated with the highest odds for CVD-CKD (OR: 6.65, 95% CI: 4.82-9.18), the 2nd highest for CVD-CKD-metabolic disorders (OR: 5.30, 95% CI: 4.78-5.89), and the 3rd highest for CVD-metabolic disorders (OR: 4.13, 95% CI: 3.72-4.59) [Supplementary Table 9].
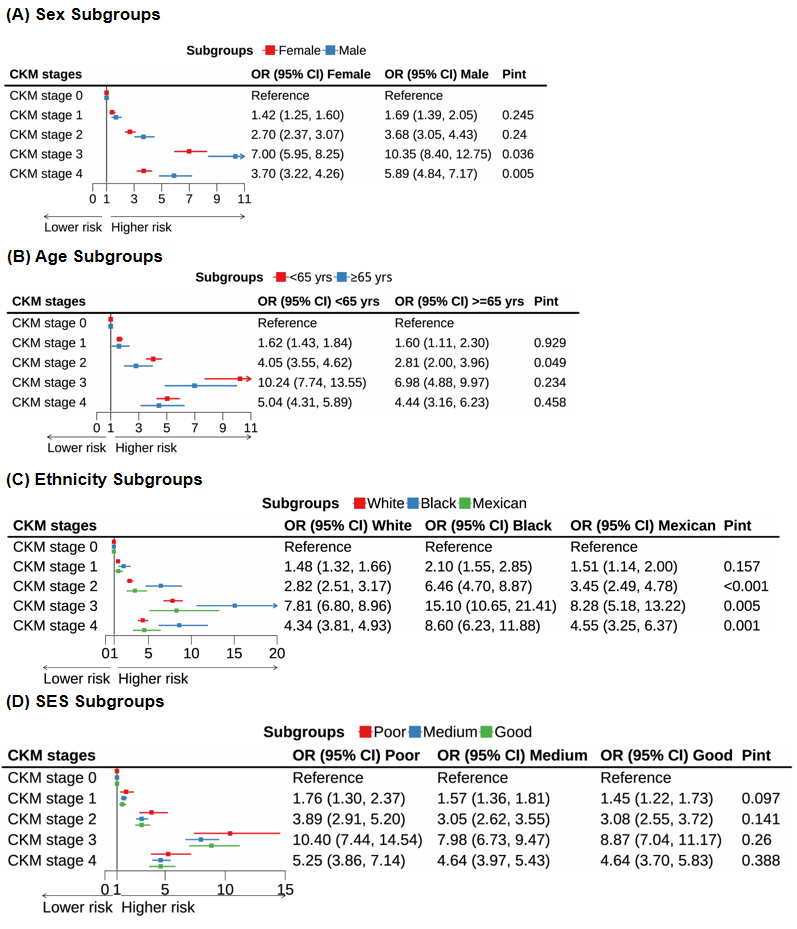
Figure 2. Associations of ePWV (per 1 m/s increase) with CKM stages across subgroups, including (A) sex (female, male); (B) age (< 65 years, ≥ 65 years); (C) ethnicity (White, Black, Mexican); and (D) socioeconomic status (SES: poor, medium, good). Models were adjusted for sex (male, female), ethnicity (non-Hispanic White, non-Hispanic Black, Mexican, other Hispanic, other), SES levels (poor, medium, good), smoking status (never, former, current), alcohol consumption (never, former, current), physical activity (inactive, active), diet quality (HEI-2010 score, continuous), BMI, HbA1c, TC, HDL-C, eGFR, and self-reported histories of cancer, liver disease, and lung disease (yes, no). ePWV: Estimated pulse wave velocity; CKM: cardiovascular-kidney-metabolic; SES: socioeconomic status; BMI: body mass index; HbA1c: glycated hemoglobin; TC: total cholesterol; HDL-C: high-density lipoprotein cholesterol; eGFR: estimated glomerular filtration rate.
DISCUSSION
By leveraging a large, nationally representative sample of US adults, we assessed the associations between ePWV and CKM stages. Participants with ePWV ≥ 10 m/s were more likely to have CKM stage 3 or 4 compared to those with ePWV < 10 m/s. Higher ePWV was independently associated with CKM syndrome, with stronger associations observed in males and non-Hispanic Black participants. This is the first study to evaluate the relationship between ePWV and CKM stages. Our findings highlight that elevated ePWV is linked to CKM complexity and multimorbidity, emphasizing its potential utility as a risk stratification tool for CKM.
The findings of our study are consistent with previous research linking arterial stiffness to increased cardiovascular, renal, and metabolic risks. Prior studies have demonstrated the prognostic value of PWV, showing that elevated PWV is a significant predictor of cardiovascular events and mortality[18,38,39]. Our results support the notion that PWV can serve as an early biomarker for vascular aging and the onset of CVD. Kim et al. reported that PWV predicts not only cardiovascular risk but also MetS and its components[40], while Beros et al. found that higher PWV is associated with incident CKD[41]. Notably, despite variations in PWV measurement across studies, conclusions were similar. Our study extends these findings by assessing a broader spectrum of CKM conditions across different stages, highlighting the interconnectivity among CVD, CKD, and metabolic disorders. Furthermore, it provides additional evidence that elevated ePWV is a robust marker of CKM multimorbidity, underscoring its relevance for managing chronic diseases in the aging population.
Our study provides important insights into the association between ePWV and combinations of CKM conditions. Notably, elevated ePWV was strongly associated with combinations involving CVD and CKD. It is not surprising that age-BP - estimated arterial stiffness serves as a pivotal link between CVD and CKD through mechanisms such as vascular calcifications, vascular wall remodeling, fluid overload, coronary hypoperfusion, abnormal calcium-phosphate metabolism, inflammation, and activation of the renin-angiotensin system[42-45]. Conversely, the confluence of cardiovascular and renal damage caused by risk factors may also compromise vascular elasticity[38]. High ePWV was also associated with metabolic disorders, especially when CVD and CKD coexist. Current evidence suggests a bidirectional relationship between PWV and diabetes[6]. On one hand, metabolic dysregulation - through mechanisms such as endothelial dysfunction, oxidative stress, low-grade inflammation, and altered adipokine signaling - can accelerate arterial stiffening[46-48]. On the other hand, increased arterial stiffness may impair microvascular perfusion and insulin delivery to peripheral tissues, contributing to glucose intolerance and metabolic disorders[49,50]. Emerging evidence indicates that metabolic dysfunction-associated steatotic liver disease (MASLD) may play a key mediating role linking metabolic dysfunction with vascular and renal injury. Meta-analyses show that MASLD is strongly associated with increased arterial stiffness, independent of traditional metabolic risk factors[51], and longitudinal data indicate that higher ePWV predicts incident MASLD[52]. MASLD also contributes to systemic inflammation, insulin resistance, and endothelial dysfunction, mechanisms that may partly explain the clustering of high ePWV with advanced CKM stages[53,54]. In our study, participants with ePWV ≥ 10 m/s had a higher prevalence of self-reported liver disease (4.5% vs. 3.6%), supporting this interconnected pathway, particularly since MASLD is the most common form of chronic liver disease in the general population[55].
Furthermore, our study found that sex and ethnicity influenced the association between ePWV and CKM stages. Males with elevated ePWV had higher odds of progressing to CKM stages 3 and 4 compared to females, which may reflect sex-specific vascular and cardiometabolic mechanisms. For example, males tend to accumulate more visceral adipose tissue, linked to low-grade systemic inflammation, insulin resistance, and CVD[56], potentially amplifying the association between arterial stiffness and advanced CKM stages. Moreover, MASLD - a key driver of metabolic and vascular dysfunction - exhibits strong sexual dimorphism, with higher prevalence and faster fibrosis progression in males[57,58], further strengthening the link between arterial stiffness and CKM multimorbidity. In contrast, estrogens in females exert vascular protective effects, including improved endothelial function and reduced arterial stiffening[59], which may mitigate the stiffness-CKM association. Regarding ethnicity, Black participants had higher odds of advanced CKM stages compared to White or Mexican participants. Black individuals generally exhibit higher rates of diabetes and obesity, known risk factors for arterial stiffness and CKM multimorbidity[60]. The higher prevalence of hypertension in Black individuals, along with socioeconomic disparities and limited access to healthcare, may also contribute to these observed disparities[61]. Additionally, genetic predisposition to early arterial stiffening in Black populations may explain the elevated ePWV and advanced CKM stages observed[62]. These sex and racial disparities underscore the importance of tailored interventions to reduce the burden of CKM conditions in vulnerable populations.
To our knowledge, this is the first study to investigate the association between ePWV and multidimensional staging of CKM multimorbidity. While prior studies examined independent links between arterial stiffness and individual CKM components, such as CVD, CKD, or metabolic dysfunction, these conditions were largely considered in isolation. In contrast, our study adopts the recently proposed CKM framework, conceptualizing CVD, CKD, and metabolic disorders as interconnected manifestations of a shared pathophysiological continuum. We demonstrate that higher ePWV is associated not only with the presence but also with the severity and staging of CKM multimorbidity, particularly in combinations involving CVD and CKD. These findings provide novel evidence that arterial stiffness may serve as a biomarker reflecting the cumulative burden of interrelated cardiorenal-metabolic damage. Consequently, ePWV emerges not merely as a predictor of isolated outcomes but as a potential tool for risk stratification across the CKM spectrum, offering clinical utility for the early identification of individuals at highest risk for complex, multiorgan disease trajectories.
Our study has several limitations. First, ePWV was calculated from age and BP. Although it is a reliable proxy for arterial stiffness[38], it may not fully reflect vascular health, and its clinical use should complement, not replace, direct vascular assessments such as cfPWV, which could be incorporated in future studies to validate our findings. Second, NHANES lacks longitudinal data on CKM stage progression and associated conditions. Third, some CKM-related variables were self-reported, introducing potential misclassification and recall bias. Moreover, NHANES does not capture certain cardiovascular conditions, including atrial fibrillation and peripheral artery disease, which may underestimate the prevalence of CKM stage 4. Fourth, as a repeated cross-sectional survey, the sampled population may differ demographically from the current US population, limiting generalizability, particularly to Asian and other underrepresented ethnic groups. The cross-sectional design also prevents causal inference between ePWV and CKM progression, underscoring the need for longitudinal studies to assess whether elevated ePWV contributes directly to CKM development. Finally, despite adjustment for key covariates, residual confounding from unmeasured factors cannot be excluded.
In conclusion, elevated ePWV was associated with a higher likelihood of CKM syndrome and a greater burden of CKM conditions. Significant sex and racial/ethnic disparities were observed in the relationship between ePWV and CKM multimorbidity, suggesting that targeted interventions may be needed to address these differences. Our findings highlight the value of arterial stiffness as both a biomarker of vascular health and an indicator of CKM burden. Incorporating ePWV into routine clinical assessments could enable healthcare providers to better stratify risk and tailor interventions for individuals at high risk of developing CKM conditions.
DECLARATIONS
Authors’ contributions
Writing - original draft: Yi S
Software: Yi S
Methodology: Yi S, Zhao H, Li J, Lei L
Investigation: Yi S, Zhao H, Li J, Lei L
Formal analysis: Yi S, Li J, Lei L
Data curation: Yi S, Zhao H, Li J, Lei L
Funding acquisition: Zhao H
Supervision: Yu Q
Project administration: Yu Q
Conceptualization: Yu Q
All authors have read and approved the final manuscript.
Availability of data and materials
The datasets generated and/or analyzed during the current study are publicly available from the National Health and Nutrition Examination Survey (NHANES), in accordance with government policy. They can be accessed at http://www.cdc.gov/nchs/nhanes.htm. The raw data cannot be redistributed by researchers, and at present, it is not possible for other researchers to apply for direct access to these data.
Financial support and sponsorship
This work was supported by the Sailing Project of the Scientific Research Foundation of Jining No. 1 People’s Hospital, Jining, Shandong, China (Grant number: 2023-QHM-004).
Conflicts of interest
The authors declare that the research was conducted in the absence of any commercial or financial relationships. The authors have no conflicts of interest to declare.
Ethical approval and consent to participate
The NHANES study was approved by the National Center for Health Statistics Research Ethics Review Board, and written informed consent was obtained from all participants or their parents/guardians.
Consent for publication
Not applicable.
Copyright
© The Author(s) 2025.
Supplementary Materials
REFERENCES
2. Ndumele CE, Neeland IJ, Tuttle KR, et al. ; American Heart Association. A Synopsis of the evidence for the science and clinical management of cardiovascular-kidney-metabolic (CKM) syndrome: a scientific statement from the American Heart Association. Circulation. 2023;148:1636-64.
3. Larqué E, Labayen I, Flodmark CE, et al. From conception to infancy - early risk factors for childhood obesity. Nat Rev Endocrinol. 2019;15:456-78.
4. Baccarelli AA, Ordovás J. Epigenetics of early cardiometabolic disease: mechanisms and precision medicine. Circ Res. 2023;132:1648-62.
5. Grassi D, Ferri C. Aortic stiffness, blood pressure and renal dysfunction. Intern Emerg Med. 2011;6 Suppl 1:111-4.
6. Zheng M, Zhang X, Chen S, et al. Arterial stiffness preceding diabetes: a longitudinal study. Circ Res. 2020;127:1491-8.
7. Regnault V, Lacolley P, Laurent S. Arterial stiffness: from basic primers to integrative physiology. Annu Rev Physiol. 2024;86:99-121.
8. Quiles J, Morillas P, Bertomeu V, et al. ; Prevalence of Peripheral Arterial Disease in Patients with Acute Coronary Syndrome (PAMISCA) Investigators. Combination of ankle brachial index and diabetes mellitus to predict cardiovascular events and mortality after an acute coronary syndrome. Int J Cardiol. 2011;151:84-8.
9. Voicehovska JG, Bormane E, Grigane A, et al. Association of arterial stiffness with chronic kidney disease progression and mortality. Heart Lung Circ. 2021;30:1694-701.
10. Daschner C, Kleber ME, Stach K, et al. Association between arterial stiffness, carbamylation, and mortality in patients undergoing coronary angiography with no or mild chronic kidney disease. Cardiorenal Med. 2025;15:83-97.
11. Ben-Shlomo Y, Spears M, Boustred C, et al. Aortic pulse wave velocity improves cardiovascular event prediction: an individual participant meta-analysis of prospective observational data from 17,635 subjects. J Am Coll Cardiol. 2014;63:636-46.
12. Williams B, Mancia G, Spiering W, et al. ; ESC Scientific Document Group. 2018 ESC/ESH Guidelines for the management of arterial hypertension. Eur Heart J. 2018;39:3021-104.
13. Vlachopoulos C, Terentes-Printzios D, Laurent S, et al. Association of estimated pulse wave velocity with survival: a secondary analysis of SPRINT. JAMA Netw Open. 2019;2:e1912831.
14. Vishram-Nielsen JKK, Laurent S, Nilsson PM, et al. ; MORGAM Project. Does estimated pulse wave velocity add prognostic information? : MORGAM prospective cohort project. Hypertension. 2020;75:1420-8.
15. Liu Y, Xu K, Wu S, Qin M, Liu X. Value of estimated pulse wave velocity to identify left ventricular hypertrophy prevalence: insights from a general population. BMC Cardiovasc Disord. 2022;22:157.
16. Cui X, Shi H, Hu Y, et al. Association between estimated pulse wave velocity and in-hospital and one-year mortality of patients with chronic kidney disease and atherosclerotic heart disease: a retrospective cohort analysis of the MIMIC-IV database. Renal Fail. 2024;46:2387932.
17. Ji C, Gao J, Huang Z, et al. Estimated pulse wave velocity and cardiovascular events in Chinese. Int J Cardiol Hypertens. 2020;7:100063.
18. Heffernan KS, Jae SY, Loprinzi PD. Association between estimated pulse wave velocity and mortality in U.S. adults. J Am Coll Cardiol. 2020;75:1862-4.
19. Centers for Disease Control and Prevention (CDC). National Center for Health Statistics (NCHS). National Health and Nutrition Examination Survey Data. Hyattsville, MD: U.S. Department of Health and Human Services, Centers for Disease Control and Prevention. Centers for Disease Control and Prevention; National Center for Health Statistics. Available from: https://www.cdc.gov/nchs/nhanes/index.htm. (accessed 15 December 2025).
20. Centers for Disease Control and Prevention, NCHS Ethics Review Board (ERB) Approval. Centers for Disease Control and Prevention. Available from: https://www.cdc.gov/nchs/nhanes/about/erb.html. (accessed 22 December 2025).
21. Kirkendall WM, Burton AC, Epstein FH, Freis ED. Recommendations for human blood pressure determination by sphygmomanometers. Circulation. 1967;36:980-8.
22. Aimagambetova B, Ariko T, Gardener H, et al. Association of estimated pulse wave velocity with cognitive function in a multiethnic diverse population: the Northern Manhattan study. Alzheimers Dement. 2024;20:4903-13.
24. Inker LA, Eneanya ND, Coresh J, et al. ; Chronic Kidney Disease Epidemiology Collaboration. New creatinine- and cystatin c-based equations to estimate GFR without race. N Engl J Med. 2021;385:1737-49.
25. Khan SS, Coresh J, Pencina MJ, et al. ; American Heart Association. Novel prediction equations for absolute risk assessment of total cardiovascular disease incorporating cardiovascular-kidney-metabolic health: a scientific statement from the American Heart Association. Circulation. 2023;148:1982-2004.
26. Stevens PE, Levin A. ; Kidney Disease: Improving Global Outcomes Chronic Kidney Disease Guideline Development Work Group Members. Evaluation and management of chronic kidney disease: synopsis of the kidney disease: improving global outcomes 2012 clinical practice guideline. Ann Intern Med. 2013;158:825-30.
27. Kidney Disease: Improving Global Outcomes (KDIGO) Diabetes Work Group. KDIGO 2020 clinical practice guideline for diabetes management in chronic kidney disease. Kidney Int. 2020;98:Suppl S1-S115.
28. Ndumele CE, Rangaswami J, Chow SL, et al. ; American Heart Association. Cardiovascular-kidney-metabolic health: a presidential advisory from the American Heart Association. Circulation. 2023;148:1606-35. 0000000000001184].
29. Johnson CL, Paulose-Ram R, Ogden CL, et al. National health and nutrition examination survey: analytic guidelines, 1999-2010. Vital Health Stat 2. 2013;161:1-24.
30. Zhang YB, Chen C, Pan XF, et al. Associations of healthy lifestyle and socioeconomic status with mortality and incident cardiovascular disease: two prospective cohort studies. BMJ. 2021;373:n604.
31. Linzer DA, Lewis JB. poLCA: an R package for polytomous variable latent class analysis. J Stat Soft. 2011;42:1-29.
32. Liu Y, Ge X, Wang Y, Qiao S, Cai Y. How race and socioeconomic status moderate the association between moderate-to-vigorous physical activity and depressive symptoms: a cross-sectional study with compositional data. Br J Sports Med. 2024;58:1401-8.
33. Guenther PM, Casavale KO, Reedy J, et al. Update of the healthy eating index: HEI-2010. J Acad Nutr Diet. 2013;113:569-80.
34. McGuire S. U.S. Department of Agriculture and U.S. Department of Health and Human Services, Dietary Guidelines for Americans, 2010. 7th Edition, Washington, DC: U.S. Government Printing Office, January 2011. Adv Nutr. 2011;2:293-4.
35. Statistics. NCfH. NHANES survey methods and analytic guidelines. US Centers for Disease Control and Prevention. Available from: https://wwwn.cdc.gov/nchs/nhanes/analyticguidelines.aspx. (accessed 15 December 2025).
36. Liu Y, De A. Multiple imputation by fully conditional specification for dealing with missing data in a large epidemiologic study. Int J Stat Med Res. 2015;4:287-95.
37. Lee KJ, Carlin JB. Multiple imputation for missing data: fully conditional specification versus multivariate normal imputation. Am J Epidemiol. 2010;171:624-32.
38. Hametner B, Wassertheurer S, Mayer CC, Danninger K, Binder RK, Weber T. Aortic pulse wave velocity predicts cardiovascular events and mortality in patients undergoing coronary angiography: a comparison of invasive measurements and noninvasive estimates. Hypertension. 2021;77:571-81.
39. Sequí-Domínguez I, Cavero-Redondo I, Álvarez-Bueno C, Pozuelo-Carrascosa DP, Nuñez de Arenas-Arroyo S, Martínez-Vizcaíno V. Accuracy of pulse wave velocity predicting cardiovascular and all-cause mortality. A systematic review and meta-analysis. J Clin Med. 2020;9:2080.
40. Starzak M, Stanek A, Jakubiak GK, Cholewka A, Cieślar G. Arterial stiffness assessment by pulse wave velocity in patients with metabolic syndrome and its components: is it a useful tool in clinical practice? Int J Environ Res Public Health. 2022;19 :10368.
41. Beros A, Sluyter J, Hughes A, Hametner B, Wassertheurer S, Scragg R. Arterial stiffness and incident chronic kidney disease: a large population-based cohort study. J Nephrol. 2024;37:1241-50.
43. Ejiri K, Ding N, Kim E, et al. Association of segment-specific pulse wave velocity with vascular calcification: The ARIC (Atherosclerosis Risk in Communities) study. J Am Heart Assoc. 2024;13:e031778.
44. Lo Cicero L, Lentini P, Sessa C, et al. Inflammation and arterial stiffness as drivers of cardiovascular risk in kidney disease. Cardiorenal Med. 2025;15:29-40.
45. Vervloet MG. Can we reverse arterial stiffness by intervening on CKD-MBD biomarkers? Clin Kidney J. 2023;16:1766-75.
46. Chirinos JA, Segers P, Hughes T, Townsend R. Large-artery stiffness in health and disease: JACC state-of-the-art review. J Am Coll Cardiol. 2019;74:1237-63.
47. Schraml C, Schwenzer NF, Martirosian P, Claussen CD, Schick F. Perfusion imaging of the pancreas using an arterial spin labeling technique. J Magn Reson Imaging. 2008;28:1459-65.
48. Wang X, Bao W, Liu J, et al. Inflammatory markers and risk of type 2 diabetes: a systematic review and meta-analysis. Diabetes Care. 2013;36:166-75.
49. Jahn LA, Hartline L, Liu Z, Barrett EJ. Metformin improves skeletal muscle microvascular insulin resistance in metabolic syndrome. Am J Physiol Endocrinol Metab. 2022;322:E173-80.
50. Tian X, Zuo Y, Chen S, et al. Hypertension, arterial stiffness, and diabetes: a prospective cohort study. Hypertension. 2022;79:1487-96.
51. Giannakodimos A, Oikonomou E, Pantelidis P, et al. Arterial stiffness as a complication of metabolic dysfunction-associated steatotic liver disease: a systematic review and meta-analysis. Expert Rev Gastroenterol Hepatol. 2025;19:413-26.
52. Kim BS, Kim HJ, Shin JH. Association between estimated pulse wave velocity and incident nonalcoholic fatty liver disease in korean adults. Pulse (Basel). 2024;12:1-11.
53. Byrne CD, Armandi A, Pellegrinelli V, Vidal-Puig A, Bugianesi E. Μetabolic dysfunction-associated steatotic liver disease: a condition of heterogeneous metabolic risk factors, mechanisms and comorbidities requiring holistic treatment. Nat Rev Gastroenterol Hepatol. 2025;22:314-28.
54. Manolis AA, Manolis TA, Vouliotis A, Manolis AS. Metabolic dysfunction-associated steatotic liver disease and the cardiovascular system. Trends Cardiovasc Med. 2025;35:258-65.
55. Huang DQ, Wong VWS, Rinella ME, et al. Metabolic dysfunction-associated steatotic liver disease in adults. Nat Rev Dis Primers. 2025;11:14.
56. Cossins BC, van den Munckhof I, Rutten JHW, et al. Sex-specific association between adipose tissue inflammation and vascular and metabolic complications of obesity. J Clin Endocrinol Metab. 2023;108:2537-49.
57. Cherubini A, Della Torre S, Pelusi S, Valenti L. Sexual dimorphism of metabolic dysfunction-associated steatotic liver disease. Trends Mol Med. 2024;30:1126-36.
58. Dileo E, Saba F, Parasiliti-Caprino M, Rosso C, Bugianesi E. Impact of sexual dimorphism on therapy response in patients with metabolic dysfunction-associated steatotic liver disease: from conventional and nutritional approaches to emerging therapies. Nutrients. 2025;17:477.
59. DuPont JJ, Kenney RM, Patel AR, Jaffe IZ. Sex differences in mechanisms of arterial stiffness. Br J Pharmacol. 2019;176:4208-25.
60. Flack JM, Sica DA, Bakris G, et al. ; International society on hypertension in blacks. management of high blood pressure in blacks: an update of the international society on hypertension in Blacks consensus statement. Hypertension. 2010;56:780-800.
61. Li J, Lei L, Wang W, et al. Social risk profile and cardiovascular-kidney-metabolic syndrome in US adults. J Am Heart Assoc. 2024;13:e034996.
Cite This Article
How to Cite
Download Citation
Export Citation File:
Type of Import
Tips on Downloading Citation
Citation Manager File Format
Type of Import
Direct Import: When the Direct Import option is selected (the default state), a dialogue box will give you the option to Save or Open the downloaded citation data. Choosing Open will either launch your citation manager or give you a choice of applications with which to use the metadata. The Save option saves the file locally for later use.
Indirect Import: When the Indirect Import option is selected, the metadata is displayed and may be copied and pasted as needed.
About This Article
Copyright

Data & Comments
Data
0


Comments
Comments must be written in English. Spam, offensive content, impersonation, and private information will not be permitted. If any comment is reported and identified as inappropriate content by OAE staff, the comment will be removed without notice. If you have any queries or need any help, please contact us at [email protected].